

 PDF
PDF ePub
ePub Citation
 Print
Print


Abstract
Objectives
To analyze the effect of cervical lordosis on cervical disc degeneration in patients with a high T1 slope.
Summary of Literature Review
The T1 slope is known to be a parameter that may be very useful in evaluating sagittal balance. We previously reported that a low T1 slope was a potential risk factor for cervical spondylosis, especially in the C6-7 cervical segment. However, no study has analyzed the effect of cervical lordosis in patients with a high T1 slope (>25) on cervical disc degeneration.
Materials and Methods
Seventy-seven patients with a high T1 slope who underwent cervical spine MRI in our orthopedic clinic were enrolled. Patients were divided into 2 groups according to cervical compensation. The radiologic parameters obtained from radiography and cervical spine MRI were compared between the uncompensated group (cervical lordosis <25) and the compensated group (cervical lordosis ≥25).
Results
In the uncompensated group, the average degeneration grade of each segment was 2.72 (±0.70) in C2-3, 3.00 (±0.76) in C3-4, 3.02 (±0.91) in C4-5, 3.37 (±0.95) in C5-6, and 2.95 (±0.98) in C6-7. The average degeneration grade of each segment in the compensated group was 2.38 (±0.78) in C2-3, 2.38 (±0.60) in C3-4, 2.62 (±0.60) in C4-5, 2.82 (±0.72) in C5-6, and 2.41 (±0.74) in C6-7. The degeneration grade was significantly higher in the uncompensated group than in the compensated group for all cervical segments. The risk of high-grade degeneration of C3-4 was significantly higher in the uncompensated group (odds ratio = 6.268; 95% CI, 2.232-17.601; p<.001).
REFERENCES
1. Knott PT, Mardjetko SM, Techy F. The use of the T1 sagittal angle in predicting overall sagittal balance of the spine. Spine J. 2010 Nov; 10(11):994–8. DOI: 10.1016/j.spinee.2010.08.031.

2. Yang BS, Lee SK, Song KS, et al. The Use of T1 Sagittal Angle in Predicting Cervical Disc Degeneration. Asian Spine J. 2015 Oct; 9(5):757–61. DOI: 10.4184/asj.2015.9.5.757.
3. Cote P, Cassidy JD, Yong-Hing K, et al. Apophysial joint degeneration, disc degeneration, and sagittal curve of the cervical spine. Can they be measured reliably on radiographs? Spine (Phila Pa 1976). 1997 Apr 15; 22(8):859–64. DOI: DOI:10.1097/00007632-199704150-00007.
4. Dai L. [Disc degeneration and cervical instability]. Zhonghua Wai Ke Za Zhi. 1999 Mar; 37(3):180–2.
5. DePalma AF, Rothman RH, Levitt RL, et al. The natural history of severe cervical disc degeneration. Acta Orthop Scand. 1972; 43(5):392–6. DOI: DOI:10.3109/17453677208998959.
6. Friedenberg ZB. Degeneration of the Cervical Disc. West J Surg Obstet Gynecol. 1964 Jul-Aug; 72:191–4.
7. Gruber HE, Phillips R, Ingram JA, et al. Spontaneous age-related cervical disc degeneration in the sand rat. Clin Orthop Relat Res. 2014 Jun; 472(6):1936–42. DOI: 10.1007/s11999-014-3497-x.
8. Kumaresan S, Yoganandan N, Pintar FA, et al. Contribution of disc degeneration to osteophyte formation in the cervical spine: a biomechanical investigation. J Orthop Res. 2001 Sep; 19(5):977–84. DOI: 10.1016/S0736-0266 (01)00010-9.
9. Miyazaki M, Hymanson HJ, Morishita Y, et al. Kinematic analysis of the relationship between sagittal alignment and disc degeneration in the cervical spine. Spine (Phila Pa 1976). 2008 Nov 1; 33(23):E870–6. DOI: 10.1097/BRS.0b013e3181839733.
10. Sambrook PN, MacGregor AJ, Spector TD. Genetic influences on cervical and lumbar disc degeneration: a magnetic resonance imaging study in twins. Arthritis Rheum. 1999 Feb; 42(2):366–72. DOI: 10.1002/1529-0131 (199902)42: 2< 366:: AID-ANR20> 3.0.CO; 2-6.
11. Miyazaki M, Hong SW, Yoon SH, et al. Reliability of a magnetic resonance imaging-based grading system for cervical intervertebral disc degeneration. J Spinal Disord Tech. 2008 Jun; 21(4):288–92. DOI: 10.1097/BSD.0b013e31813c0e59.
12. Boden SD, McCowin PR, Davis DO, et al. Abnormal magnetic-resonance scans of the cervical spine in asymptomatic subjects. A prospective investigation. J Bone Joint Surg Am. 1990 Sep; 72(8):1178–84. DOI: DOI:10.2106/00004623-199072080-00008.
13. Gomez Espindola JC, Perez Viquez AF. [Cervical lordosis evaluation in asymptomatic volunteers from Navy Medical Center]. Acta Ortop Mex. 2008 Jan-Feb; 22(1):7–11.
14. Wei W, Liao S, Shi S, et al. Straightened cervical lordosis causes stress concentration: a finite element model study. Australas Phys Eng Sci Med. 2013 Mar; 36(1):27–33. DOI: 10.1007/s13246-013-0182-4.
Fig 1.
Radiographic example of a 55-year-old female patient without cervical compensation. (A) Upright lateral X-ray. (B) T2-weighted sagittal image on cervical magnetic resonance imaging.
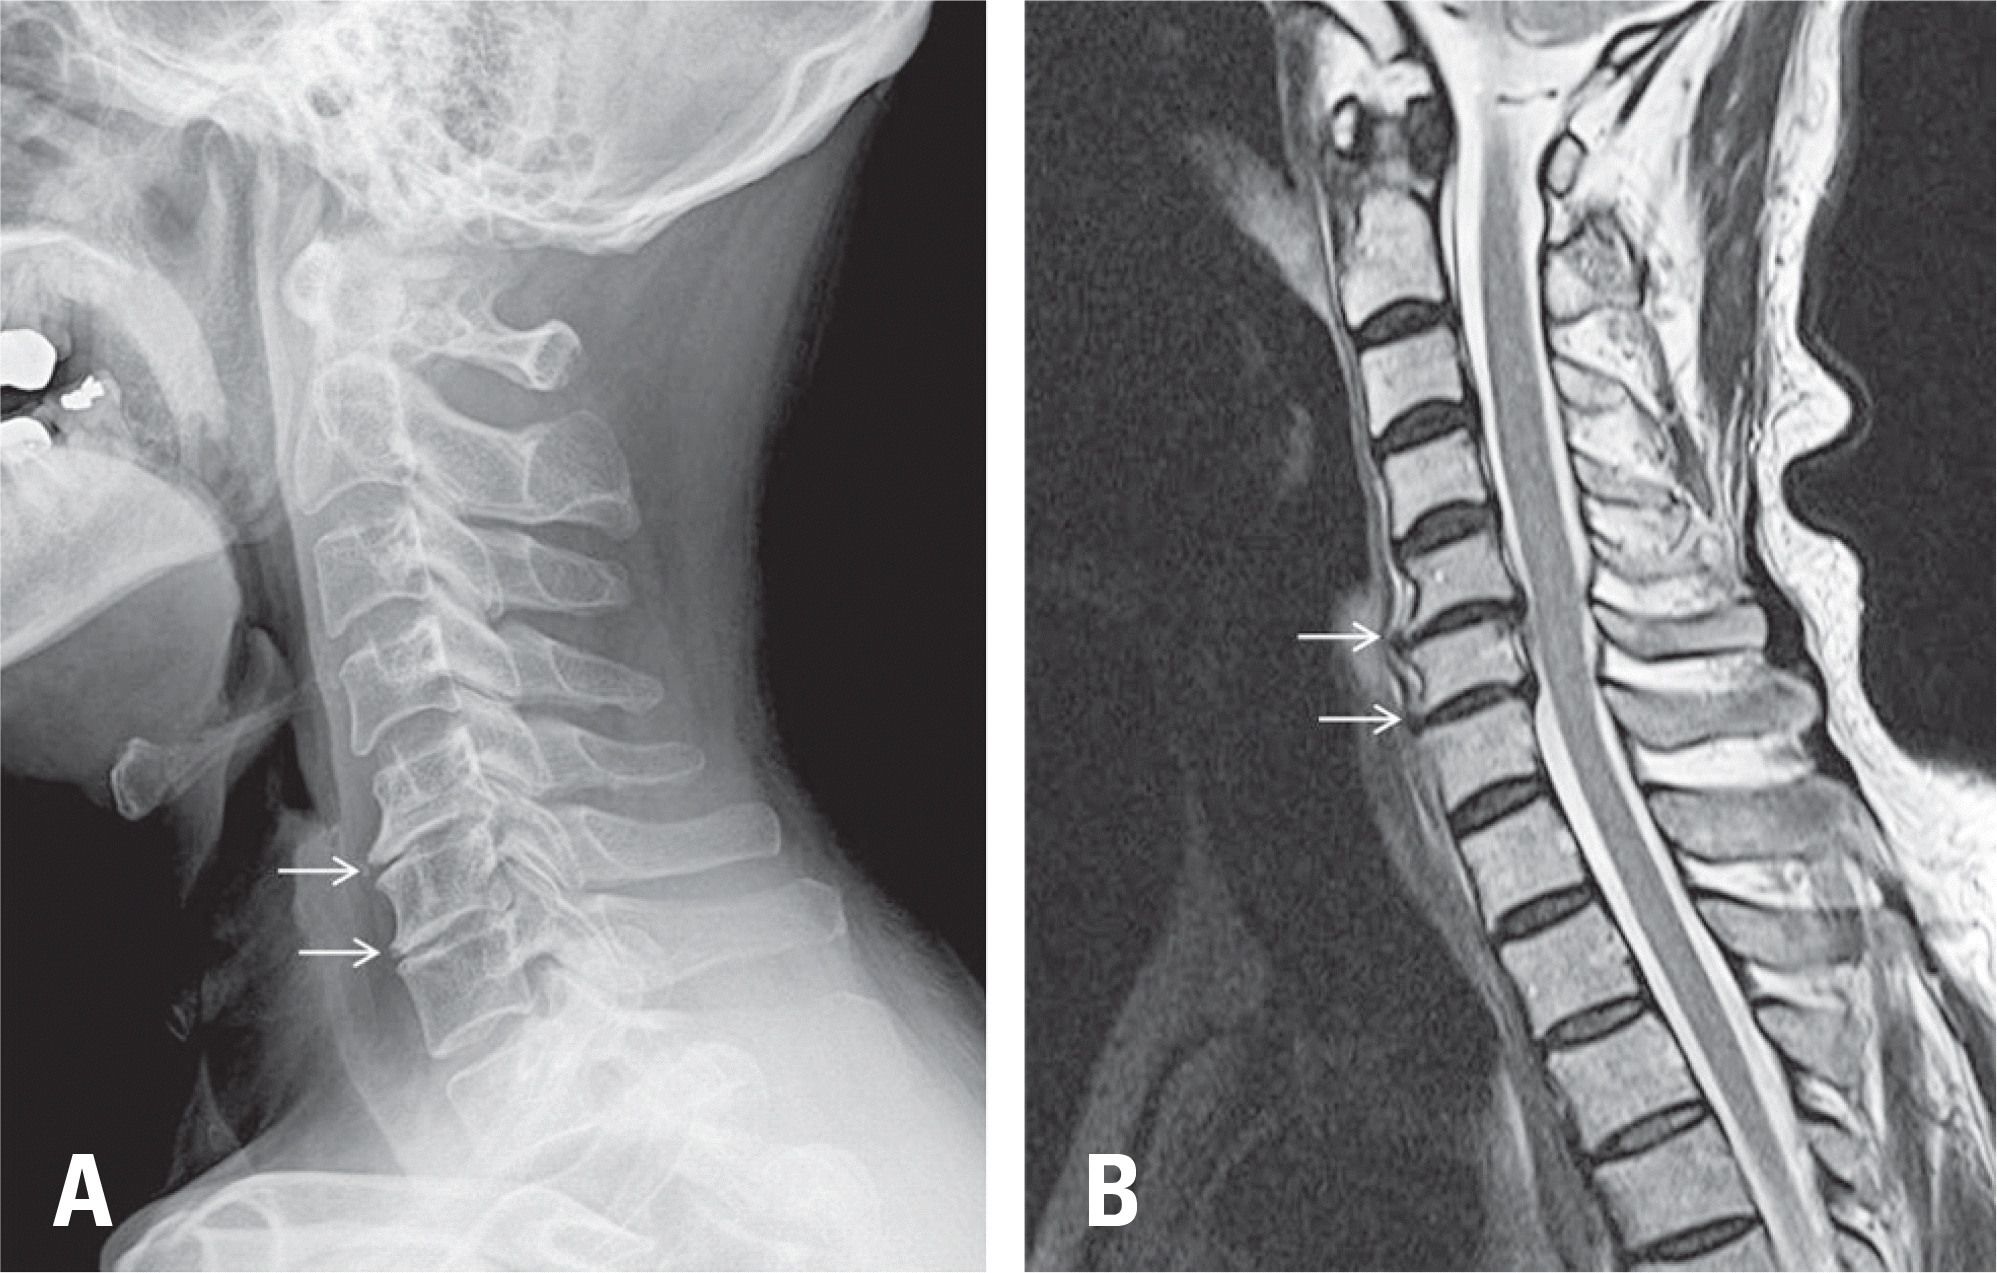
Fig 2.
Radiographic example of a 51-year-old female patient with cervical compensation. (A) Upright lateral X-ray. (B) T2-weighted sagittal image on cervical magnetic resonance imaging.
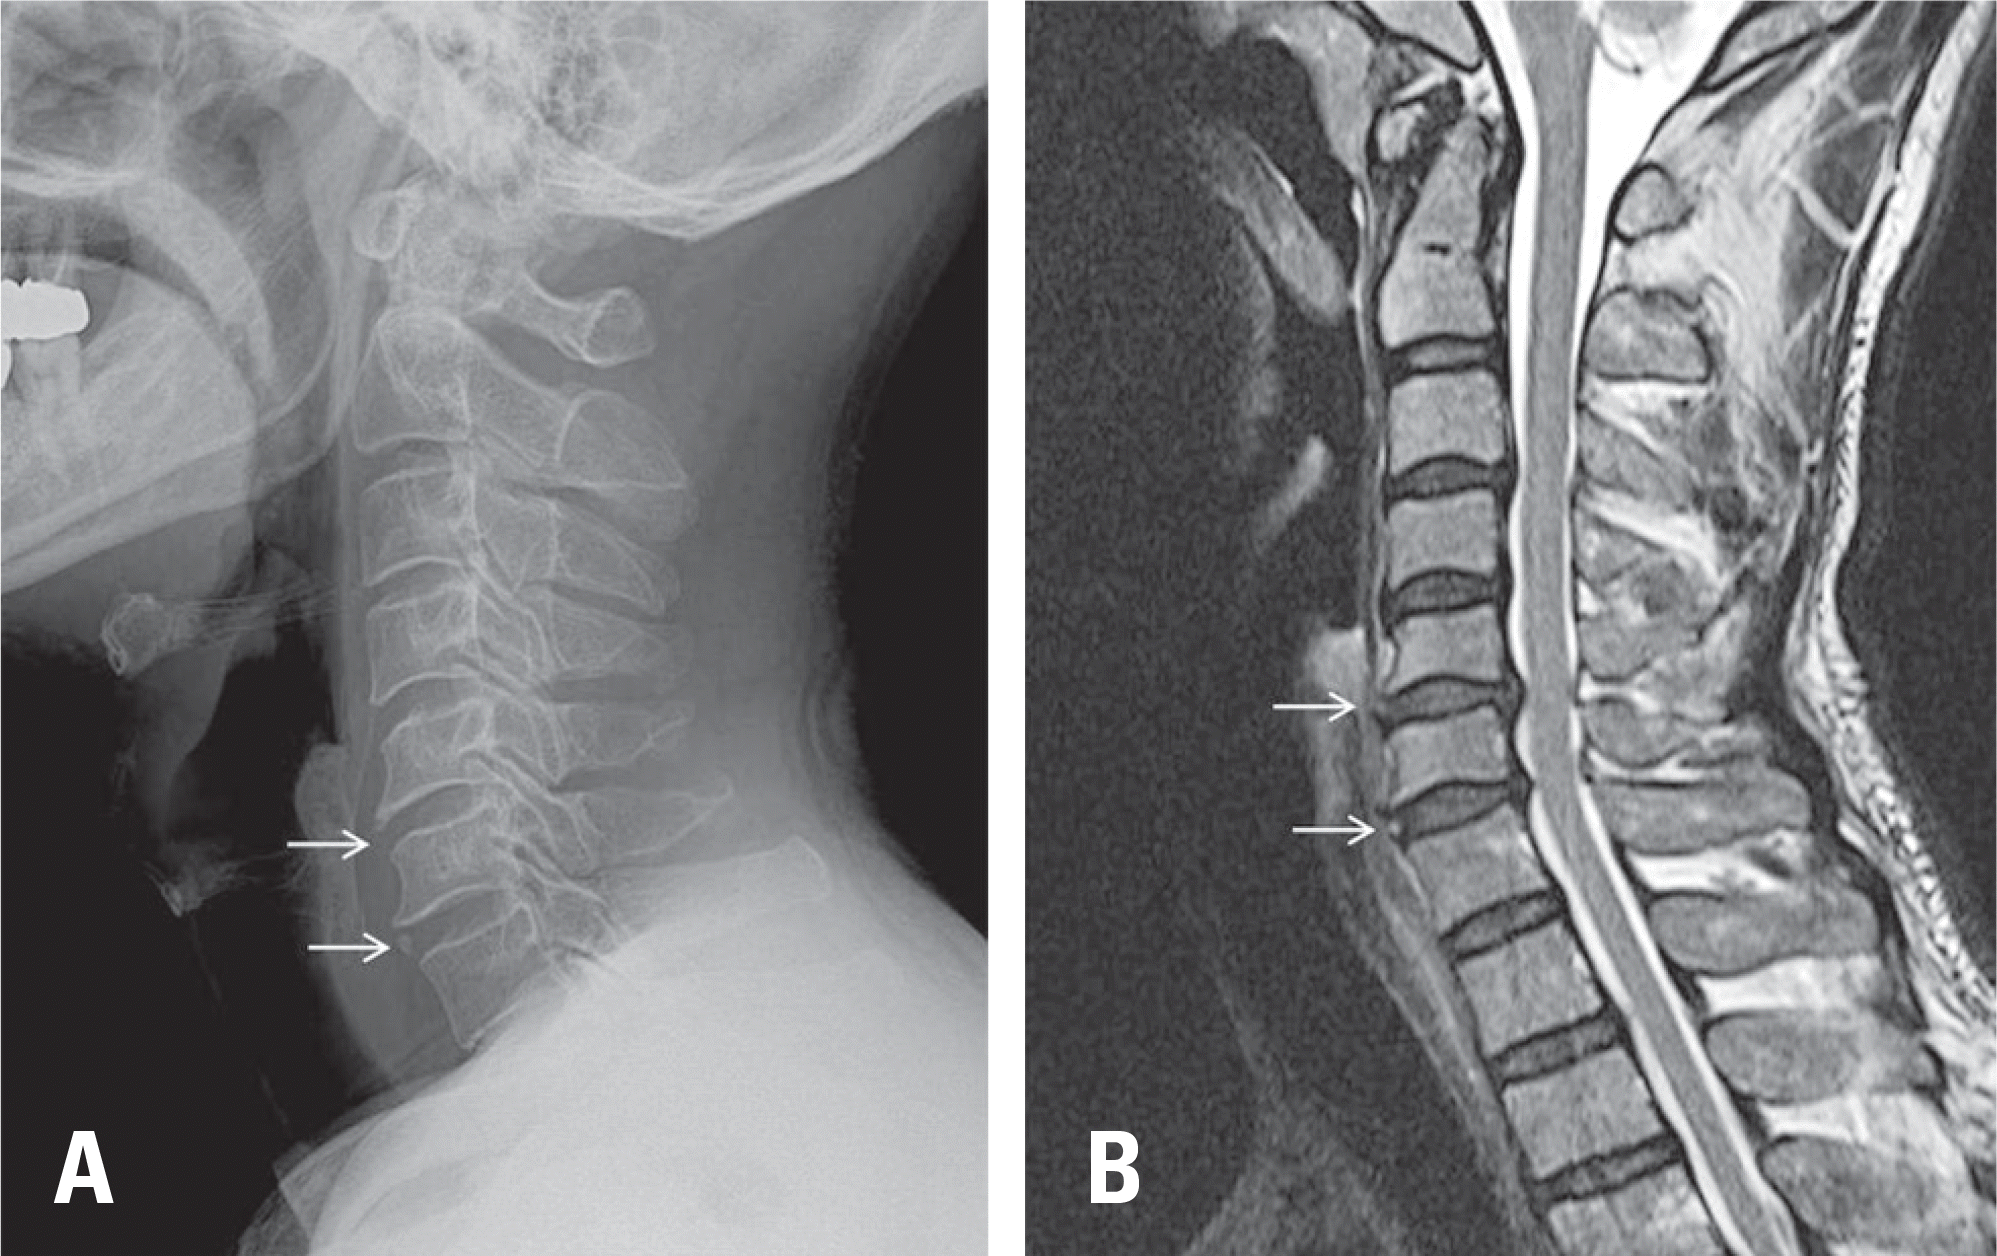
Table 1.
Comparison between compensated group and uncompensated group
Table 2.
Comparison of radiologic parameter on MRI between compen sated group and uncompensated group using t-test
Table 3.
Comparison of radiologic parameter between compensated group and uncompensated group using chi-square test
 XML Download