

 PDF
PDF ePub
ePub Citation
 Print
Print


INTRODUCTION
Asthma is a highly prevalent, chronic respiratory condition characterized by reversible airflow obstruction, airway hyper-responsiveness and airway inflammation producing frequent exacerbations. There are 300 million people worldwide affected by asthma.1 The public health burden of asthma has increased over the past 2 decades, and acute exacerbation of asthma is a particularly important and costly problem, because morbidity and mortality due to asthma are closely related to the frequency and severity of the exacerbations.2 Identification of causal factors is vital for prevention and management of exacerbations. In Western countries, viral infections are responsible for up to 80%-85% of exacerbations in childhood asthma.3456 In contrast, viral infections are involved in <50% of asthma exacerbations among adult asthmatics.789101112
Among various respiratory tract viruses, including rhinovirus (RV), influenza virus (IFV), adenovirus (ADV), human metapneumovirus (hMPV), parainfluenza virus (PIV), coronavirus, and respiratory syncytial virus (RSV),13 RV, and IFV trigger exacerbations in children with asthma most frequently.14 In Korea, the prevalence of respiratory viruses is reported to be similar to that in Western countries. Of the respiratory viruses that cause asthma exacerbations, up to 60%–70% are RV, while IFV and RSV are responsible for a substantial proportion of exacerbations in children with asthma.1516 However, there have been few reports on the prevalence of viruses related to asthma exacerbations in Korean adult asthmatics.
This prompted us to evaluate the prevalence of respiratory viruses in the sputum of asthmatics with lower respiratory tract illnesses (LRTIs) and to compare the frequencies and types of viruses detected in patients with exacerbations (exacerbated LRTIs) with those in subjects without exacerbations (stable LRTIs) to evaluate the contribution of respiratory viruses to asthma exacerbation.
MATERIALS AND METHODS
Study subjects
The study was prospectively carried out in a tertiary hospital in Korea from June 2009 to June 2014. Asthma was previously diagnosed based on the Global Initiative for Asthma guidelines (GINA report: global strategy for asthma management and prevention 2011 May 4. Available at: http://www.ginasthma.org/uploads/users/files/GINA_Report2011_May4.pdf). All subjects had a clinical diagnosis of asthma supported by at least one of the following criteria: 1) an increase in the forced expiratory volume in 1 second (FEV1) of >12% or 200 mL after inhalation of 400 µg albuterol, 2) a reduction in the FEV1 of 20% in response to a provocative concentration of <10 mg/mL inhaled methacholine (PC20), and 3) an increase in the FEV1 >20% over 14 days after inhaled or systemic corticosteroid use. The subjects underwent a standardized assessment, which included analyses of induced sputum specimens, complete blood cell count with differential counts, total immunoglobulin E (IgE) measurement, chest radiography, body mass index (BMI) measurement, and allergy skin-prick tests at the initial visit. Twenty-four common inhalant allergens, including dust mites (Dermatophagoides farina and Dermatophagoides pteronyssinus), cat fur, dog fur, cockroaches, grass pollens, tree pollens, ragweed pollens, and Aspergillus species (Bencard Co., Brentford, UK) were used in the skin-prick tests. This study was prospectively performed by including the patients of the Soonchunhyang asthma cohort (n=1,843), and their characteristics were summarized in our previous publication.17 Among them, we recruited those who complained the aggravation of the lower respiratory symptoms and were able to expectorate good quality sputum samples. Exclusion criteria were the presence of parenchymal lung diseases, such as pulmonary tuberculosis, bronchiectasis, lung cancer, idiopathic interstitial lung diseases, and abnormal lung infiltrations on chest radiography.
Sputum was obtained within 2 weeks from the time when respiratory tract infections were suspected if the common symptoms of upper respiratory tract illnesses (URTIs), such as cough, sore throat, runny nose, post-nasal drip, nasal congestion, and low-grade fever, or those of LRTIs, such as shortness of breath, weakness, fever, coughing, sputum production, and wheezing were present. An exacerbation was diagnosed when pre-existing dyspnea and wheezing became aggravated within 14 days before the study, together with a post-bronchodilator FEV1 <80% of the personal best.18 We divided them into exacerbated LRTI and stable LRTI. Informed written consent was obtained from all subjects and all procedures were approved by the Ethics Committee of Soonchunhyang University Bucheon Hospital (SCH-2017-01-009).
Sputum preparation
Sputum was induced using isotonic saline containing a short-acting bronchodilator, and the samples were processed within 2 hours of collection, as previously described.19 Briefly, all portions with visibly greater solidity were carefully selected and placed in pre-weighed Eppendorf tubes. The samples were diluted by adding 8 volumes of Dulbecco's phosphate-buffered saline. The total cell count was determined using a hemocytometer. Supernatants and cell fractions were separated by centrifugation (500×g for 5 minutes). Five hundred cells were differentially counted on slides produced by cytocentrifugation after staining with Diff-Quick (American Scientific Products, McGraw Park, IL, USA). Sputum samples that contained >10% squamous epithelial cells were not included.
Viral RNA extraction and multiplex reverse transcription-polymerase chain reaction (RT-PCR)
Viral RNA was extracted from 300 µL of the total sputum samples diluted in 8×Dulbecco's phosphate-buffered saline (DPBS) using the Viral Gene-spin™ Kit (iNtRON Biotechnology, Seoul, Korea) as recommended by the manufacturer. The isolated RNA was reverse-transcribed into cDNA following the protocol of the RevertAid First Strand cDNA Synthesis Kit (Thermo-Scientific, Waltham, MA, USA): 8 µL of purified RNA, 1 µL of 0.2 µg/µL random hexamer primer and 3 µL of diethylpyrocarbonate (DEPC)-treated water were mixed and heated at 80℃ for 3 minutes. To this mixture, 4 µL of 5×reaction buffer, 1 µL RiboLock RNase inhibitor (20 U/µL), 10 mM dNTP mix and 1 µL of RevertAid M-MuLVRT (200 U/µL) were added, followed by incubation at 37℃ for 90 minutes and 94℃ for 2 minutes. Respiratory viruses were identified using the Seeplex® RV 7 Detection Kit (Seegene, Seoul, Korea) according to the manufacturer's protocol, as follows: 3 µL of cDNA, 5×RV2 primer, 8-methoxypsoralen solution and 2×multiplex Master Mix were mixed and heated at 94℃ for 15 minutes. Forty amplification cycles were carried out in a thermal cycler (94℃ for 0.5 minutes, 60℃ for 1.5 minutes, and 72℃ for 1.5 minutes). Amplification was completed by a final extension step at 72℃ for 10 minutes. RT-PCR products were visualized by electrophoresis on an ethidium bromide-stained 2% agarose gel to identify ADV, hMPV, PIV 1/2/3, IFV A, IFV B, RSV A/B, and RV A.
Statistical analysis
The statistical analyses were performed using SPSS 13.0 (IBM, Armonk, NY, USA). Comparisons of clinical and physiological parameters between the exacerbation and stable groups were conducted using Pearson's χ2 test and an independent t test for discrete and continuous variables, respectively. Fisher's exact test was applied for comparisons of the detection frequencies between the exacerbation and stable groups. Data are expressed as means±standard error (SE) of the mean. Values of P<0.05 were deemed to indicate statistical significance.
RESULTS
Clinical characteristics of the subjects
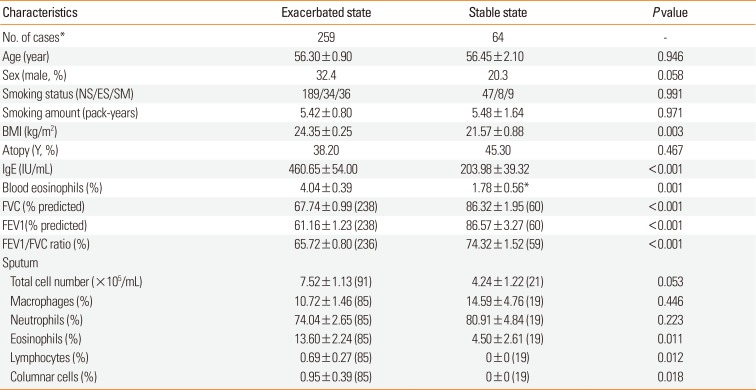
We obtained 353 sputum samples from 283 asthmatics with URTI or LRTI symptoms, including an increased amount of sputum without asthma exacerbation (stable state) or with asthma exacerbation (exacerbated state). Among them, 30 sputum samples were discarded because of inadequate quality. This, PCR detection of respiratory viruses was performed in 323 samples from 259 asthmatics (259 samples from subjects in an exacerbated state and 64 from those in a stable state). The clinical profiles of subjects in both states are presented in Table 1. The exacerbated cases had significantly lower FEV1, forced vital capacity (FVC), and FEV1/FVC values compared with those in a stable state (P<0.001). The total IgE level and eosinophil percentage in the peripheral blood and sputum were significantly higher in the exacerbated cases than in the stable cases (P=0.010–0.001).
Respiratory viruses detected
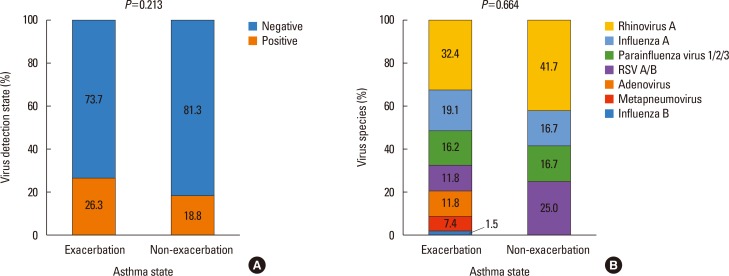
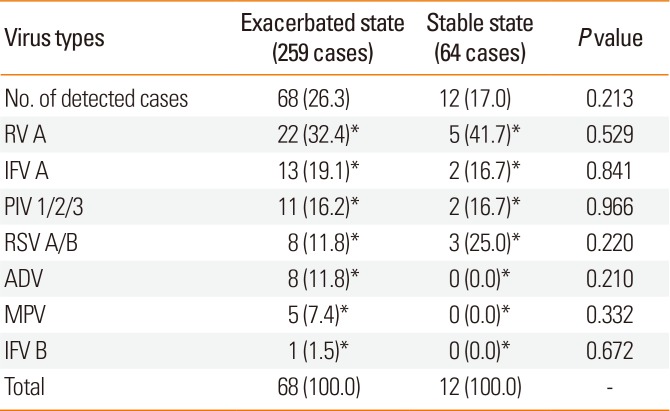
Respiratory viruses were detected in 68 (26.3%) of the 259 exacerbated-state sputum samples and in 12 of the 64 stable-state samples (17.0%; P=0.213; Fig. 1A). RV was the most frequently detected virus in both the exacerbated and stable cases (32.4% vs 41.7%; P=0.529; Table 2). In the exacerbated cases, IFV A/B was the second most frequently detected virus (20.6%), followed by PIV 1/2/3 (16.2%), RSV A/B (11.8%), ADV (11.8%), and hMPV (11.8%). In the stable cases, RSV A/B (25.0%) was the second most frequently detected, followed by PIV 1/2/3 (16.7%) and IFV A/B (16.7%) (Table 2 and Fig. 1B). There was no difference in the virus distribution between the exacerbated and stable groups (P=0.664; Fig. 1B).
Virus detection during follow-up
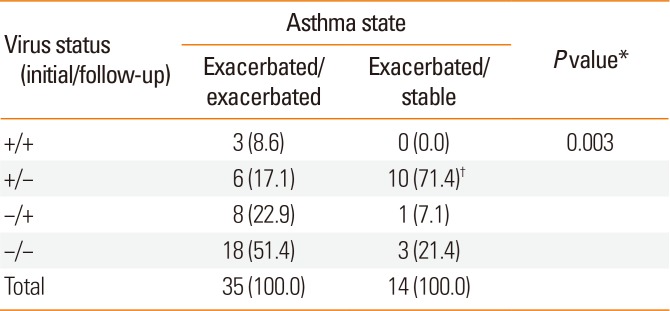
Of the subjects, 210 (44 stable and 166 exacerbated cases) underwent one sputum examination, and the remaining 49 underwent 2 to 4 sputum examinations. Seventy samples were obtained from 35 subjects during 2 exacerbations (exacerbated/exacerbated). A further 28 samples were obtained from 14 subjects with exacerbations and a stable LRTI state (exacerbated/stable) (Table 3). Virus was detected at both examinations in 3 of the exacerbated/exacerbated cases (+/+, 8.6%), at one examination in 6 cases (+/−, 17.1%) and 8 cases (−/+, 22.9%), and at neither examination in 18 cases (−/−, 51.4%). Among the exacerbated/stable cases, virus was detected at one examination in 11 cases (78.6%): 10 cases at the first examination (+/−, 71.4%) and 1 case at the second examination (−/+, 7.1%); it was not detected in 3 cases (−/−, 21.4%). There was a significant difference in the virus-positive and -negative rates between the 2 groups (P=2.00×10⁻⁴). Interestingly, among the 14 exacerbated/stable cases, 10 (71.4%) had virus-positive initial sputum samples (exacerbated state) but virus-negative second sputum samples (stable state). Accordingly, the exacerbated/stable group had a significantly higher frequency of an initial positive sample and a follow-up negative sample than did the exacerbated/exacerbated group (17.1%; P=0.003; Table 3).
Seasonal variation in virus detection
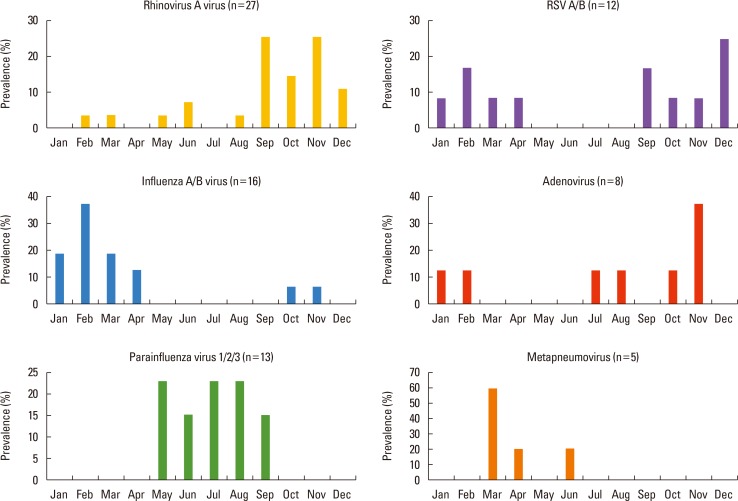
A seasonal pattern was noted in the rates of detection of respiratory virus. RV was prevalent in September to December, IFV in January to April, PIV in May to September, and RSV A/B in September to April (Fig. 2).
DISCUSSION
In the present study, of the viruses evaluated, RV was most frequently related to exacerbations of asthma in Korean adult asthmatics. RV was responsible for one-third (32.4%) of the viral infections in exacerbated cases. This frequency is in good agreement with previous reports on Caucasians. RV URTI and LRTI were frequently associated with asthma exacerbations in child and adult Caucasian asthmatics.14 Nicholson et al.8 reported that 33% of 229 acute exacerbation cases were RV-positive by RT-PCR. A longitudinal study of adult patients reported an RV detection rate of 20% in 30 asthmatics.7 In a study of 42 adult asthmatics hospitalized due to respiratory viral infection, RV was detected in 30% of the subjects by RT-PCR.10 Thus, RV constitutes ~30% of the respiratory viruses related to asthma exacerbations in both Korean and Caucasian adult asthmatics. The prevalence of respiratory viruses differs markedly according to age and geography.13 The frequency of RV detection is significantly lower in adult asthmatics than in child asthmatics. Indeed, viruses were detected in ~80% of child asthmatics with acute exacerbations; RV caused 70%–90% of these episodes.6
Interestingly, the frequency of RV detection was higher in non-exacerbated stable LRTI cases than in exacerbated LRTI cases in our study (45.5% vs 32.4%), although the difference was not significant. Thus, because RV was detected in almost half of the stable LRTI cases, the relationship between RV infection and asthma exacerbations seems to be inconsistent: detection of RV in sputum does not always induce an asthma exacerbation. Other studies of adult asthmatics have reported similar results. In an 11 month longitudinal study of 31 atopic asthmatics aged 15–56 years, 30 viruses were detected, 18 (60%) of which were associated with asthma exacerbations.7 In these populations, RV was detected in 14/30 (46.6%) asthmatics and 3/9 (33.3%) non-asthmatics. A longitudinal study of adult asthmatics reported that one-third of symptomatic respiratory tract viral infections were not associated with worsening of asthma symptoms.10 In a recent longitudinal cohort study of couples (1 with asthma and 1 without) that evaluated the presence of RV in nasal secretions at 2-week intervals over a 3-month period, the incidence of RV infection was similar in those with asthma and those without (10.1% vs 8.5%).9 In a study of children, the rate of RV isolation was almost identical in those with wheezy bronchitis (28.6%) and those with upper respiratory illness (29.5%).20 These studies and our data suggest that RV is related to both acute exacerbations of asthma and stable LRTI without asthma exacerbations.
Although the prevalence of virus infections is similar in asthmatic children with vs without exacerbations, respiratory symptoms are more severe in the presence of viral infections, in that cold and asthma symptoms are more than 2-fold longer in duration and loss of control is more frequent in virus-positive compared with virus-negative respiratory tract illness in children (47% vs 22%).5 Adults with asthma are not at increased risk of RV infection, but those infected with RV have more severe and longer-lasting LRTI symptoms and greater decreases in peak expiratory flow rate than do healthy individuals.9
In the present study, IFV A was the second most frequently detected virus. Thus, RV and IFV constituted 51.5% of the viral infections in subjects with exacerbated asthma. A similar frequency has been reported in adult asthmatics.21 However, RV and IFV infections are more prevalent among subjects with asthma exacerbations compared with those without exacerbations in Korean children.22
In the present study, respiratory viruses were detected in the sputum of subjects with exacerbated (26.3%) and stable (17.2%) asthma. This detection rate is lower than that initially expected. In a 1979 study of children, the detection rate was 26.4%.20 In that study, virus isolation was performed by cell culture.20 In contrast, respiratory viruses can now be identified by virus culture, serology, immunofluorescence antigen detection, and PCR-based tests.13 Since the development of PCR assays in the 1990s, their sensitivity has improved markedly. Thus, our detection rate is relatively low, likely due to inadequate sputum samples. Virus detection is usually performed in the upper airway because collection of sputum from young children and some adult asthmatics is not feasible. In our study, viruses were detected in sputum samples, not in nasopharyngeal washings or swabs. Use of this method may have resulted in the low frequency of RV detection in our study, because RV usually infects the upper respiratory tract.9 However, in our comparison study of sputum and nasal swabs in asthmatics with LRTIs,23 the concordance rate of virus detection was 95.2%, and the detection rate was higher in sputum than in nasal swabs. Thus, use of sputum did not seem to be a cause of the low frequency of RV detection in our study. The second reason is the delayed sampling of sputum in our study. An exacerbation was defined as aggravation of pre-existing symptoms of dyspnea and wheezing within 14 days before the study and a post-bronchodilator FEV1 <80% of the predicted value or the personal best.18 RV has an incubation period of 2 days and is shed for 7 days after development of symptoms.2425 FEV1 decreases significantly after infection, reaching a minimum at 2 days after experimental RV inoculation.26 Because our study was a cross-sectional design, we did not analyze the lag time between the appearance of LRTI symptoms and sputum virus analysis. Therefore, a lag time of >7 days in some patients may have resulted in the low detection rate.
A subset of asthmatics is particularly susceptible to recurrent exacerbations.2 In our study, the initial sputum samples (exacerbation) were positive for virus, while the second sputum samples (stable state) were negative in 10 of 14 cases (71.4%). This frequency was higher than that in the exacerbated/exacerbated group (17.1%; P=2.50×10⁻⁴). These data indicate that a subset of patients is susceptible to asthma exacerbation in the presence of viral LRTI. In addition to viruses, asthma exacerbation can be caused by other agents, including allergens (dust mites, pollen, and animal dander),27 occupational exposure (grains, flours, cleaning agents, metals, irritants, and woods), hormones (menstrual asthma), drugs (acetylsalicylic acid [ASA], nonsteroidal anti-inflammatory drugs [NSAIDs], and beta-blockers), exercise, stress, smoking exposure,28 and air pollutants.2930 The factors that trigger exacerbations differ among individuals. Thus, exacerbation of asthma may be a result of the complex interplay among respiratory viruses, host airway susceptibility factors, and environmental modifiers. A case-control study of 60 adult patients compared those hospitalized with acute asthma with 2 control groups: patients with stable asthma and patients hospitalized for non-asthma conditions.2 Compared with the controls, a significantly higher proportion of acute asthmatics were both sensitized and exposed to allergens, including dust mites, cat, and dog allergens. Intriguingly, the combination of high exposure to 1 or more allergens and virus detection significantly increased the risk of hospitalization for asthma compared with controls with stable asthma.27 These results indicate synergism among allergen sensitization, exposure to a high level of a sensitizing allergen, and viral infection in inducing asthma deterioration.3132 In our study, the frequency of virus detection was not different between atopics and non-atopics (data not shown). Although all of these factors are expected to predispose asthmatics to viral infections,33 determining whether the exacerbation is due to viral infection or other causes is not feasible at present.
The predominant respiratory virus depends on the season.34 In our study, the number of cases was highest in late fall and early winter. However, the virus detection rate was ~45% in February and March and <20% in May, July, and August. These data indicate that symptoms of LRTI with asthma exacerbation in early spring may be due mainly to viral infections, and that those in late spring to summer may be due mainly to other environmental factors. In addition, virus prevalence varied markedly: RV was predominant during fall and early winter, while IFV A was predominant during winter. IFV A is the predominant respiratory virus in winter in Korea.35 RSV was predominant during fall, winter and early spring, and PIV was predominant during late spring and early fall. The seasonal variation reported in the present study is in agreement with that previously reported.34
In summary, the presence of respiratory viruses was analyzed in 323 sputum samples from asthmatics with manifestations of LRTI to evaluate their contribution to asthma exacerbations. Virus was detected in approximately one-fifth of the subjects with exacerbated and stable disease. In both states, RV was the most frequently detected virus, followed by IFV A, which is comparable with those of Caucasian studies. Forty-nine patients underwent an examination for viruses during 2 episodes of exacerbation and at the time of each exacerbated and stable episode. The virus detection rate at the second examination was significantly higher in cases with 2 exacerbation episodes than in those with sequential exacerbation and stable episodes, suggesting a presence of susceptible asthmatics to exacerbation in case of LTRI. Seasonal variations in detection rates and types of virus show the similar patterns to those of Caucasian asthmatics.
 XML Download