

 PDF
PDF ePub
ePub Citation
 Print
Print


INTRODUCTION
The prevalence of allergic disease has increased during the past decade in Korea. There is an increasing tendency for children to be exposed to traffic-related air pollutants (TAP), which contributes to potential risk factors for allergic disease.
Exposure to TAP is a major contributor to chronic respiratory and allergic diseases. Recent studies have examined the effects of exposure to road vehicle traffic on respiratory disease,1,2,3,4 lung function,2,3,4,5,6,7,8,9,10 and allergic rhinitis (AR).11,12 There have also been studies demonstrating the effects of exposure to TAP on children's asthma or related symptoms1,2,12,13,14,15,16,17,18 and allergic sensitization13,19; most studies found positive associations, although not all were significant.
Both epidemiologic and experimental studies have proposed that exposure to TAP (i.e., diesel exhaust from heavy traffic) can increase the risks of airway or epidermal inflammation and allergic sensitization, but the role of the exposure in the etiology of asthma or allergic diseases is not completely understood. Few studies have investigated the effects of exposure to TAP on allergic disease in children and objectively assessed the exposure to TAP in South Korea.
This study evaluated the relationship of living near main roads to allergic disease, airway hyperresponsiveness (AHR), allergic sensitization, and lung function in Korean children.
MATERIALS AND METHODS
A total of 5,443 children aged 6-14 years from 33 elementary schools in 10 cities in 2005-2006 were included in a baseline survey of the Children's Health and Environmental Research (CHEER) study. The participants' parents were asked to respond to questionnaires. Their children underwent physical examinations and clinical tests. The test results were collected by trained field technicians who visited the schools. With exclusion of children with missing information on address (n=1,182), 4,261 children were included for the final analysis. Measurements of pulmonary functions or AHR and allergic sensitization were made on 1,855 and 1,254 children, respectively.
The study protocol was approved by the Institutional Review Boards of the Dankook University College of Medicine and Ulsan University College of Medicine. Written consents were obtained from all participants' parents after they were fully informed of the survey protocol.
Questionnaire
The diagnosis of allergic disease was made on the basis of the questionnaire survey. We used ISAAC questionnaire that has been a standardized method to evaluate allergic disease in epidemiologic studies worldwide. Korean ISAAC questionnaire has already been validated.20 The prevalence of allergic disease was identified through a comprehensive history taking: (1) diagnosis of allergic disease-Has your child ever been diagnosed with asthma (or allergic rhinitis) by a physician?; (2) lifetime symptoms of asthma-Has your child ever had wheezing or whistling in the chest?; (3) 12-month symptoms of asthma-Has your child had wheezing or whistling in the chest during the last 12 months?; (4) lifetime symptoms of allergic rhinitis-Has your child ever had a problem with sneezing, a runny, or a blocked nose when he/she DID NOT have a cold or the flu?; and (5) 12-month symptoms of allergic rhinitis-During the past 12 months, has your child had a problem with sneezing, a runny nose, or a blocked nose when he/she DID NOT have a cold or the flu? Age, gender, parental history of allergy, maternal educational level, household income, study region (metropolitans, industrial areas, and rural areas), preterm birth, maternal smoking during pregnancy, environmental tobacco smoke (ETS) exposure at home, keeping of pets, and bronchiolitis before age 2 were considered confounding factors.
Pulmonary function and methacholine challenge tests
Baseline spirometry was performed on each subject according to the American Thoracic Society guidelines21 using a portable microspirometer (Microspiro HI-298, Tokyo, Japan). We measured forced vital capacity (FVC), forced expiratory volume in 1 second (FEV1), and mean forced expiratory flow during the middle half of the FVC (FEF25-75).
Methacholine challenge tests were carried out using a modification of the method originally described by Chai et al.22 Each subject inhaled 5 inspiratory capacity breaths of buffered saline solution and increasing concentrations of methacholine (0.625, 1.25, 2.5, 5, 12.5, and 25 mg/mL) at 5-minute intervals. The procedure was terminated when FEV1 was decreased by >20% of saline solution. The response to methacholine challenge was expressed as PC20 (i.e., the concentration that caused a fall in FEV1 of 20% from baseline).
Skin prick tests
Skin prick tests were performed for 16 common Korean inhalants and food allergens, together with negative and positive controls (Allergopharma, Reinbek, Germany). The allergens included house dust mites (Dermatophagoides pteronyssinus and D. farinae), cat, dog, cockroach, molds (Alternaria alternata and Aspergillus fumigates), grass, tree mix (I), tree mix (II), mugwort, ragweed, egg, milk, peanut, and soybean. A mean wheal diameter of at least 3 mm greater than the negative control was taken as positive. Allergic sensitization was defined as the presence of 1 or more positive reactions in the skin prick test.
Assessment of traffic-related air pollution exposure: the distance to the main road and road length
To assign an exposure estimate of each subject, the residential address of each participant was geocoded and subsequently mapped using geographic information system (GIS) computer software ArcGIS 9.3 (ESRI, 2009).
The distance to the nearest main road was calculated. The hypotheses were that a major road is the greatest contributor to TAP traffic-related air pollution exposure and that the degree of exposure is proportional to proximity to this source. The total road length of the main road and the proportion of the main road area within the 200-m home area were also considered.
Statistical analysis
We categorized the distance of residence from the nearest main road into 4 categories as <75, 75 to 150, 150 to 225, or >225 m in increments of 75 m. Moreover, the distribution of the length and proportion of main roads within the 200-m home area was skewed. We assigned "0 m" to the first category and stratified the others by tertiles. The length of main roads within the 200-m home area (0, 1 to 165, 165 to 254, and >254 m), and the proportion of the main road area within the 200-m home area (0, 0.1 to 1.94, 1.94 to 3.58, and >3.58%) were also classified into 4 categories. The association between TAP and allergic disease was analyzed using 'binreg', which was performed to estimate the prevalence ratios (PRs) and 95% confidence intervals (CIs) of allergic disorders relative to the distance of homes from the nearest main road, the length of main roads, and the proportion of the main road area. Multiple logistic regression analysis was employed to control for confounding effects of selected factors. Confounding variables considered were parental history of asthma, atopic eczema, or allergic rhinitis, the maternal educational level, preterm birth, bronchiolitis before age 2, ETS at home, maternal smoking during pregnancy, indoor domestic pets, and study region. The trend of association was assessed by assigning consecutive integers (0-3) to the levels of independent variables. For lung function parameters, results are presented as regression coefficients (beta) and 95% CIs representing changes in each exposure category compared to the first one by multiple linear regression models. Two-sided P values <0.05 were considered significant. All statistical analyses were performed with STATA version 10.0 IC.
RESULTS
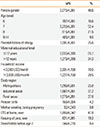
The characteristics of the study population are summarized in Table 1. Of the 4,261 children, 23.8% and 12.4% were positive for the lifetime and 12-month prevalences of wheezing based on the ISAAC criteria, respectively, and the lifetime prevalences of asthma diagnosis and 12-month asthma treatment were 11.1% and 4.4%, respectively. The lifetime and 12-month prevalences of AR were 46.6% and 41.6%, respectively; the lifetime prevalences of AR diagnosis and 12-month AR treatment were 25.8% and 20.6%, respectively. The prevalences of AHR (PC20 ≤8) and allergic sensitization were 21.0% and 33.5%, respectively (Table 2).
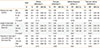
Positive exposure-response relationships were found between the length of main roads within the 200-m home area and lifetime wheeze (adjusted PR for comparison of the longest (>254 m) to the shortest (0 m) length categories=1.24; 95% CIs: 1.04-1.47; P for trend=0.022) and diagnosed asthma (PR=1.42; 95% CIs: 1.08-1.86; P for trend=0.011). The proportion of the main road area within the 200-m home area was associated with a significant increase in the prevalence of diagnosed asthma (P for trend=0.021) (Table 3).
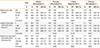
Inverse associations were found between the distance to the nearest main road and AR (P for trend=0.042 for lifetime AR symptoms, P for trend=0.033 for diagnosed AR). The highest adjusted PR for children living less than 75 m from main roads was found for lifetime AR symptoms (PR, 1.12; 95% CIs: 1.02-1.22), past-year AR symptoms (PR, 1.12; 95% CIs: 1.01-1.23), diagnosed AR (PR=1.17; 95% CIs: 1.01-1.35), and treated AR (PR=1.20; 95% CIs: 1.01-1.42). The proportion of the main road area within the 200-m home area was associated with a significant increase in the prevalence of diagnosed AR (P for trend =0.032) (Table 4).
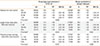
For AHR, the highest adjusted PR for 75-150 m distance from main road categories was significant (PR=1.30, 95% CIs: 1.02-1.65), but no dose-response relationship was found (P for trend=0.099). However, the distance to the main road, the length of the main road, and the proportion of the main road area were associated with allergic sensitization and had a exposure-response relationship with allergic sensitization (P for trend=0.001 for the distance to the main road; P for trend=0.041 for the length of the main road; P for trend=0.006 for the proportion of the main road area) (Table 5).
A strong inverse association was observed between proximity to the main road and lung function in linear regression models adjusted for age, gender, height, and weight (P for trend=0.004 for FEV1; P for trend=0.013 for FEV1/FVC; P for trend=0.018 for FEF25-75). The length of the main road or the proportion of the main road area was associated with reduced expiratory flow (FEV1) in schoolchildren (Table 6).
DISCUSSION
We found that the distance to main roads and the length of main road are associated with the prevalence of allergic disease in Korean schoolchildren. The current cross-sectional study found that a shorter distance from the residence to the nearest main road, especially within a 75-m home area, was significantly related to an increased prevalence of symptoms of AR, physician-diagnosed AR, allergic sensitization, and reduced pulmonary function. Furthermore, the length of main roads or the proportion of the main road area within the 200-m home area were associated with significant increases in the prevalences of lifetime wheezing, diagnosed asthma, past-year AR symptoms, diagnosed AR, and allergic sensitization as well as with reduced pulmonary function in schoolchildren.
To the best of our knowledge, this is the first study on children's respiratory health within a community that includes 3 different indicators for assessing long-term TAP exposure-the distance to busy roads, the length of main roads and main road density in the home area by a GIS.
In addition, 3 different indicators were applied to assess allergic disease using both subjective questionnaire data and objective measurements of atopy, AHR, and lung function. Overall, these results are in agreement with those of other investigations documenting significant associations between the distance to main roads and respiratory/allergic symptoms. For example, in German cohorts at 2 years of age, living <50 m from a roadway was associated with "asthmatic/obstructive bronchitis."12 When data at ages 4 and 6 years were included, the distance to road-ways continued to be associated with asthmatic bronchitis, AR, and allergic sensitization.13 In a Japanese cohort, children aged 6 to 9 years were recruited from 10 schools across 8 communities. Six of the 10 schools were located in zones with heavy traffic and the others were in rural areas without. Urban school-children living close to a main road (<50 m of trunk roads) had an increased prevalence of asthma in comparison to rural school children.14 Two Dutch studies reported not statistically significant associations between the prevalence of asthma and distance metrics (i.e., the distance to the school <100 m) among 2,053 Dutch children sampled from 24 schools located within 400 m of a motorway15 and those living within 100 m of a freeway among 1,068 children sampled from 13 schools in southern Holland.1 A significant association was found between the prevalence of asthma and living within 75 m of a major road in the Southern California Children's Health Study.16 U.S. children aged 8-10 years showed the highest between association asthma and distance metrics (i.e., living within 75 m of a freeway or a highway).18
There was a positive association between living alongside busy roads and allergic sensitization, which is in agreement with those of 2 previous studies.13,19 In German cohorts, living less than 50 m from the nearest main road was associated with an increased risk of sensitization to outdoor allergens (pollen or mold), and the distance to a main road had a dose-response relationship with sensitization to outdoor allergens.13 In a Swedish birth cohort (BAMSE), sensitization to pollen was significantly associated with traffic-PM10 and traffic-NOx. Another paper reported that sensitization was modified by polymorphisms in genes encoding glutathione S-transferase P1 (GSTP1) and tumor necrosis factor (TNF).19 In contrast, long-term exposure to outdoor air pollutants has no association with sensitization in 10-year-old schoolchildren in Norway.23 TAP may induce the release of allergenic granules from grass pollen24 and affect the morphology and possibly the allergenicity of pollen grains.25
The results of this study suggest that TAP exposure is associated with reduced lung function in schoolchildren. These results therefore support recent cohort data in Europe and the USA. It has been shown that there are significantly negative associations between traffic density in school districts and measures of expiratory flow (PEF and MEF25),3 between home outdoor benzene and having FEF25-75 <70% predicted,5 and between various lung-function indicators and traffic density and the distance from homes and schools to roads (within 300 m).6,7 Furthermore, road density within the 200-m home area is significantly associated with FEV1 among children with asthma.8 PEF, FEF25, and FEF50 are negatively associated with both early-life and lifetime exposure (i.e., spatially resolved dispersion models for NO2 and PM109). FEV1 and FEF25-75 are significantly associated with living within 500 m of a freeway compared to those living at least 1,500 m from a freeway.10 These results, along with ours, suggest that residential proximity to traffic is a risk factor for reductions in lung volume and lung development.
However, we did not find significant associations between TAP and AHR. There are still conflicting results regarding the effects of air pollution on AHR. This study population was children aged 6-14 years, and only cross-sectional associations were analyzed. Therefore, this study may have not considered vulnerable periods to AHR. Further prospective studies are warranted.
The major mechanism underlying harmful effects induced by air pollutants is oxidative stress. Oxidative stress has been suggested to be the major underlying mechanism behind many of toxic reactions induced by air pollutants. Reactive oxygen species (ROS) and free radicals are generated in response to TAP and can overwhelm the redox system and damage cell wall lipid, protein, and DNA, thereby leading to airway inflammation and airway hyperreactivity.26
There is increasing evidence mainly from animal and human in vivo and in vitro studies indicating that diesel exhaust particles induce allergic reactions and have immunologic effects on the development of allergic sensitization.27 Combined exposure to allergen and diesel exhaust particles may change the immune response towards IgE,28 and exposure to diesel exhaust particles could induce epigenetic changes (i.e., changes in the methylation process affect differentiation of T helper cells) and thereby possibly the risk of asthma and allergic sensitization.29
Although biological mechanisms by which TAP reduces lung function in children are not fully understood, chronic airway inflammation could decrease lung function measures like those reported in our study. However, it is difficult to discuss pathogenetic mechanisms in the context of a cross-sectional study.
This study has some strengths. First, this study was based on a large sample with a high response rate (86.7%), and thus had less selection bias affecting results. Second, information pertaining to asthma symptoms and allergic disease included items derived from the International Study of Asthma and Allergies in Childhood (ISAAC). Third, we used 3 different objective estimates of traffic-related exposures compared to previous investigations, including proximity to main roads, the length of main roads, and road density using the GIS software. Because concentrations of TAP, such as particulate matter and nitrogen dioxide (NO2), have been shown to be highest at the roadside and to fall exponentially at background levels within approximately 150 m, subjects living very close to a main road are likely to be exposed not only to a higher amount of traffic-derived particles and gases but also to more toxic emitted aerosols.30 Our exposure metrics focus on motor vehicles themselves and incorporate a mixture of associated putative hazards (i.e., road particulate matters, non-combusted fuel vapors, and a mixture of emission toxicants). Finally, lung function, AHR, and sensitization were assessed by objective measurements, so misclassification is a minor problem.
This study has some limitations. First, this is a cross-sectional study. Parents were asked to report their children's lifetime and past-year prevalence of symptoms of asthma. Thus, recall bias and nondifferential misclassification of disease may be of concern, which may result in reverse causality induced by avoidance of their children's disease. Second, we enrolled children aged ≥6 years, so it was hard to determine the effect of air pollution on early life, a critical time to develop allergic disease. Third, this study did not assess the relationship between the distance to the roads and the pollutants, a crude indicator of exposure as a proxy for a mixture of pollutants arising from exhaust emissions. Exposure to TAP was influenced by the type of building, the type of traffic on the road, the presence of physical obstructions between the road and the home, the amount of time spent at home and exposure elsewhere, and indoor air pollution that could also be responsible for asthma and allergic disease. The absence of such information may have led to a small random misclassification, while it seems unlikely to be an explanation of the observed positive associations. Furthermore, it is difficult to obtain measurements of traffic counts or traffic density in most cities in developing countries. This study suggests that road density may be a reasonable alternative to traffic density. With the exact address of individual location, however, we assessed individual-based exposure models to the addresses at the baseline survey; thus, we could not incorporate the residential history of the study participants precisely. Our investigation did not allow us to definitely distinguish the effect of prior exposure from that of the present exposure. Genetic polymorphism and dietary factors that influence the redox system may modulate the effects of air pollution on allergic disease. Therefore, further genetic association studies are required to identify individuals vulnerable to adverse effects from TAP, and ongoing cohorts should reassess the effects of traffic exhaust on allergic disease, respiratory health, and sensitization in children.
In conclusion, the results of this study suggest that exposure to traffic-related air pollution may be associated with an increased risk of asthma, AR, and allergic sensitization, as well as with reduced lung function in schoolchildren. The observed relationship between the prevalence of allergic disease and residential proximity to main roads suggest that emissions from motor vehicles may have clinical implications. However, our results were based on a cross-sectional study using a proxy marker for TAP during a crude exposure period. Further longitudinal studies are warranted.

 XML Download