Abstract
Background/Aims
Socioecomomic factor is an important determinant of access to healthcare and is one of the potential causes of disparities in esophageal cancer care outcomes. The aim of the study was to clarify the association between National health Insurance status (health insurance vs. medicare) as a socioeconomic factor and survival of patients with esophageal cancer who underwent surgical resection.
Methods
Among the 66 patients who underwent surgical resection for esophageal cancer between January 2006 and December 2017, 17 patients (25.8%) were in the medicare group. The data were analyzed to identify clinical manifestations and to compare surgical and oncologic outcomes between the groups.
Results
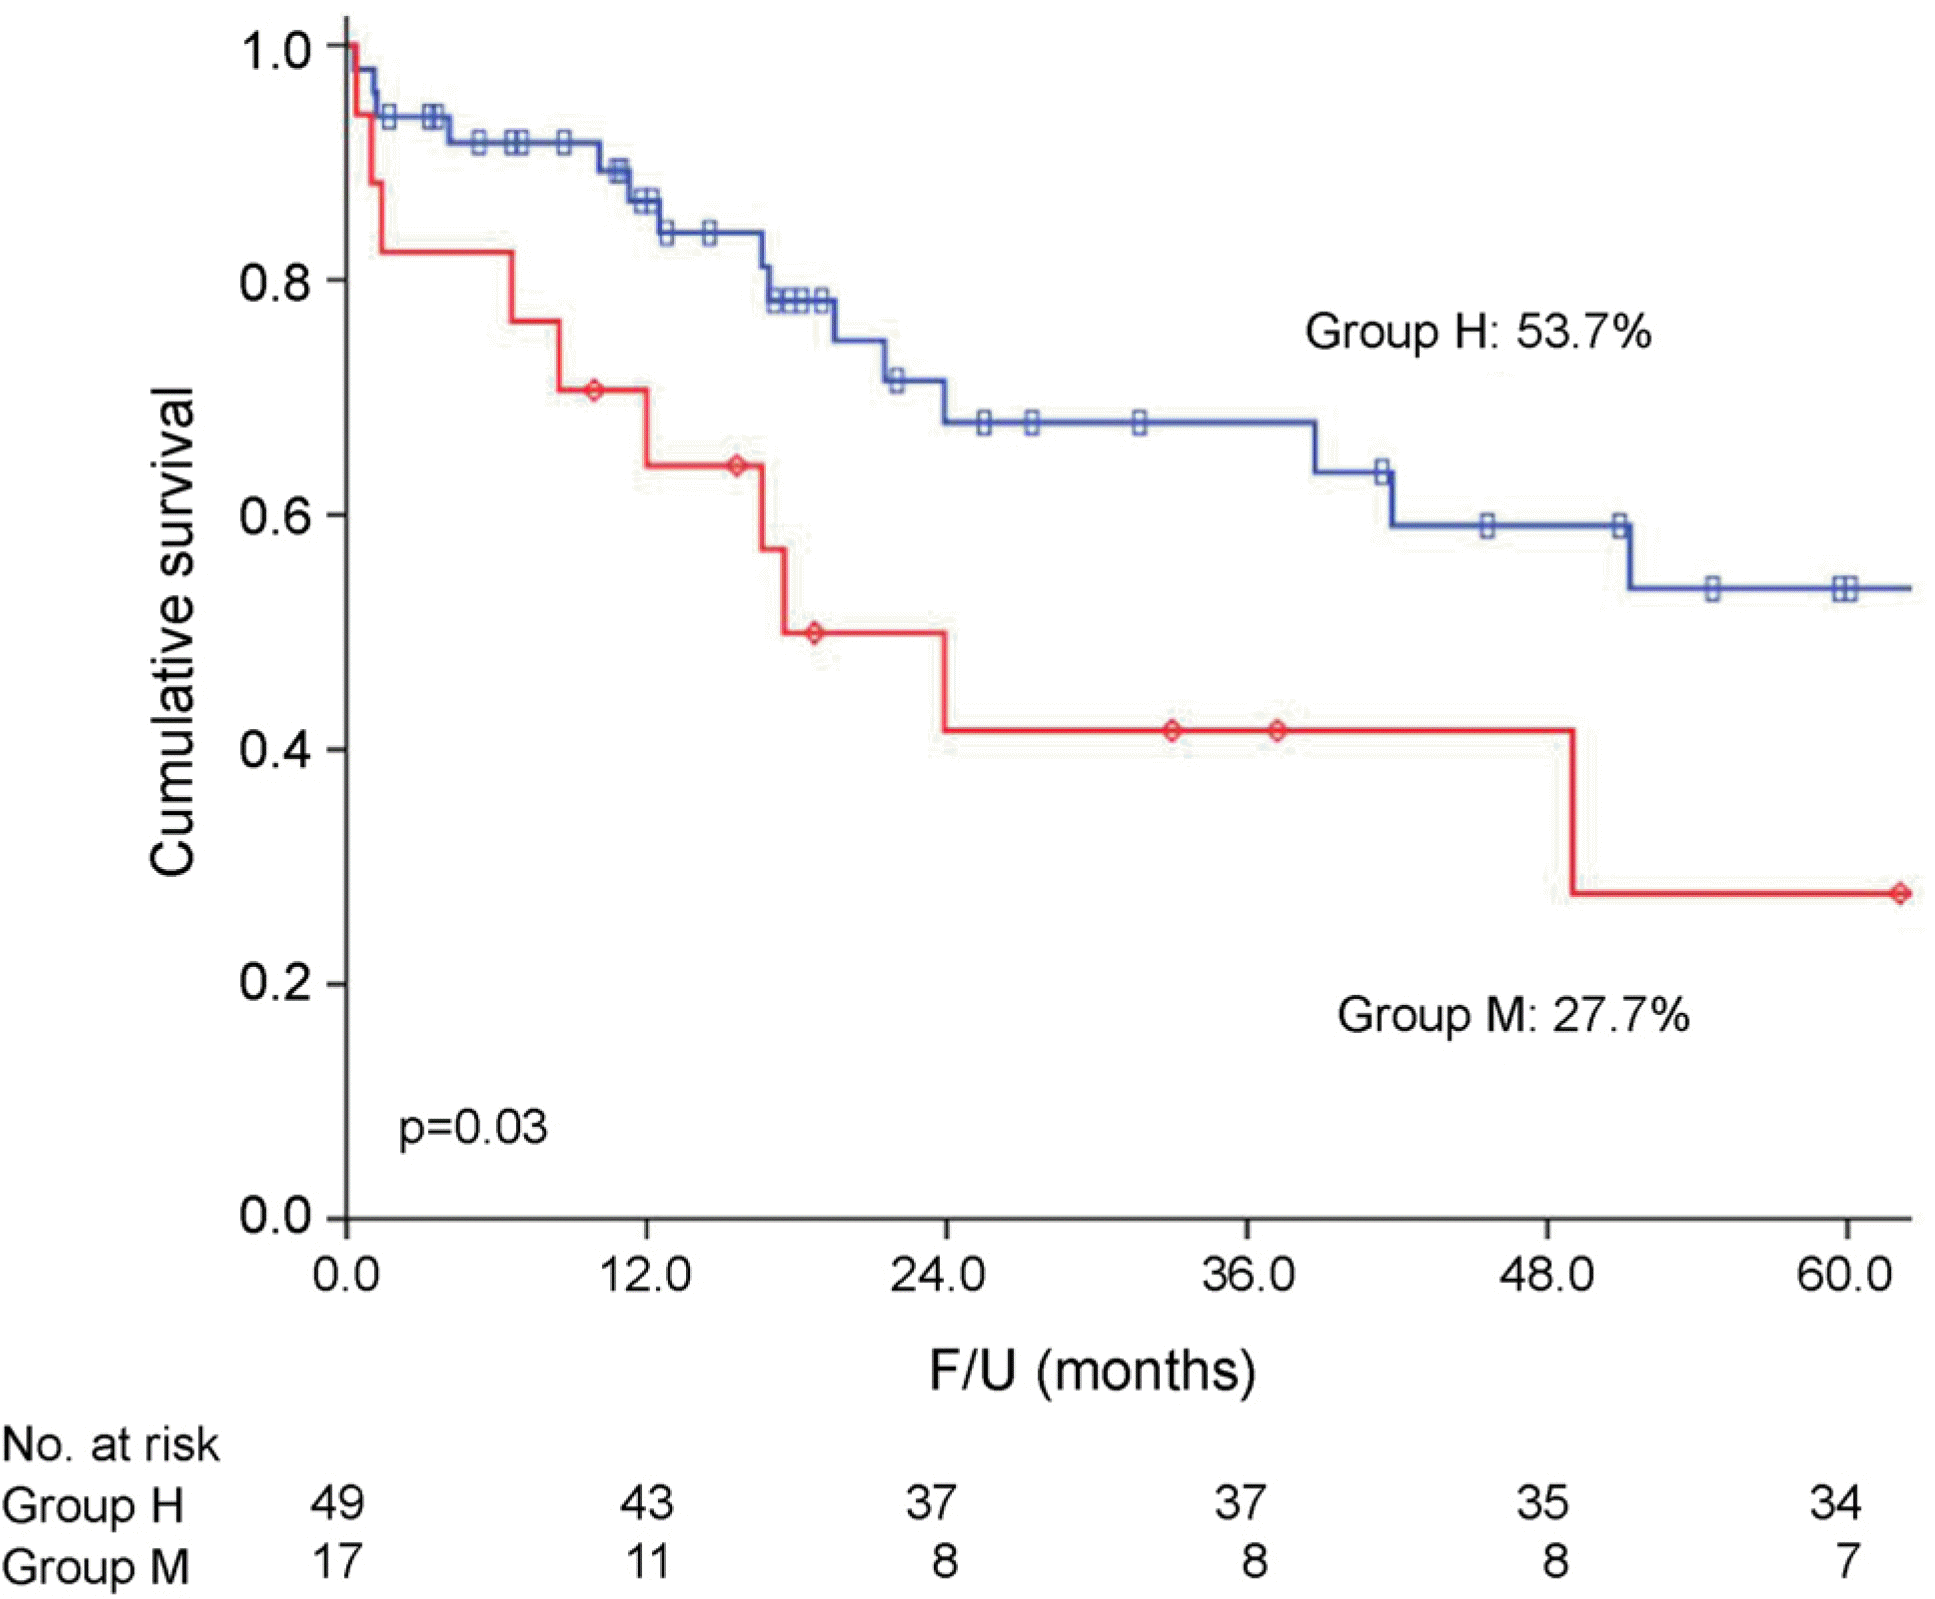
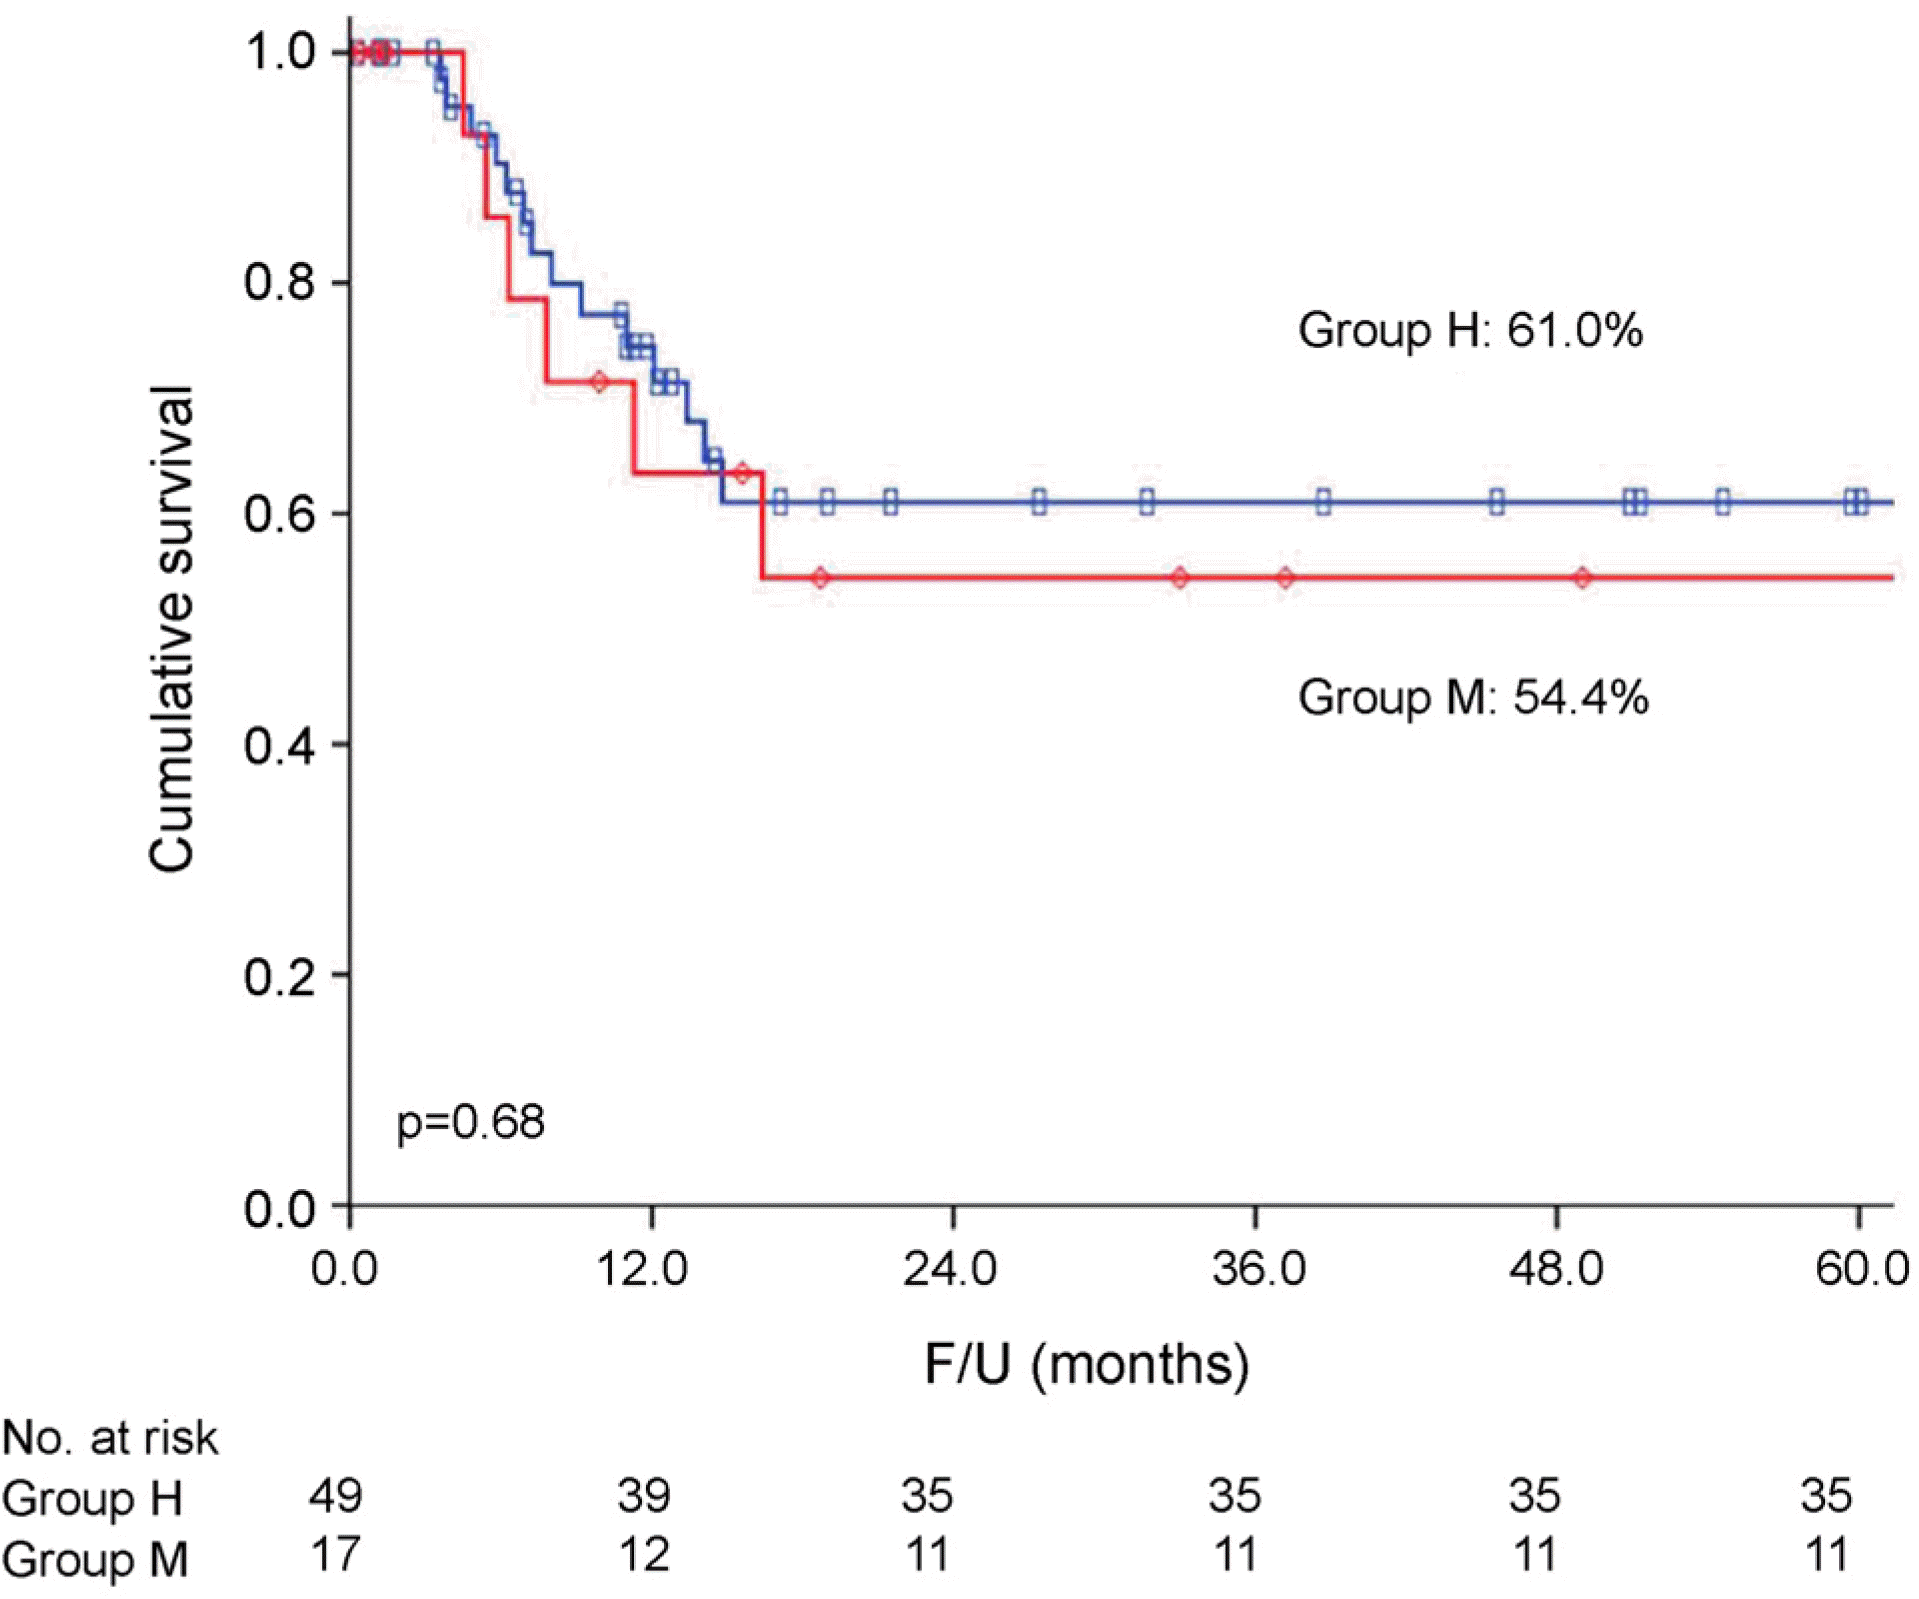
There was no significant difference in the distribution of sex (p=0.13), age (p=0.24), and pathologic stage (p=0.61) between the groups. The length of median hospital stay was significantly shorter in the healthy insurance group (18 days vs. 25 days, p=0.04). In the medicare group, postoperative mortality rates and incidence of postoperative complication were non-significantly higher (11.8% vs. 6.1%, p=0.45, 64.7% vs. 46.7%, p=0.21, respectively). However, pulmonary complication rates, including pneumonia, acute respiratory distress syndorme, and prolonged air leakage was significantly higher in the medicare group (47.1% vs. 18.4%, p=0.02). Five-year disease free survival rate was not different between the two groups (61.0% vs. 54.5%, p=0.68); the 5-year overall survival rate was significantly lower in the medicare group (27.7% vs. 53.7%, p=0.03).
References
1. Wang N, Cao F, Liu F, et al. The effect of socioeconomic status on healthcare delay and treatment of esophageal cancer. J Transl Med. 2015; 13:241.

2. Jung KW, Won YJ, Kong HJ, Lee ES. Cancer statistics in Korea: incidence, mortality, survival, and prevelence in 2015. Cancer Res Treat. 2018; 50:303–316.
3. Jemal A, Bray F, Center MM, Ferlay J, Ward E, Forman D. Global cancer statistics. CA Cancer J Clin. 2011; 61:69–90.

4. Mayor S. People with oesophageal and oropharyngeal cancers delay seeing their GP, audit shows. BMJ. 2014; 348:g1324.

5. van Vliet EP, Eijkemans MJ, Steyerberg EW, et al. The role of socioeconomic status in the decision making on diagnosis and treatment of oesophageal cancer in The Netherlands. Br J Cancer. 2006; 95:1180–1185.

6. Islami F, Kamangar F, Nasrollahzadeh D, et al. Socioeconomic status and oesophageal cancer: results from a population-based casecontrol study in a high-risk area. Int J Epidemiol. 2009; 38:978–988.

7. Brown LM, Hoover R, Silverman D, et al. Excess incidence of squamous cell esophageal cancer among US Black men: role of social class and other risk factors. Am J Epidemiol. 2001; 153:114–122.
8. Dar NA, Shah IA, Bhat GA, et al. Socioeconomic status and esophageal squamous cell carcinoma risk in Kashmir, India. Cancer Sci. 2013; 104:1231–1236.

9. Bus P, Aarts MJ, Lemmens VE, et al. The effect of socioeconomic status on staging and treatment decisions in esophageal cancer. J Clin Gastroenterol. 2012; 46:833–839.

10. Parker SL, Tong T, Bolden S, Wingo PA. Cancer statistics, 1996. Ca Cancer J Clin. 1996; 46:5–27.

11. Crew KD, Neugut AI. Epidemiology of upper gastrointestinal malignancies. Semin Oncol. 2004; 31:450–464.

12. Engel LS, Chow WH, Vaughan TL, et al. Population attributable risks of esophageal and gastric cancers. J Natl Cancer Inst. 2003; 95:1404–1413.

13. Skinner DB, Little AG, Ferguson MK, Soriano A, Staszak VM. Selection of operation for esophageal cancer based on staging. Ann Surg. 1986; 204:391–401.

14. Kim YT, Sung SW, Kim JH. Long term survival after the resection of esophageal cancer. Korean J Thorac Cardiovasc Surg. 1999; 32:653–659.
15. Yim SB, Park JH, Baik HJ, Shim YM, Zo JI. Longterm resultof surgical treatmentfor esophageal cancer. Korean J Thorac Cardiovasc Surg. 2001; 34:148–155.
16. Ferguson MK, Durkin AE. Preoperative prediction of the risk of pulmonary complications after esophagectomy for cancer. J Thorac Cardiovasc Surg. 2002; 123:661–669.

17. Atkins BZ, Shah AS, Hutcheson KA, et al. Reducing hospital morbidity and mortality following esophagectomy. Ann Thorac Surg. 2004; 78:1170–1176. discussion 1170–1176.

18. Kim HS, Yoo JW, Kim KM, Shim YM. The recurrence and survival after complete resection of esophageal cancer. Korean J Thorac Cardiovasc Surg. 2003; 36:411–417.
Fig. 1.
Five-year survival rate of patients between health insurance group (group H) and medicare group (group M). F/U, follow up.

Fig. 2.
Five-year freedom from recurrence rate of patients between health insurance group (group H) and medicare group (group M). F/U, follow up.

Table 1.
Patient Characteristics
Table 2.
Postoperative Complications and Operative Mortality after Esophagectomy for Esophageal Cancer


 PDF
PDF ePub
ePub Citation
 Print
Print


 XML Download