

 PDF
PDF ePub
ePub Citation
 Print
Print


 , Woo Kyoung Kim2
Abstract
Purpose
Methods
Results
Conclusion
Figures and Tables
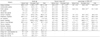
Table 1
The general characteristics and mean processed food intake in subjects
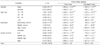
All analysis accounted for the complex sampling design and appropriate sampling weights of the national survey.
1) * p < 0.05; *** p < 0.001; ns, no statistical significance, by chi-square test
2) Mean ± standard error
3) * p < 0.05; *** p < 0.001 by proc survey multiple regression after adjusting age (or sex), and energy intake
4) abc: Different superscript letter indicates the comparison with significant differences among groups as determined by Bonferrori test (p < 0.05) after adjusting for either age (or sex), and energy intake.
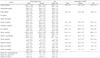
Table 2
Food intake from natural and processed food by food group
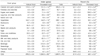
All analysis accounted for the complex sampling design and appropriate sampling weights of the national survey.
1) Mean ± standard error
2) * p < 0.05; ** p < 0.01; *** p < 0.001; ns, no statistical significance, after adjusting for for either age (or sex), and energy intake
3) % = Food intake of natural food (g) or food intake of processed food (g)/ total food intake (g) × 100
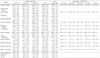
Table 3
The daily intakes of processed food by food group according to gender and ages
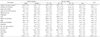
All analysis accounted for the complex sampling design and appropriate sampling weights of the national survey.
1) Mean ± standard error, rounded to one decimal digit
2) * p < 0.05; ** p < 0.01; *** p < 0.001; ns, no statistical significance, after adjusting for either age (or sex) and energy intake
3) Different superscript letter indicates the comparison with significant differences among groups as determined by Bonferrori test (p < 0.05) after adjusting for either age (or sex), and energy intake.
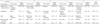
Table 5
Nutrient intakes and percentage of KDRIs from natural and processed food in all subjects
All analysis accounted for the complex sampling design and appropriate sampling weights of the national survey.
1) Mean ± standard error, rounded to one decimal digit
2) * p < 0.05; ** p < 0.01; *** p < 0.001; ns, no statistical significance, after adjusting for either age (or sex) and energy intake
3) % = nutrient intake of natural food (g) or nutrient intake of processed food (g)/ total nutrient intake (g) × 100
4) Dietary reference intakes for Korean (KDRIs): energy, Estimated energy requirement (EER); protein, Ca, P, Fe, vitamin A thiamin, riboflavin, niacin, vitamin C, Recommended Nutrient Intake (RDA); sodium, Adequate Intake (AI); -, In case of carbohydrate and fat, no dietary reference intakes for Korean (KDRIs) exist
Table 6
Nutrient intakes and percentage of KDRIs from processed food according to gender
All analysis accounted for the complex sampling design and appropriate sampling weights of the national survey.
1) Mean ± standard error. rounded to one decimal digit
2) % = processed food intake (g)/ total nutrient intake (g) × 100
3) * p < 0.05; ** p < 0.01; *** p < 0.001; ns, no statistical significance, after adjusting for either age (or sex) and energy intake
4) Dietary reference intakes for Korean (KDRIs): energy, Estimated energy requirement (EER); protein, Ca, P, Fe, vitamin A thiamin, riboflavin, niacin, vitamin C, Recommended Nutrient Intake (RDA); sodium, Adequate Intake (AI); -, In case of carbohydrate and fat, no dietary reference intakes for Korean (KDRIs) exist
Table 7
Nutrient intakes and percentage of KDRIs from processed food according to ages
All analysis accounted for the complex sampling design and appropriate sampling weights of the national survey.
1) Mean intake (g) ± standard error. rounded to one decimal digit
2) % = processed food intake (g)/ total nutrient intake (g) × 100
3) * p < 0.05; ** p < 0.01; *** p < 0.001; ns, no statistical significance, after adjusting for either age (or sex) and energy intake
4) Different superscript letter indicates the comparison with significant differences among groups as determined by Bonferrori test (p < 0.05) after adjusting for either age (or sex) and energy intake.
5) Dietary reference intakes for Korean (KDRIs): energy, Estimated energy requirement (EER); protein, Ca, P, Fe, vitamin A thiamin, riboflavin, niacin, vitamin c, Recommended Nutrient Intake (RDA); sodium, Adequate Intake (AI); -, In case of carbohydrate and fat, no dietary reference intakes for Korean (KDRIs) exist
 XML Download