Abstract
Purpose
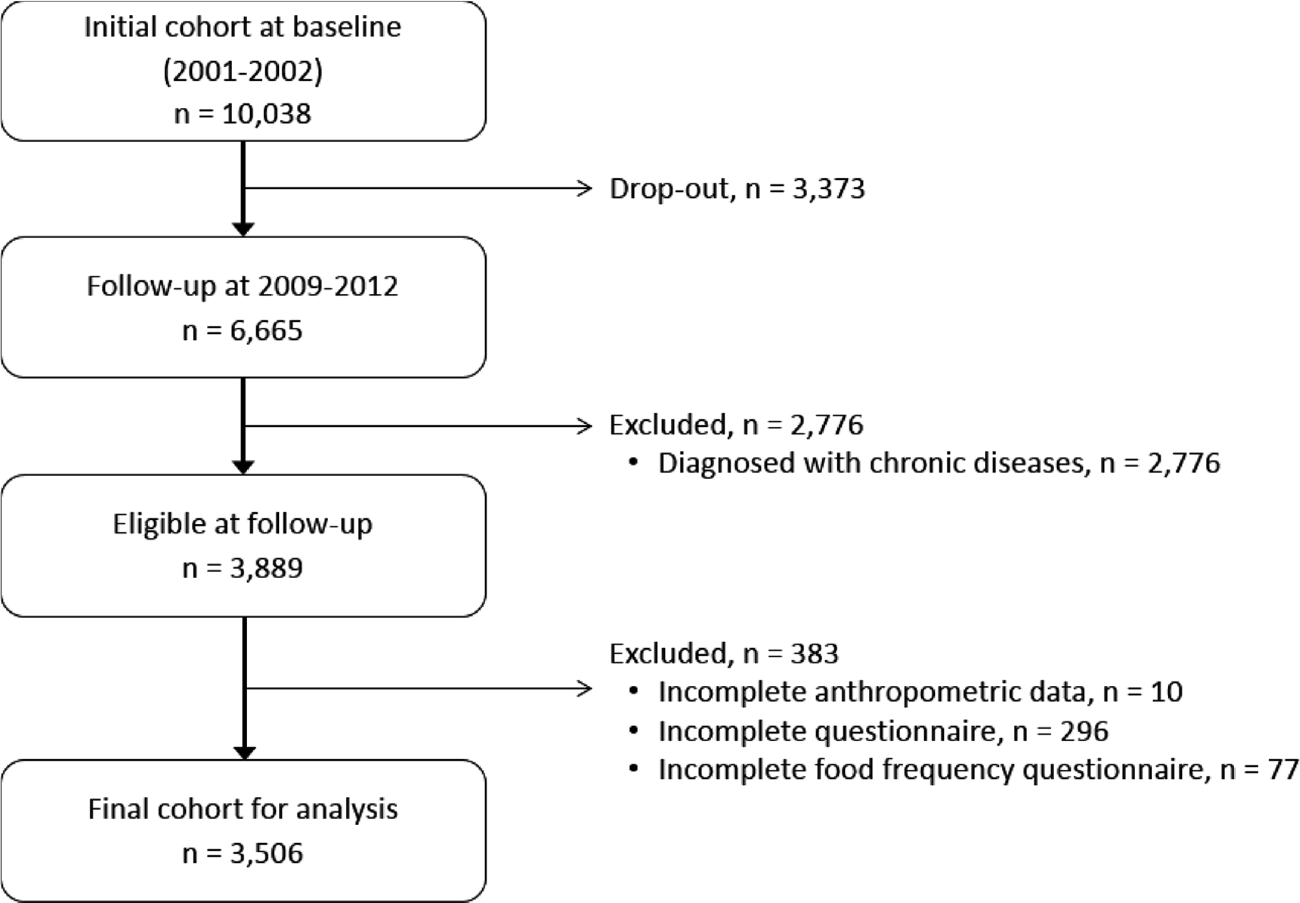
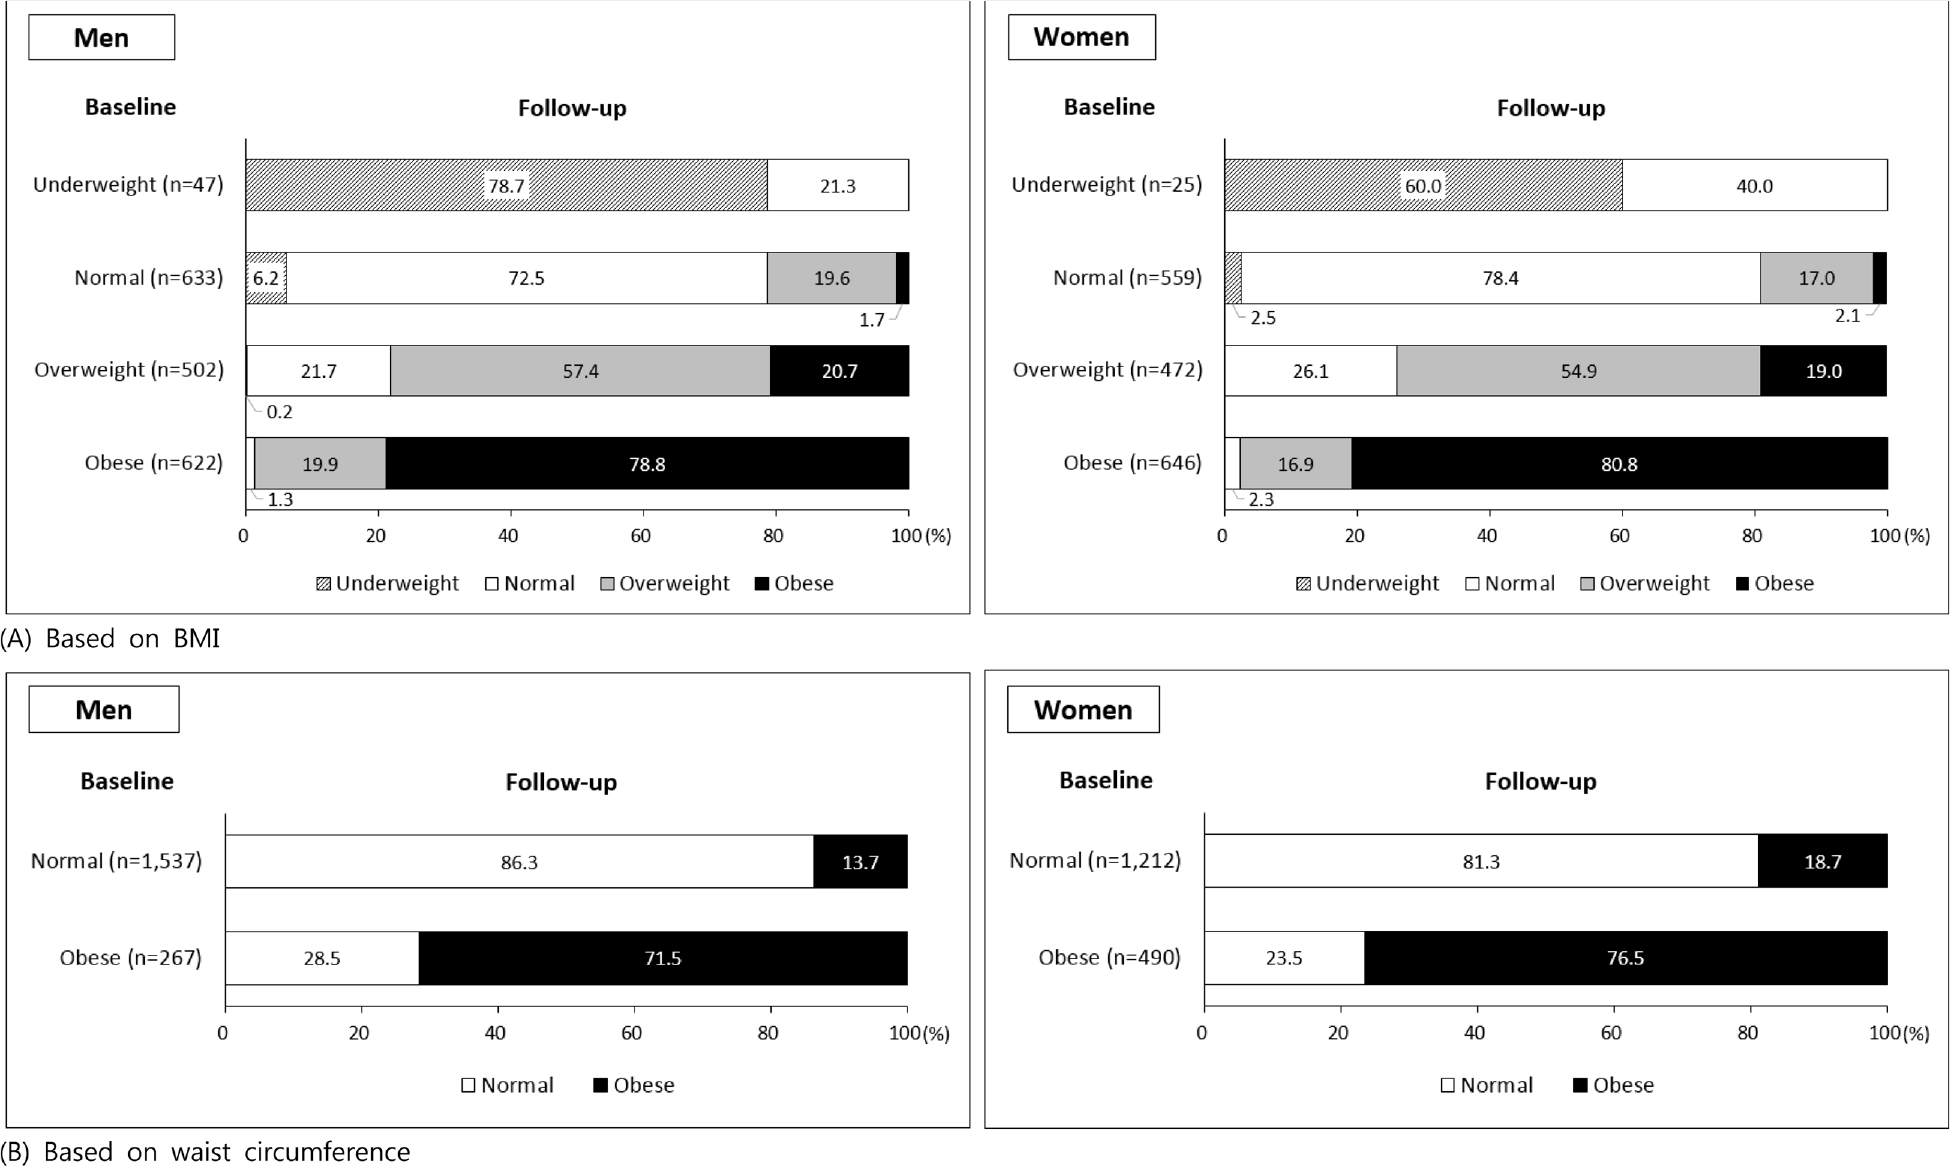
The purposes of this study were to describe changes in weight, waist circumference (WC), and prevalence of obesity over 8 years as well as investigate demographic and dietary factors associated with weight gain in Korean adults. Methods: The Korean Genome and Epidemiology Study is an ongoing community-based longitudinal study, which was started in 2001∼2002 and repeated every 2 years. Height, weight, and WC were measured, and demographic data and food intake information using the food frequency questionnaire were collected from 10,038 adults aged 40∼69 years at baseline. Among those individuals, 3,506 healthy individuals without chronic diseases completed the 4th follow-up survey in 2009∼2010. Results: Mean weight decreased by 0.35 kg and 0.65 kg in men and women, respectively, whereas mean WC increased by 1.71 cm and 1.85 cm during the 8-year period. Prevalence of obesity based on body mass index (BMI) decreased from 34.5% to 33.5% in men and from 38.0% to 36.7% in women, whereas abdominal obesity increased from 14.8% to 22.2% in men and from 28.8% to 35.4% in women. Weight change was associated with age and smoking status in men, and residence area, age, education, income, and alcohol drinking in women. Approximately 57.5% maintained their BMI over 8 years (< ±1 kg/m2, stable weight group), 19.5% showed a BMI increase of ≥ 1 kg/m2 (weight gain group), and 23.0% showed a BMI decrease of more than 1 kg/m2 (weight loss group). There was no significant difference in energy intake calculated as the percentage of estimated energy requirements among the three weight change groups. Intakes of coffee mix and milk were significantly higher in the weight gain group than in the weight loss group in men after controlling for confounding factors. Conclusion: Our results show that higher consumption of coffee mix and milk was associated with weight gain in Korean healthy men.
References
1. World Health Organization. Obesity: preventing and managing the global epidemic. Report of a WHO consultation. World Health Organ Tech Rep Ser. 2000; 894:i–xii. 1–253.
2. Abdelaal M, le Roux CW, Docherty NG. Morbidity and mortality associated with obesity. Ann Transl Med. 2017; 5(7):161.

3. World Health Organization Western Pacific Region; International Association for the Study of Obesity; International Obesity Task Force. The Asia-Pacific perspective: redefining obesity and its treatment. Sydney: Health Communications Australia Pty Limited;2000.
4. Ministry of Health and Welfare, Korea Centers for Disease Control and Prevention. Korea Health Statistics 2015: Korea National Health and Nutrition Examination Survey (KNHANES VI-3) [Internet]. Sejong: Korea Centers for Disease Control and Prevention;2016. [cited 2017 May 10]. Available from:. https://knhanes. cdc.go.kr/knhanes/main.do.
5. Bae NK, Kwon IS, Cho YC. Ten year change of body mass index in Korean: 1997–2007. Korean J Obes. 2009; 18(1):24–30.
6. Ball K, Crawford D. Socioeconomic status and weight change in adults: a review. Soc Sci Med. 2005; 60(9):1987–2010.

7. Paige E, Korda RJ, Banks E, Rodgers B. How weight change is modelled in population studies can affect research findings: empirical results from a large-scale cohort study. BMJ Open. 2014; 4(6):): e004860.

8. Ball K, Crawford D, Ireland P, Hodge A. Patterns and demographic predictors of 5-year weight change in a multiethnic cohort of men and women in Australia. Public Health Nutr. 2003; 6(3):269–281.

9. Meltzer AA, Everhart JE. Self-reported substantial 1-year weight change among men and women in the United States. Obes Res. 1995; 3(Suppl 2):123s–134s.

10. Martikainen PT, Marmot MG. Socioeconomic differences in weight gain and determinants and consequences of coronary risk factors. Am J Clin Nutr. 1999; 69(4):719–726.

11. Schulze MB, Manson JE, Ludwig DS, Colditz GA, StampferMJ , WillettWC , Hu FB. Sugar-sweetened beverages, weight gain, and incidence of type 2 diabetes in young and middle-aged women. JAMA. 2004; 292(8):927–934.

12. Bes-Rastrollo M, Sánchez-Villegas A, Gómez-Gracia E, Martínez JA, Pajares RM, Martínez-González MA. Predictors of weight gain in a Mediterranean cohort: the Seguimiento Universidad de Navarra Study 1. Am J Clin Nutr. 2006; 83(2):362–370.
13. Louie JC, Flood VM, Hector DJ, Rangan AM, Gill TP. Dairy consumption and overweight and obesity: a systematic review of prospective cohort studies. Obes Rev. 2011; 12(7):e582–e592.

14. Martinez-Gonzalez MA, Sayon-Orea C, Ruiz-Canela M, de la Fuente C, Gea A, Bes-Rastrollo M. Yogurt consumption, weight change and risk of overweight/obesity: the SUN cohort study. Nutr Metab Cardiovasc Dis. 2014; 24(11):1189–1196.

15. Martínez-González MA, Bes-Rastrollo M. Nut consumption, weight gain and obesity: epidemiological evidence. Nutr Metab Cardiovasc Dis. 2011; 21(Suppl 1):S40–S45.

16. Sayon-Orea C, Bes-Rastrollo M, Basterra-Gortari FJ, Beunza JJ, Guallar-Castillon P, de la Fuente-Arrillaga C, Martinez-Gonzalez MA. Consumption of fried foods and weight gain in a Mediterranean cohort: the SUN project. Nutr Metab Cardiovasc Dis. 2013; 23(2):144–150.

17. Lee HJ, Cho JI, Lee HS, Kim CI, Cho E. Intakes of dairy products and calcium and obesity in Korean adults: Korean National Health and Nutrition Examination Surveys (KNHANES) 2007–2009. PLoS One. 2014; 9(6):): e99085.

18. Chung S, Ha K, Lee HS, Kim CI, Joung H, Paik HY, Song Y. Soft drink consumption is positively associated with metabolic syndrome risk factors only in Korean women: data from the 2007–2011 Korea National Health and Nutrition Examination Survey. Metabolism. 2015; 64(11):1477–1484.

19. Song F, Oh JE, Lee KW, Cho MS. The effect of coffee consumption on food group intake, nutrientintake, and metabolic syndrome of Korean adults—2010 KNHANES (V-1). NFS J. 2016; 4:9–14.
20. Lee S, Park HS, Kim SM, Kwon HS, Kim DY, Kim DJ, Cho GJ, Han JH, Kim SR, Park CY, Oh SJ, Lee CB, Kim KS, Oh SW, Kim YS, Choi WH, Yoo HJ. Cut-off points of waist circumference for defining abdominal obesity in the Korean population. Korean J Obes. 2006; 15(1):1–9.
21. Ahn Y, Lee JE, Paik HY, Lee HK, Jo I, Kimm K. Development of a semiquantitative food frequency questionnaire based on dietary data from the Korea National Health and Nutrition Examination Survey. Nutr Sci. 2003; 6(3):173–184.
22. The Korean Nutrition Society. Recommended dietary allowances for Koreans. 7th revision edition. Seoul: The Korean Nutrition Society;2000.
23. Ahn Y, Kwon E, Shim JE, Park MK, Joo Y, Kimm K, Park C, Kim DH. Validation and reproducibility of food frequency questionnaire for Korean genome epidemiologic study. Eur J Clin Nutr. 2007; 61(12):1435–1441.

24. Ministry of Health and Welfare (KR); The Korean Nutrition Society. Dietary reference intakes for Koreans 2015. Sejong: Ministry of Health and Welfare;2016.
25. Lee MS, Kim JH, Lee BS, Lee YN, Son SM, Lee JW. Nutritional assessment. 4th edition.Paju: Kyomoonsa;2016.
26. Ministry of Agriculture, Food and Rural Affairs (KR); Korea Agro-Fisheries & Food Trade Corporation.A survey on consumption and consuming behavior of processed foods in 2015 [Internet]. Naju: Korea Agro-Fisheries & Food Trade Corporation;2015. [cited 2017 Jun 23]. Available from:. http://www.atfis.or.kr/article/M001040000/view.do?articleId=2061&page=&search-Key=&searchString=&searchCategory=.
27. Williamson DF. Descriptive epidemiology of body weight and weight change in U.S. adults. Ann Intern Med. 1993; 119(7 Pt 2):646–649.

28. Kuczmarski RJ. Prevalence of overweight and weight gain in the United States. Am J Clin Nutr. 1992; 55(2 Suppl):495S–502S.

29. Ministry of Health and Welfare, Korea Centers for Disease Control and Prevention. Korea Health Statistics 2009: Korea National Health and Nutrition Examination Survey (KNHANES IV-3) [Internet]. Cheongwon: Korea Centers for Disease Control and Prevention;2010. [cited 2017 May 10]. Available from:. https://knhanes.cdc.go.kr/knhanes/main.do.
30. Ebrahimi-Mameghani M, Scott JA, Der G, Lean ME, Burns CM. Changes in weight and waist circumference over 9 years in a Scottish population. Eur J Clin Nutr. 2008; 62(10):1208–1214.

31. Tanamas SK, Shaw JE, Backholer K, Magliano DJ, Peeters A. Twelve-year weight change, waist circumference change and incident obesity: the Australian diabetes, obesity and lifestyle study. Obesity (Silver Spring). 2014; 22(6):1538–1545.

32. Matsushita Y, Takahashi Y, MizoueT , Inoue M, Noda M, Tsugane S. JPHC Study Group. Overweight and obesity trends among Japanese adults: a 10-year follow-up of the JPHC Study. Int J Obes (Lond). 2008; 32(12):1861–1867.

33. Hou X, Jia W, Bao Y, Lu H, Jiang S, Zuo Y, Gu H, Xiang K. Risk factors for overweight and obesity, and changes in body mass index of Chinese adults in Shanghai. BMC Public Health. 2008; 8(1):389.

34. Ho LM, Wang MP, Ho SY, Lam TH. Changes in individual weight status based on body mass index and waist circumference in Hong Kong Chinese. PLoS One. 2015; 10(3):e0119827.

35. Dr⊘yvold WB, Nilsen TI, Krüger O, Holmen TL, Krokstad S, Midthjell K, Holmen J. Change in height, weight and body mass index: longitudinal data from the HUNT Study in Norway. Int J Obes. 2006; 30(6):935–939.

36. Proietto J. Obesity and weight management at menopause. Aust Fam Physician. 2017; 46(6):368–370.
37. Ministry of Agriculture, Food and Rural Affairs (KR); Korea Agro-Fisheries & Food Trade Corporation.A survey on current status of processed food market segmentation in 2012 – coffee mix [Internet]. Seoul: Korea Agro-Fisheries & Food Trade Corporation;2012. [cited 2017 Jun 23]. Available from:. http://www.atfis.or.kr/article/M001050000/view.do?articleId=512.
38. Ministry of Agriculture, Food and Rural Affairs (KR); Korea Agro-Fisheries & Food Trade Corporation. A survey on current status of processed food market segmentation in 2016 – coffee market [Internet]. Naju: Korea Agro-Fisheries & Food Trade Corporation;2016. [cited 2017 Jun 23]. Available from:. http://www.atfis.or.kr/article/M001050000/view.do?articleId=2511.
39. Je Y, Jeong S, Park T. Coffee consumption patterns in Korean adults: the Korean National Health and Nutrition Examination Survey (2001–2011). Asia Pac J Clin Nutr. 2014; 23(4):691–702.
40. Shin J, Kim SY, Yoon J. Status of coffee intake in South Korea: analysis of 2007–2009 Korea National Health and Nutrition Examination Survey. Korean J Community Living Sci. 2016; 27(1):83–93.

41. Korea Consumer Agency. A report of quality test result for coffee mix [Internet]. Seoul: Korea Consumer Agency;2014. [cited 2017 Jul 3]. Available from:. http://www.kca.go.kr/brd/m_46/view.do. ? seq=1800&itm_seq_1=2.
42. Lee HS, Kwon SO, Yon M, Kim D, Lee JY, Nam J, Park SJ, Yeon JY, Lee SK, Lee HY, Kwon OS, Kim CI. Dietary total sugar intake of Koreans: based on the Korea National Health and Nutrition Examination Survey (KNHANES), 2008–2011. J Nutr Health. 2014; 47(4):268–276.

43. Kim HJ, Cho S, Jacobs DR Jr, Park K. Instant coffee consumption may be associated with higher risk of metabolic syndrome in Korean adults. Diabetes Res Clin Pract. 2014; 106(1):145–153.

Table 1.
Characteristics of the study population at baseline
Table 2.
Anthropometric measurements and prevalence of obesity at baseline and at 8-year follow-up
Table 3.
Changes in weight and waist circumference over 8 years by general characteristics at baseline
Table 4.
Anthropomeric changes over 8 years in the three groups classified based on weight changes
Table 5.
Mean energy intake and nutrient adequacy ratio (NAR) of selected nutrients at baseline
Table 6.
Mean intake of selected sugar containing foods and beverages at baseline
1) By ANOVA 2) Adjusted for area, age, education, income, alcohol at baseline, and smoking at follow-up 3) Mean ± SD (g/day) 4) Not significant 5) Different letters within the same row are significantly different by Tukey's test. 6) Sum of the intakes of 12 items among 14 items except green tea and milk


 PDF
PDF ePub
ePub Citation
 Print
Print


 XML Download