

 PDF
PDF ePub
ePub Citation
 Print
Print


Abstract
Purpose
The purpose of this study was to estimate dietary intake of vitamin D and the relationship between serum 25-hydroxyvitamin D (25OHD) concentration and bone mineral density (BMD) in Korean adults using the 2011 data from the Korea National Health and Nutrition Examination Survey.
Methods
Daily intake of vitamin D and ratio of subjects that consumed less vitamin D than adequate intake (AI) were estimated in 4,879 Korean adults. The relationship between daily intake of vitamin D and serum 25OHD and BMD were analyzed.
Results
Average daily intakes of vitamin D were 3.84 ± 0.23 µg/day for men and 2.22 ± 0.11 µg/day for women. Approximately 72~97% of men and 80~99% of women consumed less than the AI of vitamin D for Koreans. Serum 25OHD concentration increased with age, and the ratios of serum vitamin D deficiency (< 20 ng/mL) were 47.8~81.1% for men and 59.4~92.8% for women. Average intake of vitamin D was higher in subjects aged < 50 yr than in those ≥ 50 yr, but lower in serum 25OHD concentration. In subjects aged < 50 yr, serum 25OHD was higher in subjects that consumed 10 µg/day of vitamin D than in those that consumed less than 5 µg/day. In female subjects aged ≥ 50 yr, average intake of vitamin D was associated with higher bone mineral density.
Conclusion
It was found that dietary intake of vitamin D could increase serum 25OHD concentration in young adults and bone mineral density in old women. Therefore, nutrition policies for enriched foods with vitamin D and nutrition education to consume more vitamin D-rich foods are needed to ameliorate vitamin D status of the Korean population. Adequate intake for Korean population aged < 50 yr might be adjusted upwardly up to 10 µg/day.
Figures and Tables
Fig. 1
Flowchart of subject inclusion and exclusion in the Korea National Health and Nutrition Examination Survey 2011
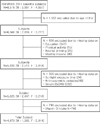
Fig. 2
Sun exposure-adjusted serum 25OHD concentrations by vitamin D intake level. Serum 25OHD concentrations is expressed as mean ± SE. Results from the complex samples general linear model. *p < 0.05, **p < 0.01
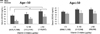
Fig. 3
Serum 25(OH)D concentration-adjusted bone mineral density by vitamin D intake level in women over 50 yr. Bone mineral density is expressed as mean ± SE. WTBMD: wholebody total bone mineral density, THBMD: total hip bone mineral density, FNBMD: femur neck bone mi neral density, LSBMD: lumbar spine bone mineral density. Results from the complex samples general linear model. *p < 0.05
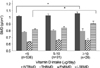
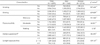
Table 2
Mean energy and vitamin D intakes and mean serum 25OHD concentration of Koreans, in 2011, by age and gender
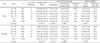
Table 3
Regression coefficient (95% CI) for association between serum vitamin D concentration and variables according to the sex
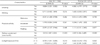
Table 4
Contribution of vitamin D-rich food groups towards the daily mean intake of vitamin D in Korean adults
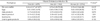
Table 5
Bone mineral density at the total hip, femur neck, lumbar spine and wholebody of subject
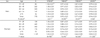
1) Data are shown as mean ± SE (g/cm2). 2) WTBMD: wholebody total bone mineral density 3) THBMD: total hip bone mineral density 4) FNBMD: femur neck bone mineral density 5) LSBMD: lumbar spine bone mineral density 6) F-value was based on the results from the complex samples general linear model.
*p < 0.05, **p < 0.01, ***p < 0.001
References
1. Shin CS, Choi HJ, Kim MJ, Kim JT, Yu SH, Koo BK, Cho HY, Cho SW, Kim SW, Park YJ, Jang HC, Kim SY, Cho NH. Prevalence and risk factors of osteoporosis in Korea: a community-based cohort study with lumbar spine and hip bone mineral density. Bone. 2010; 47(2):378–387.

2. Ministry of Health and Welfare. Korea Centers for Disease Control and Prevention. Korea Health Statistics 2010: Korea National Health and Nutrition Examination Survey (KNHANES V-1). . Cheongwon: Korea Centers for Disease Control and Prevention;2011.
3. Tucker KL, Chen H, Hannan MT, Cupples LA, Wilson PW, Felson D, Kiel DP. Bone mineral density and dietary patterns in older adults: the Framingham osteoporosis study. Am J Clin Nutr. 2002; 76(1):245–252.
4. Nieves JW. Osteoporosis: the role of micronutrients. Am J Clin Nutr. 2005; 81(5):1232S–1239S.
5. Sowers M. Epidemiology of calcium and vitamin D in bone loss. J Nutr. 1993; 123:2 Suppl. 413–417.
6. Lips P. Vitamin D physiology. Prog Biophys Mol Biol. 2006; 92(1):4–8.
7. Davis CD. Vitamin D and cancer: current dilemmas and future research needs. Am J Clin Nutr. 2008; 88(2):565S–569S.
8. Brannon PM, Yetley EA, Bailey RL, Picciano MF. Vitamin D and health in the 21st century: an update. proceedings of a conference held September 2007 in Bethesda, Maryland, USA. Am J Clin Nutr. 2008; 88(2):483S–592S.
9. Kim S, Lim J, Kye S, Joung H. Association between vitamin D status and metabolic syndrome risk among Korean population: based on the Korean National Health and Nutrition Examination Survey IV-2, 2008. Diabetes Res Clin Pract. 2012; 96(2):230–236.
10. Hwang YC, Ahn HY, Jeong IK, Ahn KJ, Chung HY. Optimal serum concentration of 25-hydroxyvitamin D for bone health in older Korean adults. Calcif Tissue Int. 2013; 92(1):68–74.
11. Holick MF. McCollum Award Lecture, 1994: vitamin D--new horizons for the 21st century. Am J Clin Nutr. 1994; 60(4):619–630.
12. Thuesen B, Husemoen L, Fenger M, Jakobsen J, Schwarz P, Toft U, Ovesen L, Jørgensen T, Linneberg A. Determinants of vitamin D status in a general population of Danish adults. Bone. 2012; 50(3):605–610.
13. Cinar N, Harmanci A, Yildiz BO, Bayraktar M. Vitamin D status and seasonal changes in plasma concentrations of 25-hydroxyvitamin D in office workers in Ankara, Turkey. Eur J Intern Med. 2014; 25(2):197–201.
14. Darling AL, Hart KH, Gibbs MA, Gossiel F, Kantermann T, Horton K, Johnsen S, Berry JL, Skene DJ, Eastell R, Vieth R, Lanham-New SA. Greater seasonal cycling of 25-hydroxyvitamin D is associated with increased parathyroid hormone and bone resorption. Osteoporos Int. 2014; 25(3):933–941.
15. Matsuoka LY, Wortsman J, Dannenberg MJ, Hollis BW, Lu Z, Holick MF. Clothing prevents ultraviolet-B radiation-dependent photosynthesis of vitamin D3. J Clin Endocrinol Metab. 1992; 75(4):1099–1103.
16. Matsuoka LY, Wortsman J, Hollis BW. Use of topical sunscreen for the evaluation of regional synthesis of vitamin D3. J Am Acad Dermatol. 1990; 22(5 Pt 1):772–775.
17. Kreiter SR, Schwartz RP, Kirkman HN Jr, Charlton PA, Calikoglu AS, Davenport ML. Nutritional rickets in African American breast-fed infants. J Pediatr. 2000; 137(2):153–157.
18. Yu A, Kim J, Kwon O, Oh SY, Kim J, Yang YJ. Associations between serum 25-hydroxyvitamin D and consumption frequencies of vitamin D rich foods in Korean adults and older adults. Korean J Community Nutr. 2014; 19(2):122–132.
19. Delvin EE, Imbach A, Copti M. Vitamin D nutritional status and related biochemical indices in an autonomous elderly population. Am J Clin Nutr. 1988; 48(2):373–378.
20. Villareal DT, Civitelli R, Chines A, Avioli LV. Subclinical vitamin D deficiency in postmenopausal women with low vertebral bone mass. J Clin Endocrinol Metab. 1991; 72(3):628–634.
21. McKenna MJ, Freaney R, Meade A, Muldowney FP. Hypovitaminosis D and elevated serum alkaline phosphatase in elderly Irish people. Am J Clin Nutr. 1985; 41(1):101–109.
22. Spiro A, Buttriss JL. Vitamin D: an overview of vitamin D status and intake in Europe. Nutr Bull. 2014; 39(4):322–350.
23. The Korean Nutrition Society. Dietary reference intakes for Koreans. 1st revision. Seoul: The Korean Nutrition Society;2010.
24. Choe JS, Paik HY. Seasonal variation of nutritional intake and quality in adults in longevity areas. J Korean Soc Food Sci Nutr. 2004; 33(4):668–678.
25. Heo J, Park Y, Park HM. Dietary intake of nutrients and food in postmenopausal Korean women. J Korean Soc Menopause. 2011; 17(1):12–20.
26. Yoo K, Cho J, Ly S. Vitamin D intake and serum 25-hydroxyvitamin D levels in Korean adults: analysis of the 2009 Korea National Health and Nutrition Examination Survey (KNHANES IV-3) using a newly established vitamin D database. Nutrients. 2016; 8(10):E610.
27. The Korean Nutrition Society. Food values 2009. . Seoul: The Korean Nutrion Society;2009.
28. Dawson-Hughes B, Heaney RP, Holick MF, Lips P, Meunier PJ, Vieth R. Estimates of optimal vitamin D status. Osteoporos Int. 2005; 16(7):713–716.
29. Harnack LJ, Steffen L, Zhou X, Luepker RV. Trends in vitamin D intake from food sources among adults in the Minneapolis-St Paul, MN, metropolitan area, 1980-1982 through 2007-2009. J Am Diet Assoc. 2011; 111(9):1329–1334.
30. Tsuboyama-Kasaoka N, Takizawa A, Tsubota-Utsugi M, Nakade M, Imai E, Kondo A, Yoshida K, Okuda N, Nishi N, Takimoto H. Dietary intake of nutrients with adequate intake values in the dietary reference intakes for Japanese. J Nutr Sci Vitaminol (Tokyo). 2013; 59(6):584–595.
31. Okubo H, Sasaki S, Murakami K, Yokoyama T, Hirota N, Notsu A, Fukui M, Date C. Designing optimal food intake patterns to achieve nutritional goals for Japanese adults through the use of linear programming optimization models. Nutr J. 2015; 14:57.
32. Jayaratne N, Hughes MC, Ibiebele TI, van den, van der. Vitamin D intake in Australian adults and the modeled effects of milk and breakfast cereal fortification. Nutrition. 2013; 29(7-8):1048–1053.
33. Moore CE, Radcliffe JD, Liu Y. Vitamin D intakes of adults differ by income, gender and race/ethnicity in the U.S.A., 2007 to 2010. Public Health Nutr. 2014; 17:756–763.
34. Cranney A, Horsley T, O'Donnell S, Weiler H, Puil L, Ooi D, Atkinson S, Ward L, Moher D, Hanley D, Fang M, Yazdi F, Garritty C, Sampson M, Barrowman N, Tsertsvadze A, Mamaladze V. Effectiveness and safety of vitamin D in relation to bone health. Evid Rep Technol Assess (Full Rep). 2007; (158):1–235.
35. Koo JO, Lim HS, Jung YJ, Yoon JS, Lee YR, Lee JH. Understanding basic nutrition. Seoul: Powerbook;2008.
36. Adams JS, Kantorovich V, Wu C, Javanbakht M, Hollis BW. Resolution of vitamin D insufficiency in osteopenic patients results in rapid recovery of bone mineral density. J Clin Endocrinol Metab. 1999; 84(8):2729–2730.
37. Dawson-Hughes B, Harris SS, Krall EA, Dallal GE. Effect of calcium and vitamin D supplementation on bone density in men and women 65 years of age or older. N Engl J Med. 1997; 337(10):670–676.
38. Nikooyeh B, Neyestani TR, Zahedirad M, Mohammadi M, Hosseini SH, Abdollahi Z, Salehi F, Mirzay Razaz J, Shariatzadeh N, Kalayi A, Lotfollahi N, Maleki MR. Vitamin D-fortified bread is as effective as supplement in improving vitamin D status: a randomized clinical trial. J Clin Endocrinol Metab. 2016; 101(6):2511–2519.
39. Allen RE, Dangour AD, Tedstone AE, Chalabi Z. Does fortification of staple foods improve vitamin D intakes and status of groups at risk of deficiency? A United Kingdom modeling study. Am J Clin Nutr. 2015; 102(2):338–344.
 XML Download