Journal List > Nutr Res Pract > v.14(1) > 1141643

Hong, Kim, Lee, and Rim: Development of the anti-cancer food scoring system 2.0: Validation and nutritional analyses of quantitative anti-cancer food scoring model

Abstract

BACKGROUND/OBJECTIVES

We have previously designed the anti-cancer food scoring model (ACFS) 1.0, an evidence-based quantitative tool analyzing the anti-cancer or carcinogenic potential of diets. Analysis was performed using simple quantitative indexes divided into 6 categories (S, A, B, C, D, and E). In this study, we applied this scoring model to wider recipes and evaluated its nutritional relevance.

MATERIALS/METHODS

National or known regional databases were searched for recipes from 6 categories: Korean out-dining, Korean home-dining, Western, Chinese, Mediterranean, and vegetarian. These recipes were scored using the ACFS formula and the nutrition profiles were analyzed.

RESULTS

Eighty-eight international recipes were analyzed. All S-graded recipes were from vegetarian or Mediterranean categories. The median code values of each category were B (Korean home-dining), C (Korean out-dining), B (Chinese), A (Mediterranean), S (vegetarian), and D (Western). The following profiles were correlated (P < 0.05) with ACFS grades in the univariate trend analysis: total calories, total fat, animal fat, animal protein, total protein, vitamin D, riboflavin, niacin, vitamin B12, pantothenic acid, sodium, animal iron, zinc, selenium, and cholesterol (negative trends), and carbohydrate rate, fiber, water-soluble fiber, vitamin K, vitamin C, and plant calcium (positive trends). Multivariate analysis revealed that animal fat, animal iron, and niacin (negative trends) and animal protein, fiber, and vitamin C (positive trends) were statistically significant. Pantothenic acid and sodium showed non-significant negative trends (P < 0.1), and vitamin B12 showed a non-significant positive trend.

CONCLUSION

This study provided a nutritional basis and extended the utility of ACFS, which is a bridgehead for future cancer-preventive clinical trials using ACFS.

INTRODUCTION

Cancer is a non-communicable disease and is the leading cause of death globally [1]. In the United States, it is the second leading cause of death, following cardiovascular diseases. In Korea and Japan, it is the first leading cause of death [234]. Causes of cancer vary widely and many remain unknown; however, the most significant known causes are smoking and diet [5]. Doll and Peto previously estimated that each of these 2 causes accounted for about one-third of cancer causes [6]. In a recent large prospective study, cancer-specific mortality was found to be reduced to 61% in a population that adhered to the cancer prevention recommendations by the World Cancer Research Fund (WCRF) and the American Institute for Cancer Research (AICR) [7], aligning with the estimates of the research conducted by Doll and Peto.
The method of controlling the risk factor for smoking is simply cessation. However, identifying the foods beneficial for cancer prevention and those that are carcinogenic is more complex. A variety of studies on the relationship between cancer and food, from laboratory to large-scale population studies, have been published [891011]. However, the results of these studies were diverse, and the studies differed from each other in terms of design; moreover, large differences were found according to region and culture. Furthermore, commercial information with inadequate scientific evidence has been widespread and has led to confusion in the general population.
Food is consumed daily by everyone in every socioeconomic class. Obtaining evidence-based information about foods that can prevent cancer among people without nutritional and medical expertise is difficult. Therefore, establishing an intuitive anti-cancer or carcinogenic food index is very useful in promoting cancer-related health.
Based on these needs, we developed the anti-cancer food scoring model (ACFS) 1.0 [12]. The ACFS 1.0 model assigned points to 22 food elements using a systematic method based on literature evaluation. The points were added up based on composition ratios, and unhealthy cooking methods (high salt or oil) were taken into account, to arrive at any of the 6 anti-cancer grades. This model has the advantage of easy-to-understand points and grades, integrating a vast amount of information from the literature.
This study aimed to apply the previously constructed ACFS algorithm to various international recipes, including Mediterranean, vegetarian, Chinese, Western, and Korean diets, and to verify the nutritional validity of the model using a computer-aided nutrition analysis based on the obtained information.

MATERIALS AND METHODS

Calculation model of ACFS

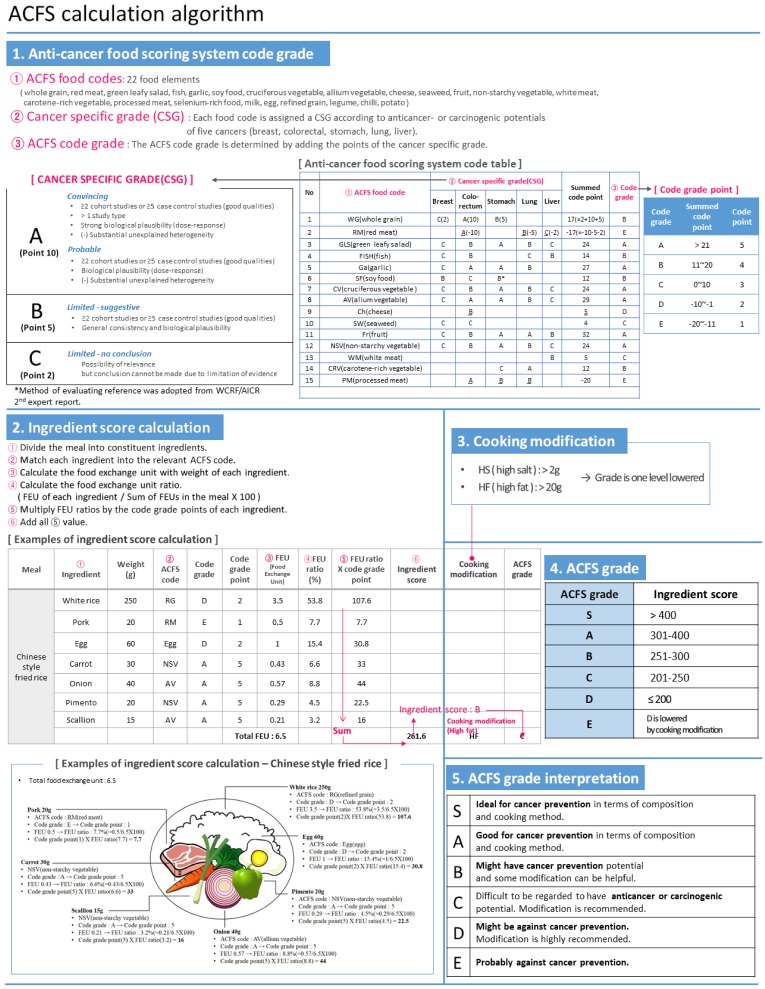
Here, we introduce the calculation model of ACFS briefly, as described in more detail in our previous article [12]. First, we set the 22 ACFS food element codes that are diverse enough to evaluate the majority of Western and Asian recipes. They include whole grain (WG), red meat (RM), green leafy salad (GLS), fish (FISH), garlic (Ga), soy food (SF), cruciferous vegetable (CV), allium vegetable (AV), cheese (Ch), seaweed (SW), fruit (FR), non-starchy vegetable (NSV), white meat (WM), carotene-rich vegetable (CRV), processed meat (PM), selenium-rich food (SRF), milk (Mi), egg (Egg), refined grain (RG), legume (Le), chili (Chili), and potato (Pot).
For each code, studies on 5 major cancers (i.e., breast, colorectal, stomach, lung, and liver) with high global mortality and affected by diets were analyzed. Literature evaluation was based on the 2nd expert report of WCRF/AICR [13]. In the 2nd expert report of WCRF/AICR, the level of evidence was classified into 4 stages (convincing, probable, limited-suggestive, and limited-no conclusion). Level of evidence was determined by the number of cohort or case-control studies, quality of the studies, heterogeneity among the studies, and biological plausibility. In ACFS, code grade A is allotted for convincing or probable, code grade B for limited-suggestive, and code grade C for limited-no conclusion. Then, 10, 5, and 2 points were assigned to code grades A, B and C, respectively. Assigned code points according to each of the 5 cancers, defined as “cancer specific grades”, were summed to yield “ACFS code grades” from A to E.
The meals analyzed were divided into constituent components and matched with the ACFS codes. The “ingredient score” was calculated by multiplying the ratio (using food exchange unit, FEU) of each component in the meal with the code grade point (A, B, C, D, and E correspond to 5,4,3,2,1 points respectively). FEU was used instead of the weight of the ingredient because of its similarity to serving size, which was the more commonly used measurement than weight in reference studies [1250]. FEUs for Korean and Chinese recipes were based on the Korean Diabetes Food Exchange Table. FEUs for Western, vegetarian, and Mediterranean recipes were calculated from the American Dietetic Association Food Exchange Table. The grade level, out of 5 grade levels, was determined from the ingredient scores and the meal was downgraded 1 level if it was cooked using an unhealthy method (> 2 g of salt or > 20 g of oil used in cooking). The final grade was named as the ACFS grade and was interpreted as follows:
  • Grade S, ideal for cancer prevention

  • Grade A, good for cancer prevention

  • Grade B, might have anticancer potential

  • Grade C, difficult to be regarded as preventive or carcinogenic

  • Grade D, might be against cancer prevention

  • Grade E, probably against cancer prevention.

In Table 1, we have presented the process of calculating the ACFS grade of six sample meals, belonging to six dietary patterns. The calculation algorithm is schematically described in Fig. 1.

Selection of recipes and nutritional analyses

For Chinese recipes, we searched for ‘Representative Chinese cuisine’ in the People's Network (kr.people.com.cn) and obtained the ingredient information from the websites (https://www.allrecipes.com/, http://cookingsimplechinesefoodathome.com/, http://www.people.com.cn/, all accessed between August 10 and 17, 2018) for the top 10 meals. For 20 Mediterranean and 10 vegetarian meals, commonly considered as healthy diets, the recipes were obtained from “The New Mayo Clinic Cookbook” [14]. For 18 Western meals, we selected the commonly consumed routine daily life meals and obtained the recipes from the following cooking portals, referring to author discussions (https://www.mrbreakfast.com/, https://www.tasteofhome.com/, https://www.seriouseats.com/, all accessed between August 10 and 17, 2018). Fifteen Korean home-dining and 15 Korean outdining meals were chosen from the frequently consumed meals in the 7th Korea National Health and Nutrition Examination Survey (KNHANES VII-1), 2016, 24-hour dietary recall data. [15]. For the recipes of the Korean meals, we referred to “The guidelines of using the Korean Diabetes Food Exchange Table” [16], CAN-Pro 5.0 (Computer Aided Nutritional Analysis Program; The Korean Nutrition Society, Seoul, Korea), and the recipe list book published by the Institute of Traditional Korean Food [17].
The nutritional value of the meals was analyzed using CAN-Pro 5.0. Food elements that were too exotic or regional to be analyzed using CAN-Pro were substituted with the most similar elements in the CAN-Pro database (e.g., raspberries were substituted by cranberries, cannellini beans by horse beans, and fennel or finocchio by onion). Carbohydrate, lipid, and protein rates denote the contributing proportion in total calories but not the proportion of component weight.

Ethical approval and informed consent

Ethical approval and consent to participate are not applicable as this study did not involve humans or other living organisms. All investigations conformed to the principles outlined in the Declaration of Helsinki.

Statistical analyses

Univariate analyses were performed using the Jonckheere-Terpstra test to identify trends among ACFS grade subgroups. The variables with P values of < 0.05 in the Jonckheere-Terpstra test were included in the multivariate analyses. Among the variables, possibly duplicated variables (e.g., total fat and animal fat, total fiber and water-soluble fiber, calcium and plant calcium) were filtered to be included in the multivariate analysis using the following criteria prioritized in numerical order: 1) the variable with higher statistical significance; 2) the specific variable rather than the general one. Simple nutritional or proportional values including total calories and carbohydrate, lipid, and protein rates contributing to the total calories of meals were not included in the multivariate analysis. Multivariate analyses were performed via multiple regression analyses, using the backward elimination method. The probabilities of removal and entry were 0.10 and 0.05, respectively. Standardized β coefficients and non-standardized β coefficients were presented to identify the comparative significance of each variable. All statistical tests were performed using SPSS version 23.0 (IBM Corp., Armonk, NY, USA).

RESULTS

Nutrition profiles and ACFS scores

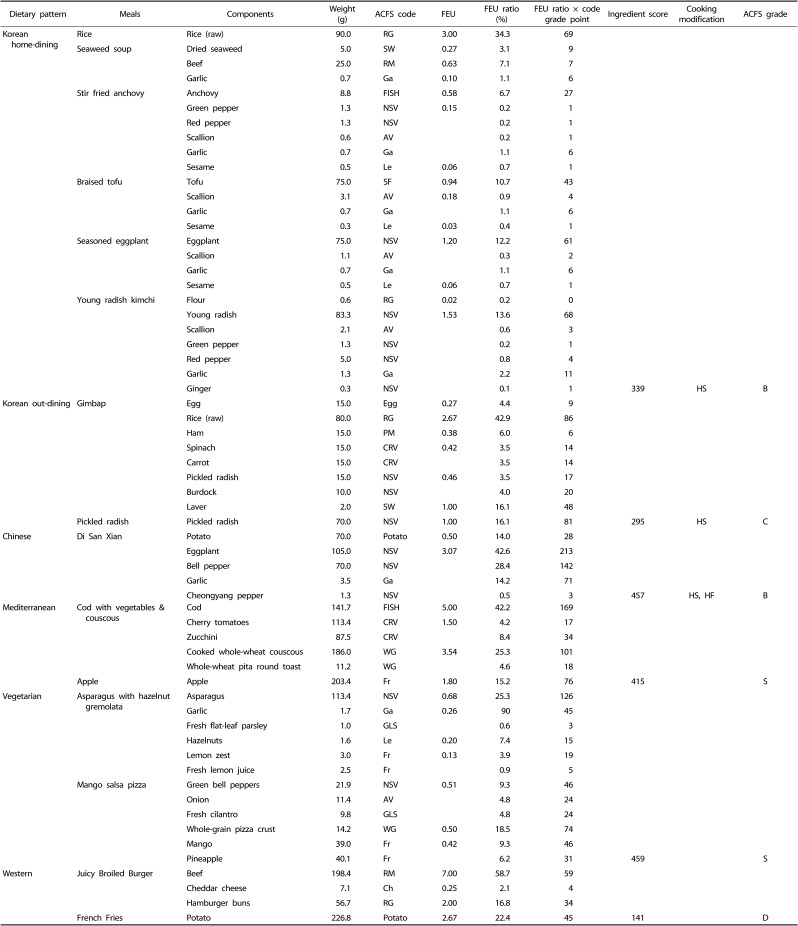
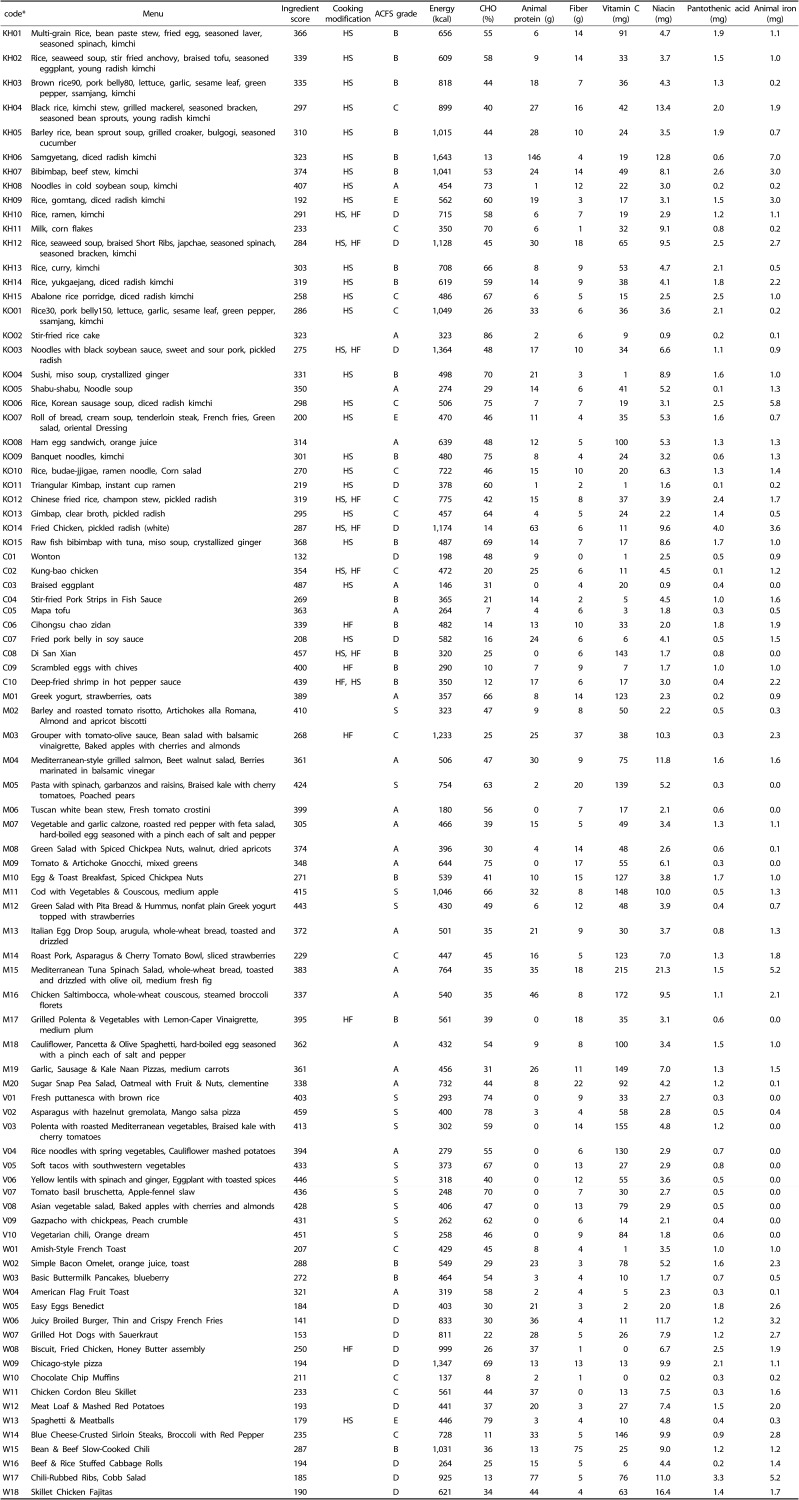
A total of 88 international recipes, including 15 Korean home-dining, 15 Korean out-dining, 10 Chinese, 20 Mediterranean, 10 vegetarian, and 18 Western recipes, were included in this study and analyzed. The number of recipes in the highest anticarcinogenic category (S grade) was 13 (14.8%), followed by 20 in A grade (22.7%), 21 in B grade (23.9%), 15 in C grade (17.0%), 16 in D grade (18.2%), and 3 in E grade (3.4%). All 13 S grade recipes belonged to vegetarian or Mediterranean recipes. The median ACFS grades, derived from ingredient scores after considering the harmful cooking methods, were B, C, B, A, S, and D for Korean home-dining, Korean out-dining, Chinese, Mediterranean, vegetarian, and Western recipes, respectively.
For all the 88 recipes, the ingredient scores ranged from 132 to 487 with a median value of 320 and the energy values ranged from 137 to 1,643 kcal with a median value of 484 kcal. The median ingredient scores of Korean home-dining, Korean out-dining, Chinese, Mediterranean, vegetarian, and Western recipes were 310 (range: 192–407), 298 (200–368), 359 (132–487), 367 (229–443), 432 (394–459), and 201 (141–321), respectively; median energy values in kcal were 708 (350–1643), 498 (274–1364), 335 (146–582), 504 (180–1233), 298 (248–406), and 555 (137–1347), respectively.
The names of the recipes, ingredient scores, ACFS grades, calories, and brief nutritional profiles are presented in Table 2. The full nutritional profile is described in Supplementary file S1.

Nutritional analyses

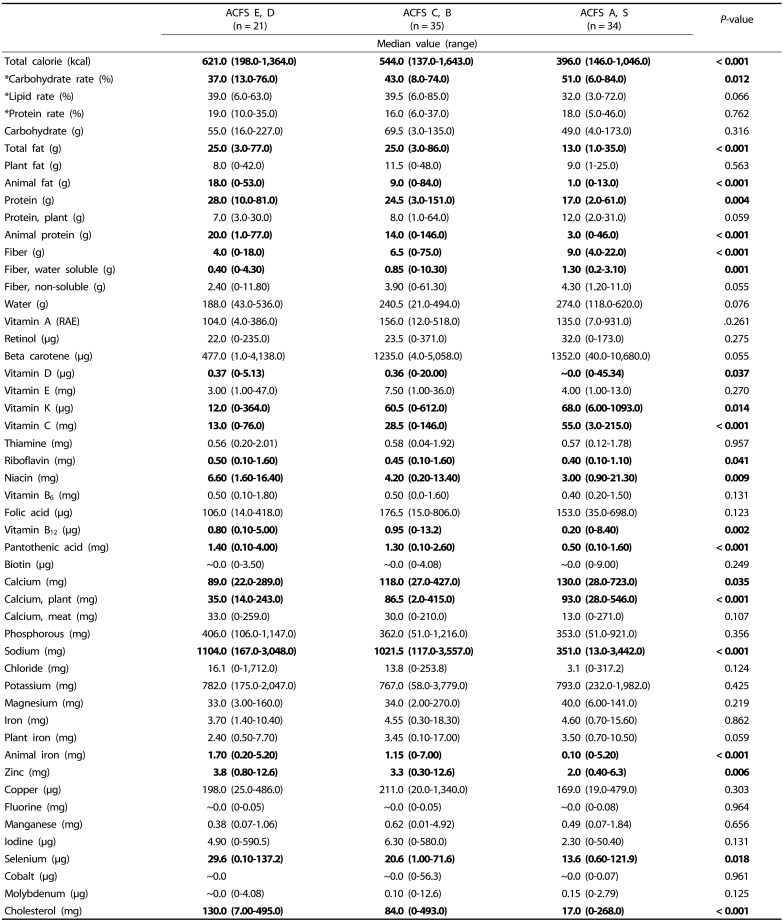
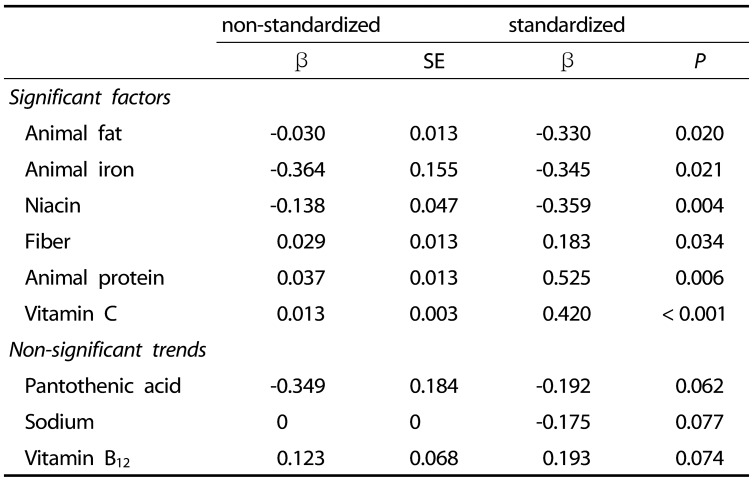
For univariate analysis, we categorized the 6 ACFS grades into 3 groups: S and A; B and C; D and E. In the analysis, the following factors were correlated with the ACFS grade groups (P < 0.05): total calories, total fat, animal fat, animal protein, total protein, vitamin D, riboflavin, niacin, vitamin B12, pantothenic acid, sodium, animal iron, zinc, selenium, and cholesterol (negative trends); carbohydrate rate, fiber, water-soluble fiber, vitamin K, vitamin C, and plant calcium (positive trends). The results of the univariate analysis are summarized in Table 3. Multivariate analysis was performed on factors found to be significant in the univariate analysis. The following variables were included: animal fat, animal protein, vitamin D, riboflavin, niacin, vitamin B12, pantothenic acid, sodium, animal iron, zinc, selenium, cholesterol, fiber, vitamin K, vitamin C, and plant calcium. For multivariate analysis, the 6 ACFS grades and the quantitative amounts of nutrition profiles were used. Six profiles were found to be statistically significant: animal fat (standardized β = −0.330, P = 0.020), animal iron (standardized β = −0.345, P = 0.021), and niacin (standardized β = −0.359, P = 0.004) (negative trends); fiber (standardized β = 0.183, P = 0.034), animal protein (standardized β = 0.525, P = 0.006), and vitamin C (standardized β = 0.420, P < 0.001) (positive trends). Two profiles showed non-significant negative trends (P < 0.1): pantothenic acid (standardized β = −0.192, P = 0.062) and sodium (standardized β = −0.175, P = 0.077). Vitamin B12 showed a non-significant positive trend (standardized β = 0.193, P = 0.074). Each standardized β value represented the relative significance of each variable. These results are summarized in Table 4.

DISCUSSION

The present study demonstrated that the ACFS calculation model was significantly associated with known healthy and unhealthy nutritional factors. Univariate analysis showed that the ACFS model was strongly negatively correlated with factors such as animal fat (P < 0.001), sodium (P < 0.001), and cholesterol (P < 0.001), which are generally considered to be harmful to health, and strongly positively correlated with factors such as fiber (P < 0.001), vitamin C (P < 0.001), and plant calcium (P < 0.002), which are considered beneficial.
Multivariate analysis showed that the ACFS model is negatively correlated with animal fat, animal iron, and niacin and positively correlated with fiber, vitamin C, and animal protein (Ps < 0.05). Pantothenic acid and sodium had non-significant negative trends, while vitamin B12 showed a positive trend (Ps < 0.1).
In the recently updated WCRF and AICR third expert report, red meat consumption showed strong evidence of increased risk of colorectal cancer and limited evidence of increased risks of nasopharyngeal, lung, and pancreatic cancers [18]. The most well-known causes of cancer related to red meat consumption are heterocyclic amines and polycyclic aromatic hydrocarbons, which are carcinogens that are produced on high-temperature cooking [19]. Besides, saturated fat itself has been known to be related to the risk of cancers, including breast, lung, and colorectal cancers [202122]. This evidence aligns with our study results concerning animal fat. The iron components in animal products were found to be associated with the ACFS grade in our study. Heme iron, which is abundant in red meat, was known to be related to tumorigenesis by stimulating the endogenous formation of N-nitroso compounds [19]. Body iron stores, which were assessed by serum iron and transferrin saturation of total iron-binding capacity, were reported to increase the incidence of cancer in large population studies [2324], although these results need to be verified by studies with more nutritional perspectives.
Animal protein was found to have a positive relationship with the ACFS grade in multivariate analysis, which reflects its anticarcinogenic potential. Interestingly, animal protein showed a negative trend in the univariate analysis but reversed to have a positive trend in the multivariate analysis. We hypothesized that animal protein from poultry and fish might affect these results and the carcinogenic effect of meat might be more related to other components such as fat or iron, although further studies are warranted. Poultry intake was reported to be inversely associated with colorectal cancer risk in a recent meta-analysis, with a risk ratio (RR) of 0.89 (95% confidence interval [CI], 0.81–0.97) for a 50 g/day increase uptake of poultry [25]. A meta-analysis study reported an inverse relationship between poultry intake and lung cancer (RR 0.91, 95% CI: 0.85–0.97) [26], and a population-based case control study showed a similar relationship between pancreatic cancer and poultry intake (odds ratio: 0.7, 95% CI: 0.5–1.0) [27]. Fish intake was reported to have limited-suggestive evidence of decreasing the risk of liver and colorectal cancers in the third expert report of the WCRF and the AICR [18]. In a meta-analysis, the pooled RR of the highest fish intake category compared to the lowest fish intake category was 0.88 (95% CI: 0.78–1.00) for colorectal cancer incidence [28]. For liver cancer, the pooled RR for the highest fish intake quartile was 0.82 (95% CI: 0.71–0.94), as per a recent meta-analysis study [29]. Unfortunately, we cannot fully explain the results of the meta-analyses with regard to the mechanisms, as the mechanisms are not fully understood yet and are masked by confounding factors [2530]. We hope that future studies investigating the cancer protective mechanisms of poultry and fish can explain these results and show a correlation with ACFS.
Foods containing dietary fiber had strong protective evidence for colorectal cancer in the third expert report of the WCRF and the AICR [31]. In humans, fibers can be fermented and metabolized by the colonic microflora, forming short-chain fatty acids, such as butyrate, which have an anti-proliferative effect on colon cancer. Additionally, fibers can reduce the transit time of fecal bulk and lessen the interaction between fecal mutagens and colonic mucosa [3233]. Dietary fiber was also associated with decreased risk of breast cancer in a meta-analysis, with an RR of 0.95 per 10 g/day intake [34]. The European Prospective Investigation into Cancer and Nutrition study, which included a prospective cohort of > 500,000, reported that colorectal, breast, and liver cancers were inversely associated with dietary fiber intake [35]. Vitamin C has been known to prevent cancer and proven to have a protective effect on esophageal, laryngeal, oral cavity, pancreatic, stomach, rectal, breast, and cervical cancers, which are strongly consistent with the results of the previous meta-analyses [3637]. It was also reported to have limited -suggestive evidence of decreasing the risks of colorectal and lung cancers in the third expert report of the WCRF and the AICR [31].
The relationship between niacin intake and cancer risk is largely unexplored. Although there is some in vivo evidence that niacin status influences carcinogenesis in a tissue-specific manner, evidence from human studies is lacking [38]. In a recent clinical study, niacin intake was inversely associated with squamous cell carcinoma of the skin but showed a positive relationship with basal cell carcinoma of the skin [39]. Since ACFS is based on meal recipes (not nutritional components), correlation with niacin, which is abundant both in plant foods (e.g., peas and barley have high ACFS score) and red meats (low ACFS scores), might not be robust. Future clinical studies evaluating the anti-cancer or carcinogenic effects of niacin are necessary.
Among the factors with non-significant trends, vitamin B12 was shown to have an inverse relationship with cancer risk in recent studies. A dose-response relationship between dietary intake of vitamin B12 and decreased risk of colorectal cancer was shown in a recent meta-analysis (pooled RR: 091, 95% CI: 0.86–0.98) [40]. A recent case-control study revealed that low vitamin B12 concentration was associated with a 5.8-fold higher risk of non-cardia gastric cancer [41]. Another study also found a significant association between low levels of plasma vitamin B12 and hepatocellular carcinoma risk (odds ratio: 2.01, 95% CI: 1.02–3.98) [42]. Sodium was also negatively associated with the ACFS grade with non-significant trends. The positive association between sodium and cancer is most well-known for gastric cancer [43], and the third expert report by the WCRF and the AICR also reported strong evidence between Cantonese-style salted fish and nasopharyngeal cancer [44]. Although relevant effects of pantothenic acid have not been extensively studied in the literature, Hutschenreuther et al. [45] reported that the aggressiveness of tumor cells might be related to pantothenic acid in a cell-line study. This component should be investigated in future to explain our results.
It has long been necessary to categorize and quantify factors that can prevent or increase the risk of cancer. The International Agency for Research on Cancer systematically classifies substances that may or may not be carcinogenic [46]. The expert reports of the WCRF and the AICR, probably the most comprehensive review regarding cancer prevention, diet, and lifestyle, have proved their clinical efficacy in recent prospective trials [7]. Our ACFS model systematically analyzed the literature regarding diet and cancer prevention, based on the classification system from the WCRF and AICR [47], and enabled quantitative anti-cancer scoring of a wide-range of everyday meals. Consequently, our model allows everyone without medical or nutritional expertise to obtain an evidence-based anti-cancer or carcinogenic score of their meals.
Although several models have already been published to assess the health index of food, our model is unique because of the following reasons. Scoring methods such as aggregate nutrient density index (ANDI) [48] and NuVal® [49], which are developed in the US and commonly used, are composed of assessments focusing on overall health, while the ACFS focuses on cancer prevention or carcinogenicity. Additionally, the ACFS evaluates complete meals actually consumed in daily life, while the ANDI and NuVal evaluate food components. Healthy Eating Index (HEI) [50] and Dietary Quality Index (DQI) [51] are tools for evaluating meals rather than individual food components. However, these tools do not focus on cancer but on overall health or known nutritional expertise. Hence, the ACFS model is unique in evaluating daily meals, yielding indexes focused on cancer prevention and carcinogenicity.
The purpose of the present study was to provide a nutritional basis for the efficacy of the ACFS calculation model. Although ACFS was based on a comprehensive systematic review, there is a lack of substantive evidence to demonstrate its efficacy. This study could facilitate the design of research demonstrating the clinical utility of ACFS. Although we included 88 recipes from 6 international categories, probably the number of samples should be further increased. Representing each diet category with 10–20 recipes also has limitations. We performed fairly objective selections of representative foods for Asian recipes, but we were forced to rely mainly on the author's discussion in the corresponding websites for the selection of Western meals. Along with the clinical study design, to enhancement of nutritional reliability using larger validation with more number of international recipes will be the subject of our future studies.
We have shown that the ACFS grade generally corresponds with commonly known anti-cancer or carcinogenic factors. Although the effect of some factors needs to be elucidated through additional studies, the ACFS grade has been well correlated with factors such as fiber, vitamin C, vitamin B12, sodium, animal fat, and iron. Hence, our calculation model could be named ACFS 2.0, reflecting the newly drawn reliability of this study. Future clinical studies along with wider validation are warranted to firmly prove the utility of the model.

Notes

This study is supported by the National Research Fund of Korea (NRF-2018R1D1A1B07046998).

CONFLICT OF INTEREST: The author declares no potential conflicts of interests.

References

1. GBD 2015 Mortality and Causes of Death Collaborators. Global, regional, and national life expectancy, all-cause mortality, and cause-specific mortality for 249 causes of death, 1980–2015: a systematic analysis for the global burden of disease study 2015. Lancet. 2016; 388:1459–1544. PMID: 27733281.
2. National Cancer Information Center. Title [Internet]. Goyang: National Cancer Information Center;year. cited 2019 February 1. Available from: https://www.cancer.go.kr/lay1/S1T645C646/contents.do.
3. National Center for Health Statistics. Health, United States, 2016: With Chartbook on Long-Term Trends in Health. Hyattsville (MD): National Center for Health Statistics;2017.
4. Nagao M, Tsugane S. Cancer in Japan: prevalence, prevention and the role of heterocyclic amines in human carcinogenesis. Genes Environ. 2016; 38:16. PMID: 27375796.
crossref
5. Anand P, Kunnumakkara AB, Sundaram C, Harikumar KB, Tharakan ST, Lai OS, Sung B, Aggarwal BB. Cancer is a preventable disease that requires major lifestyle changes. Pharm Res. 2008; 25:2097–2116. PMID: 18626751.
crossref
6. Doll R, Peto R. The causes of cancer: quantitative estimates of avoidable risks of cancer in the United States today. J Natl Cancer Inst. 1981; 66:1191–1308. PMID: 7017215.
crossref
7. Hastert TA, Beresford SA, Sheppard L, White E. Adherence to the WCRF/AICR cancer prevention recommendations and cancer-specific mortality: results from the vitamins and lifestyle (VITAL) study. Cancer Causes Control. 2014; 25:541–552. PMID: 24557428.
crossref
8. McCann SE, Marshall JR, Brasure JR, Graham S, Freudenheim JL. Analysis of patterns of food intake in nutritional epidemiology: food classification in principal components analysis and the subsequent impact on estimates for endometrial cancer. Public Health Nutr. 2001; 4:989–997. PMID: 11784412.
crossref
9. Kerr J, Anderson C, Lippman SM. Physical activity, sedentary behaviour, diet, and cancer: an update and emerging new evidence. Lancet Oncol. 2017; 18:e457–e471. PMID: 28759385.
crossref
10. Schulze MB, Hoffmann K, Kroke A, Boeing H. Dietary patterns and their association with food and nutrient intake in the European prospective investigation into cancer and nutrition (EPIC)-Potsdam study. Br J Nutr. 2001; 85:363–373. PMID: 11299082.
crossref
11. Navarro Silvera SA, Mayne ST, Risch H, Gammon MD, Vaughan TL, Chow WH, Dubrow R, Schoenberg JB, Stanford JL, West AB, Rotterdam H, Blot WJ, Fraumeni JF Jr. Food group intake and risk of subtypes of esophageal and gastric cancer. Int J Cancer. 2008; 123:852–860. PMID: 18537156.
crossref
12. Rim CH. Development of quantitative index evaluating anticancer or carcinogenic potential of diet: the anti-cancer food scoring system 1.0. Nutr Res Pract. 2018; 12:52–60. PMID: 29399297.
crossref
13. World Cancer Research Fund/American Institute for Cancer Research. Food, Nutrition, Physical Activity, and the Prevention of Cancer: a Global Perspective. Washington, D.C.: American Institute for Cancer Research;2007.
14. Hensrud D, Nelson J, Forberg C, Callahan M, Giblin S. The New Mayo Clinic Cookbook: Eating Well for Better Health. Menlo Park (CA): Oxmoor House;2012.
15. Kweon S, Kim Y, Jang MJ, Kim Y, Kim K, Choi S, Chun C, Khang YH, Oh K. Data resource profile: the Korea national health and nutrition examination survey (KNHANES). Int J Epidemiol. 2014; 43:69–77. PMID: 24585853.
crossref
16. Korean Diabetes Association. Korean food exchange list [Internet]. Seoul: Korean Diabetes Association;2010. cited 2018 August 10. Available from: http://www.diabetes.or.kr/english/resource/index.php?category=3.
17. Institute of Traditional Korean Food. Beautiful Korean Recipes 300 Selections. Seoul: Hallym Publishing;2008.
18. World Cancer Research Fund International. Meat, Fish, and Dairy Products and the Risk of Cancer. London: World Cancer Research Fund International;2018.
19. Cross AJ, Sinha R. Meat-related mutagens/carcinogens in the etiology of colorectal cancer. Environ Mol Mutagen. 2004; 44:44–55. PMID: 15199546.
crossref
20. Alavanja MC, Brown CC, Swanson C, Brownson RC. Saturated fat intake and lung cancer risk among nonsmoking women in Missouri. J Natl Cancer Inst. 1993; 85:1906–1916. PMID: 8230280.
crossref
21. Sieri S, Krogh V, Ferrari P, Berrino F, Pala V, Thiébaut AC, Tjønneland A, Olsen A, Overvad K, Jakobsen MU, Clavel-Chapelon F, Chajes V, Boutron-Ruault MC, Kaaks R, Linseisen J, Boeing H, Nöthlings U, Trichopoulou A, Naska A, Lagiou P, Panico S, Palli D, Vineis P, Tumino R, Lund E, Kumle M, Skeie G, González CA, Ardanaz E, Amiano P, Tormo MJ, Martínez-García C, Quirós JR, Berglund G, Gullberg B, Hallmans G, Lenner P, Bueno-de-Mesquita HB, van Duijnhoven FJ, Peeters PH, van Gils CH, Key TJ, Crowe FL, Bingham S, Khaw KT, Rinaldi S, Slimani N, Jenab M, Norat T, Riboli E. Dietary fat and breast cancer risk in the European prospective investigation into cancer and nutrition. Am J Clin Nutr. 2008; 88:1304–1312. PMID: 18996867.
22. Reddy BS. Types and amount of dietary fat and colon cancer risk: Prevention by omega-3 fatty acid-rich diets. Environ Health Prev Med. 2002; 7:95–102. PMID: 21432290.
crossref
23. van Asperen IA, Feskens EJ, Bowles CH, Kromhout D. Body iron stores and mortality due to cancer and ischaemic heart disease: a 17-year follow-up study of elderly men and women. Int J Epidemiol. 1995; 24:665–670. PMID: 8550261.
crossref
24. Knekt P, Reunanen A, Takkunen H, Aromaa A, Heliövaara M, Hakulinen T. Body iron stores and risk of cancer. Int J Cancer. 1994; 56:379–382. PMID: 8314326.
crossref
25. Shi Y, Yu PW, Zeng DZ. Dose-response meta-analysis of poultry intake and colorectal cancer incidence and mortality. Eur J Nutr. 2015; 54:243–250. PMID: 24788671.
crossref
26. Yang WS, Wong MY, Vogtmann E, Tang RQ, Xie L, Yang YS, Wu QJ, Zhang W, Xiang YB. Meat consumption and risk of lung cancer: evidence from observational studies. Ann Oncol. 2012; 23:3163–3170. PMID: 22855553.
crossref
27. Chan JM, Wang F, Holly EA. Pancreatic cancer, animal protein and dietary fat in a population-based study, San Francisco Bay Area, California. Cancer Causes Control. 2007; 18:1153–1167. PMID: 17805983.
crossref
28. Geelen A, Schouten JM, Kamphuis C, Stam BE, Burema J, Renkema JM, Bakker EJ, van't Veer P, Kampman E. Fish consumption, n-3 fatty acids, and colorectal cancer: a meta-analysis of prospective cohort studies. Am J Epidemiol. 2007; 166:1116–1125. PMID: 17823383.
crossref
29. Huang RX, Duan YY, Hu JA. Fish intake and risk of liver cancer: a meta-analysis. PLoS One. 2015; 10:e0096102. PMID: 25615823.
crossref
30. Huang XE, Hirose K, Wakai K, Matsuo K, Ito H, Xiang J, Takezaki T, Tajima K. Comparison of lifestyle risk factors by family history for gastric, breast, lung and colorectal cancer. Asian Pac J Cancer Prev. 2004; 5:419–427. PMID: 15546249.
31. World Cancer Research Fund International. Wholegrains, Vegetables and Fruit and the Risk of Cancer. London: World Cancer Research Fund International;2018.
32. Slavin JL. Mechanisms for the impact of whole grain foods on cancer risk. J Am Coll Nutr. 2000; 19:300S–307S. PMID: 10875601.
crossref
33. Bingham SA. Mechanisms and experimental and epidemiological evidence relating dietary fibre (non-starch polysaccharides) and starch to protection against large bowel cancer. Proc Nutr Soc. 1990; 49:153–171. PMID: 2172992.
crossref
34. Aune D, Chan DS, Greenwood DC, Vieira AR, Rosenblatt DA, Vieira R, Norat T. Dietary fiber and breast cancer risk: a systematic review and meta-analysis of prospective studies. Ann Oncol. 2012; 23:1394–1402. PMID: 22234738.
crossref
35. Bradbury KE, Appleby PN, Key TJ. Fruit, vegetable, and fiber intake in relation to cancer risk: findings from the European prospective investigation into cancer and nutrition (EPIC). Am J Clin Nutr. 2014; 100 Suppl 1:394S–398S. PMID: 24920034.
crossref
36. Block G. Vitamin C and cancer prevention: the epidemiologic evidence. Am J Clin Nutr. 1991; 53:270S–282S. PMID: 1985398.
crossref
37. Byers T, Guerrero N. Epidemiologic evidence for vitamin C and vitamin E in cancer prevention. Am J Clin Nutr. 1995; 62:1385S–1392S. PMID: 7495236.
crossref
38. Kirkland JB. Niacin and carcinogenesis. Nutr Cancer. 2003; 46:110–118. PMID: 14690785.
crossref
39. Park SM, Li T, Wu S, Li WQ, Weinstock M, Qureshi AA, Cho E. Niacin intake and risk of skin cancer in US women and men. Int J Cancer. 2017; 140:2023–2031. PMID: 28152570.
crossref
40. Sun NH, Huang XZ, Wang SB, Li Y, Wang LY, Wang HC, Zhang CW, Zhang C, Liu HP, Wang ZN. A dose-response meta-analysis reveals an association between vitamin B12 and colorectal cancer risk. Public Health Nutr. 2016; 19:1446–1456. PMID: 26373257.
crossref
41. Miranti EH, Stolzenberg-Solomon R, Weinstein SJ, Selhub J, Männistö S, Taylor PR, Freedman ND, Albanes D, Abnet CC, Murphy G. Low vitamin B12 increases risk of gastric cancer: a prospective study of one-carbon metabolism nutrients and risk of upper gastrointestinal tract cancer. Int J Cancer. 2017; 141:1120–1129. PMID: 28568053.
42. Cui LH, Quan ZY, Piao JM, Zhang TT, Jiang MH, Shin MH, Choi JS. Plasma folate and vitamin B12 levels in patients with hepatocellular carcinoma. Int J Mol Sci. 2016; 17:E1032. PMID: 27376276.
crossref
43. D'Elia L, Galletti F, Strazzullo P. Dietary salt intake and risk of gastric cancer. Cancer Treat Res. 2014; 159:83–95. PMID: 24114476.
44. World Cancer Research Fund International. Preservation and Processing of Foods and the Risk of Cancer. London: World Cancer Research Fund International;2018.
45. Hutschenreuther A, Birkenmeier G, Bigl M, Krohn K, Birkemeyer C. Glycerophosphoglycerol, beta-alanine, and pantothenic acid as metabolic companions of glycolytic activity and cell migration in breast cancer cell lines. Metabolites. 2013; 3:1084–1101. PMID: 24958267.
crossref
46. International Agency for Research on Cancer. Agents classified by the IARC monographs, vol 1-100 [Internet]. Lyon: International Agency for Research on Cancer;year. cited 2019 May 1. Available from: https://monographs.iarc.fr/wp-content/uploads/2018/09/ClassificationsAlphaOrder.pdf.
47. World Cancer Research Fund International. Judging the Evidence. London: World Cancer Research Fund International;2018.
48. JH FuhrmanK Leville. Whole Foods Market, Inc.Methods for developing and conducting a nutritional treatment program. United States patent. US 20080177572A1. 2008. 7. 24.
49. Katz DL, Njike VY, Rhee LQ, Reingold A, Ayoob KT. Performance characteristics of NuVal and the overall nutritional quality index (ONQI). Am J Clin Nutr. 2010; 91:1102S–1108S. PMID: 20181809.
crossref
50. Guenther PM, Casavale KO, Reedy J, Kirkpatrick SI, Hiza HA, Kuczynski KJ, Kahle LL, Krebs-Smith SM. Update of the healthy eating index: HEI-2010. J Acad Nutr Diet. 2013; 113:569–580. PMID: 23415502.
crossref
51. Kim S, Haines PS, Siega-Riz AM, Popkin BM. The diet quality index-International (DQI-I) provides an effective tool for cross-national comparison of diet quality as illustrated by China and the United States. J Nutr. 2003; 133:3476–3484. PMID: 14608061.
crossref

SUPPLEMENTARY MATERIAL

Supplementary file S1

nrp-14-32-s001.xlsx
Fig. 1

Calculation algorithm of anti-cancer food scoring system (ACFS)

nrp-14-32-g001
Table 1

Examples of ACFS grade calculation.

nrp-14-32-i001
Dietary pattern Meals Components Weight (g) ACFS code FEU FEU ratio (%) FEU ratio × code grade point Ingredient score Cookingmodification ACFS grade
Korean home-dining Rice Rice (raw) 90.0 RG 3.00 34.3 69
Seaweed soup Dried seaweed 5.0 SW 0.27 3.1 9
Beef 25.0 RM 0.63 7.1 7
Garlic 0.7 Ga 0.10 1.1 6
Stir fried anchovy Anchovy 8.8 FISH 0.58 6.7 27
Green pepper 1.3 NSV 0.15 0.2 1
Red pepper 1.3 NSV 0.2 1
Scallion 0.6 AV 0.2 1
Garlic 0.7 Ga 1.1 6
Sesame 0.5 Le 0.06 0.7 1
Braised tofu Tofu 75.0 SF 0.94 10.7 43
Scallion 3.1 AV 0.18 0.9 4
Garlic 0.7 Ga 1.1 6
Sesame 0.3 Le 0.03 0.4 1
Seasoned eggplant Eggplant 75.0 NSV 1.20 12.2 61
Scallion 1.1 AV 0.3 2
Garlic 0.7 Ga 1.1 6
Sesame 0.5 Le 0.06 0.7 1
Young radish kimchi Flour 0.6 RG 0.02 0.2 0
Young radish 83.3 NSV 1.53 13.6 68
Scallion 2.1 AV 0.6 3
Green pepper 1.3 NSV 0.2 1
Red pepper 5.0 NSV 0.8 4
Garlic 1.3 Ga 2.2 11
Ginger 0.3 NSV 0.1 1 339 HS B
Korean out-dining Gimbap Egg 15.0 Egg 0.27 4.4 9
Rice (raw) 80.0 RG 2.67 42.9 86
Ham 15.0 PM 0.38 6.0 6
Spinach 15.0 CRV 0.42 3.5 14
Carrot 15.0 CRV 3.5 14
Pickled radish 15.0 NSV 0.46 3.5 17
Burdock 10.0 NSV 4.0 20
Laver 2.0 SW 1.00 16.1 48
Pickled radish Pickled radish 70.0 NSV 1.00 16.1 81 295 HS C
Chinese Di San Xian Potato 70.0 Potato 0.50 14.0 28
Eggplant 105.0 NSV 3.07 42.6 213
Bell pepper 70.0 NSV 28.4 142
Garlic 3.5 Ga 14.2 71
Cheongyang pepper 1.3 NSV 0.5 3 457 HS, HF B
Mediterranean Cod with vegetables & couscous Cod 141.7 FISH 5.00 42.2 169
Cherry tomatoes 113.4 CRV 1.50 4.2 17
Zucchini 87.5 CRV 8.4 34
Cooked whole-wheat couscous 186.0 WG 3.54 25.3 101
Whole-wheat pita round toast 11.2 WG 4.6 18
Apple Apple 203.4 Fr 1.80 15.2 76 415 S
Vegetarian Asparagus with hazelnut gremolata Asparagus 113.4 NSV 0.68 25.3 126
Garlic 1.7 Ga 0.26 90 45
Fresh flat-leaf parsley 1.0 GLS 0.6 3
Hazelnuts 1.6 Le 0.20 7.4 15
Lemon zest 3.0 Fr 0.13 3.9 19
Fresh lemon juice 2.5 Fr 0.9 5
Mango salsa pizza Green bell peppers 21.9 NSV 0.51 9.3 46
Onion 11.4 AV 4.8 24
Fresh cilantro 9.8 GLS 4.8 24
Whole-grain pizza crust 14.2 WG 0.50 18.5 74
Mango 39.0 Fr 0.42 9.3 46
Pineapple 40.1 Fr 6.2 31 459 S
Western Juicy Broiled Burger Beef 198.4 RM 7.00 58.7 59
Cheddar cheese 7.1 Ch 0.25 2.1 4
Hamburger buns 56.7 RG 2.00 16.8 34
French Fries Potato 226.8 Potato 2.67 22.4 45 141 D

ACFS, anti-cancer food scoring system; FEU, food exchange unit; RG, refined grain; SW, seaweed; RM, red meat; Ga, garlic; FISH, fish; NSV, non-starchy vegetable; AV, allium vegetable; LE, legume; SF, soy food; EGG, egg; PM, processed meat; CRV, carotene-rich vegetable; Potato, potato; WG, whole grain; Fr, fruit; GLS, green leafy salad; Ch, cheese; HS, high-salt cooking; HF, high-fat cooking. If > 20 g of oil or > 2 g of sodium was used for cooking, it was regarded as harmful cooking and the grade was lowered one level.

ACFS grade S, ideal for cancer prevention; A, good for cancer prevention; B, might have anticancer potential; C, difficult to be regarded as preventive or carcinogenic; D, might be against cancer prevention; E, probably against cancer prevention.

Table 2

Nutrition profiles and ACFS scores of 88 international recipes.

nrp-14-32-i002
code* Menu Ingredient score Cooking modification ACFS grade Energy (kcal) CHO (%) Animal protein (g) Fiber (g) Vitamin C (mg) Niacin (mg) Pantothenic acid (mg) Animal iron (mg)
KH01 Multi-grain Rice, bean paste stew, fried egg, seasoned laver, seasoned spinach, kimchi 366 HS B 656 55 6 14 91 4.7 1.9 1.1
KH02 Rice, seaweed soup, stir fried anchovy, braised tofu, seasoned eggplant, young radish kimchi 339 HS B 609 58 9 14 33 3.7 1.5 1.0
KH03 Brown rice90, pork belly80, lettuce, garlic, sesame leaf, green pepper, ssamjang, kimchi 335 HS B 818 44 18 7 36 4.3 1.3 0.2
KH04 Black rice, kimchi stew, grilled mackerel, seasoned bracken, seasoned bean sprouts, young radish kimchi 297 HS C 899 40 27 16 42 13.4 2.0 1.9
KH05 Barley rice, bean sprout soup, grilled croaker, bulgogi, seasoned cucumber 310 HS B 1,015 44 28 10 24 3.5 1.9 0.7
KH06 Samgyetang, diced radish kimchi 323 HS B 1,643 13 146 4 19 12.8 0.6 7.0
KH07 Bibimbap, beef stew, kimchi 374 HS B 1,041 53 24 14 49 8.1 2.6 3.0
KH08 Noodles in cold soybean soup, kimchi 407 HS A 454 73 1 12 22 3.0 0.2 0.2
KH09 Rice, gomtang, diced radish kimchi 192 HS E 562 60 19 3 17 3.1 1.5 3.0
KH10 Rice, ramen, kimchi 291 HS, HF D 715 58 6 7 19 2.9 1.2 1.1
KH11 Milk, corn flakes 233 C 350 70 6 1 32 9.1 0.8 0.2
KH12 Rice, seaweed soup, braised Short Ribs, japchae, seasoned spinach, seasoned bracken, kimchi 284 HS, HF D 1,128 45 30 18 65 9.5 2.5 2.7
KH13 Rice, curry, kimchi 303 HS B 708 66 8 9 53 4.7 2.1 0.5
KH14 Rice, yukgaejang, diced radish kimchi 319 HS B 619 59 14 9 38 4.1 1.8 2.2
KH15 Abalone rice porridge, diced radish kimchi 258 HS C 486 67 6 5 15 2.5 2.5 1.0
KO01 Rice30, pork belly150, lettuce, garlic, sesame leaf, green pepper, ssamjang, kimchi 286 HS C 1,049 26 33 6 36 3.6 2.1 0.2
KO02 Stir-fried rice cake 323 A 323 86 2 6 9 0.9 0.2 0.1
KO03 Noodles with black soybean sauce, sweet and sour pork, pickled radish 275 HS, HF D 1,364 48 17 10 34 6.6 1.1 0.9
KO04 Sushi, miso soup, crystallized ginger 331 HS B 498 70 21 3 1 8.9 1.6 1.0
KO05 Shabu-shabu, Noodle soup 350 A 274 29 14 6 41 5.2 0.1 1.3
KO06 Rice, Korean sausage soup, diced radish kimchi 298 HS C 506 75 7 7 19 3.1 2.5 5.8
KO07 Roll of bread, cream soup, tenderloin steak, French fries, Green salad, oriental Dressing 200 HS E 470 46 11 4 35 5.3 1.6 0.7
KO08 Ham egg sandwich, orange juice 314 A 639 48 12 5 100 5.3 1.3 1.3
KO09 Banquet noodles, kimchi 301 HS B 480 75 8 4 24 3.2 0.6 1.3
KO10 Rice, budae-jjigae, ramen noodle, Corn salad 270 HS C 722 46 15 10 20 6.3 1.3 1.4
KO11 Triangular Kimbap, instant cup ramen 219 HS D 378 60 1 2 1 1.6 0.1 0.2
KO12 Chinese fried rice, champon stew, pickled radish 319 HS, HF C 775 42 15 8 37 3.9 2.4 1.7
KO13 Gimbap, clear broth, pickled radish 295 HS C 457 64 4 5 24 2.2 1.4 0.5
KO14 Fried Chicken, pickled radish (white) 287 HS, HF D 1,174 14 63 6 11 9.6 4.0 3.6
KO15 Raw fish bibimbap with tuna, miso soup, crystallized ginger 368 HS B 487 69 14 7 17 8.6 1.7 1.0
C01 Wonton 132 D 198 48 9 0 1 2.5 0.5 0.9
C02 Kung-bao chicken 354 HS, HF C 472 20 25 6 11 4.5 0.1 1.2
C03 Braised eggplant 487 HS A 146 31 0 4 20 0.9 0.4 0.0
C04 Stir-fried Pork Strips in Fish Sauce 269 B 365 21 14 2 5 4.5 1.0 1.6
C05 Mapa tofu 363 A 264 7 4 6 3 1.8 0.3 0.5
C06 Cihongsu chao zidan 339 HF B 482 14 13 10 33 2.0 1.8 1.9
C07 Fried pork belly in soy sauce 208 HS D 582 16 24 6 6 4.1 0.5 1.5
C08 Di San Xian 457 HS, HF B 320 25 0 6 143 1.7 0.8 0.0
C09 Scrambled eggs with chives 400 HF B 290 10 7 9 7 1.7 1.0 1.0
C10 Deep-fried shrimp in hot pepper sauce 439 HF, HS B 350 12 17 6 17 3.0 0.4 2.2
M01 Greek yogurt, strawberries, oats 389 A 357 66 8 14 123 2.3 0.2 0.9
M02 Barley and roasted tomato risotto, Artichokes alla Romana, Almond and apricot biscotti 410 S 323 47 9 8 50 2.2 0.5 0.3
M03 Grouper with tomato-olive sauce, Bean salad with balsamic vinaigrette, Baked apples with cherries and almonds 268 HF C 1,233 25 25 37 38 10.3 0.3 2.3
M04 Mediterranean-style grilled salmon, Beet walnut salad, Berries marinated in balsamic vinegar 361 A 506 47 30 9 75 11.8 1.6 1.6
M05 Pasta with spinach, garbanzos and raisins, Braised kale with cherry tomatoes, Poached pears 424 S 754 63 2 20 139 5.2 0.3 0.0
M06 Tuscan white bean stew, Fresh tomato crostini 399 A 180 56 0 7 17 2.1 0.6 0.0
M07 Vegetable and garlic calzone, roasted red pepper with feta salad, hard-boiled egg seasoned with a pinch each of salt and pepper 305 A 466 39 15 5 49 3.4 1.3 1.1
M08 Green Salad with Spiced Chickpea Nuts, walnut, dried apricots 374 A 396 30 4 14 48 2.6 0.6 0.1
M09 Tomato & Artichoke Gnocchi, mixed greens 348 A 644 75 0 17 55 6.1 0.3 0.0
M10 Egg & Toast Breakfast, Spiced Chickpea Nuts 271 B 539 41 10 15 127 3.8 1.7 1.0
M11 Cod with Vegetables & Couscous, medium apple 415 S 1,046 66 32 8 148 10.0 0.5 1.3
M12 Green Salad with Pita Bread & Hummus, nonfat plain Greek yogurt topped with strawberries 443 S 430 49 6 12 48 3.9 0.4 0.7
M13 Italian Egg Drop Soup, arugula, whole-wheat bread, toasted and drizzled 372 A 501 35 21 9 30 3.7 0.8 1.3
M14 Roast Pork, Asparagus & Cherry Tomato Bowl, sliced strawberries 229 C 447 45 16 5 123 7.0 1.3 1.8
M15 Mediterranean Tuna Spinach Salad, whole-wheat bread, toasted and drizzled with olive oil, medium fresh fig 383 A 764 35 35 18 215 21.3 1.5 5.2
M16 Chicken Saltimbocca, whole-wheat couscous, steamed broccoli florets 337 A 540 35 46 8 172 9.5 1.1 2.1
M17 Grilled Polenta & Vegetables with Lemon-Caper Vinaigrette, medium plum 395 HF B 561 39 0 18 35 3.1 0.6 0.0
M18 Cauliflower, Pancetta & Olive Spaghetti, hard-boiled egg seasoned with a pinch each of salt and pepper 362 A 432 54 9 8 100 3.4 1.5 1.0
M19 Garlic, Sausage & Kale Naan Pizzas, medium carrots 361 A 456 31 26 11 149 7.0 1.3 1.5
M20 Sugar Snap Pea Salad, Oatmeal with Fruit & Nuts, clementine 338 A 732 44 8 22 92 4.2 1.2 0.1
V01 Fresh puttanesca with brown rice 403 S 293 74 0 9 33 2.7 0.3 0.0
V02 Asparagus with hazelnut gremolata, Mango salsa pizza 459 S 400 78 3 4 58 2.8 0.5 0.4
V03 Polenta with roasted Mediterranean vegetables, Braised kale with cherry tomatoes 413 S 302 59 0 14 155 4.8 1.2 0.0
V04 Rice noodles with spring vegetables, Cauliflower mashed potatoes 394 A 279 55 0 6 130 2.9 0.7 0.0
V05 Soft tacos with southwestern vegetables 433 S 373 67 0 13 27 2.9 0.8 0.0
V06 Yellow lentils with spinach and ginger, Eggplant with toasted spices 446 S 318 40 0 12 55 3.6 0.5 0.0
V07 Tomato basil bruschetta, Apple-fennel slaw 436 S 248 70 0 7 30 2.7 0.5 0.0
V08 Asian vegetable salad, Baked apples with cherries and almonds 428 S 406 47 0 13 79 2.9 0.5 0.0
V09 Gazpacho with chickpeas, Peach crumble 431 S 262 62 0 6 14 2.1 0.4 0.0
V10 Vegetarian chili, Orange dream 451 S 258 46 0 9 84 1.8 0.6 0.0
W01 Amish-Style French Toast 207 C 429 45 8 4 1 3.5 1.0 1.0
W02 Simple Bacon Omelet, orange juice, toast 288 B 549 29 23 3 78 5.2 1.6 2.3
W03 Basic Buttermilk Pancakes, blueberry 272 B 464 54 3 4 10 1.7 0.7 0.5
W04 American Flag Fruit Toast 321 A 319 58 2 4 5 2.3 0.3 0.1
W05 Easy Eggs Benedict 184 D 403 30 21 3 2 2.0 1.8 2.6
W06 Juicy Broiled Burger, Thin and Crispy French Fries 141 D 833 30 36 4 11 11.7 1.2 3.2
W07 Grilled Hot Dogs with Sauerkraut 153 D 811 22 28 5 26 7.9 1.2 2.7
W08 Biscuit, Fried Chicken, Honey Butter assembly 250 HF D 999 26 37 1 0 6.7 2.5 1.9
W09 Chicago-style pizza 194 D 1,347 69 13 13 13 9.9 2.1 1.1
W10 Chocolate Chip Muffins 211 C 137 8 2 1 0 0.2 0.3 0.2
W11 Chicken Cordon Bleu Skillet 233 C 561 44 37 0 13 7.5 0.3 1.6
W12 Meat Loaf & Mashed Red Potatoes 193 D 441 37 20 3 27 7.4 1.5 2.0
W13 Spaghetti & Meatballs 179 HS E 446 79 3 4 10 4.8 0.4 0.3
W14 Blue Cheese-Crusted Sirloin Steaks, Broccoli with Red Pepper 235 C 728 11 33 5 146 9.9 0.9 2.8
W15 Bean & Beef Slow-Cooked Chili 287 B 1,031 36 13 75 25 9.0 1.2 1.2
W16 Beef & Rice Stuffed Cabbage Rolls 194 D 264 25 15 5 6 4.4 0.2 1.4
W17 Chili-Rubbed Ribs, Cobb Salad 185 D 925 13 77 5 76 11.0 3.3 5.2
W18 Skillet Chicken Fajitas 190 D 621 34 44 4 63 16.4 1.4 1.7

*KH01-15, Korean home-dining; KO01-15, Korean out-dining; C01-10, Chinese; M01-20, Mediterranean; V01-10, vegetarian; W01-18, Western.

ACFS, anti-cancer food scoring system; HF, high fat; HS, high salt.

ACFS grade S, ideal for cancer prevention; A, good for cancer prevention; B, might have anticancer potential; C, difficult to be regarded as preventive or carcinogenic; D, might be against cancer prevention; E, probably against cancer prevention.

Table 3

Univariate analysis among nutrition profiles and ACFS grade groups.

nrp-14-32-i003
ACFS E, D (n = 21) ACFS C, B (n = 35) ACFS A, S (n = 34) P-value
Median value (range)
Total calorie (kcal) 621.0 (198.0-1,364.0) 544.0 (137.0-1,643.0) 396.0 (146.0-1,046.0) < 0.001
*Carbohydrate rate (%) 37.0 (13.0-76.0) 43.0 (8.0-74.0) 51.0 (6.0-84.0) 0.012
*Lipid rate (%) 39.0 (6.0-63.0) 39.5 (6.0-85.0) 32.0 (3.0-72.0) 0.066
*Protein rate (%) 19.0 (10.0-35.0) 16.0 (6.0-37.0) 18.0 (5.0-46.0) 0.762
Carbohydrate (g) 55.0 (16.0-227.0) 69.5 (3.0-135.0) 49.0 (4.0-173.0) 0.316
Total fat (g) 25.0 (3.0-77.0) 25.0 (3.0-86.0) 13.0 (1.0-35.0) < 0.001
Plant fat (g) 8.0 (0-42.0) 11.5 (0-48.0) 9.0 (1-25.0) 0.563
Animal fat (g) 18.0 (0-53.0) 9.0 (0-84.0) 1.0 (0-13.0) < 0.001
Protein (g) 28.0 (10.0-81.0) 24.5 (3.0-151.0) 17.0 (2.0-61.0) 0.004
Protein, plant (g) 7.0 (3.0-30.0) 8.0 (1.0-64.0) 12.0 (2.0-31.0) 0.059
Animal protein (g) 20.0 (1.0-77.0) 14.0 (0-146.0) 3.0 (0-46.0) < 0.001
Fiber (g) 4.0 (0-18.0) 6.5 (0-75.0) 9.0 (4.0-22.0) < 0.001
Fiber, water soluble (g) 0.40 (0-4.30) 0.85 (0-10.30) 1.30 (0.2-3.10) 0.001
Fiber, non-soluble (g) 2.40 (0-11.80) 3.90 (0-61.30) 4.30 (1.20-11.0) 0.055
Water (g) 188.0 (43.0-536.0) 240.5 (21.0-494.0) 274.0 (118.0-620.0) 0.076
Vitamin A (RAE) 104.0 (4.0-386.0) 156.0 (12.0-518.0) 135.0 (7.0-931.0) .0.261
Retinol (μg) 22.0 (0-235.0) 23.5 (0-371.0) 32.0 (0-173.0) 0.275
Beta carotene (μg) 477.0 (1.0-4,138.0) 1235.0 (4.0-5,058.0) 1352.0 (40.0-10,680.0) 0.055
Vitamin D (μg) 0.37 (0-5.13) 0.36 (0-20.00) ~0.0 (0-45.34) 0.037
Vitamin E (mg) 3.00 (1.00-47.0) 7.50 (1.00-36.0) 4.00 (1.00-13.0) 0.270
Vitamin K (μg) 12.0 (0-364.0) 60.5 (0-612.0) 68.0 (6.00-1093.0) 0.014
Vitamin C (mg) 13.0 (0-76.0) 28.5 (0-146.0) 55.0 (3.0-215.0) < 0.001
Thiamine (mg) 0.56 (0.20-2.01) 0.58 (0.04-1.92) 0.57 (0.12-1.78) 0.957
Riboflavin (mg) 0.50 (0.10-1.60) 0.45 (0.10-1.60) 0.40 (0.10-1.10) 0.041
Niacin (mg) 6.60 (1.60-16.40) 4.20 (0.20-13.40) 3.00 (0.90-21.30) 0.009
Vitamin B6 (mg) 0.50 (0.10-1.80) 0.50 (0.0-1.60) 0.40 (0.20-1.50) 0.131
Folic acid (μg) 106.0 (14.0-418.0) 176.5 (15.0-806.0) 153.0 (35.0-698.0) 0.123
Vitamin B12 (μg) 0.80 (0.10-5.00) 0.95 (0-13.2) 0.20 (0-8.40) 0.002
Pantothenic acid (mg) 1.40 (0.10-4.00) 1.30 (0.10-2.60) 0.50 (0.10-1.60) < 0.001
Biotin (μg) ~0.0 (0-3.50) ~0.0 (0-4.08) ~0.0 (0-9.00) 0.249
Calcium (mg) 89.0 (22.0-289.0) 118.0 (27.0-427.0) 130.0 (28.0-723.0) 0.035
Calcium, plant (mg) 35.0 (14.0-243.0) 86.5 (2.0-415.0) 93.0 (28.0-546.0) < 0.001
Calcium, meat (mg) 33.0 (0-259.0) 30.0 (0-210.0) 13.0 (0-271.0) 0.107
Phosphorous (mg) 406.0 (106.0-1,147.0) 362.0 (51.0-1,216.0) 353.0 (51.0-921.0) 0.356
Sodium (mg) 1104.0 (167.0-3,048.0) 1021.5 (117.0-3,557.0) 351.0 (13.0-3,442.0) < 0.001
Chloride (mg) 16.1 (0-1,712.0) 13.8 (0-253.8) 3.1 (0-317.2) 0.124
Potassium (mg) 782.0 (175.0-2,047.0) 767.0 (58.0-3,779.0) 793.0 (232.0-1,982.0) 0.425
Magnesium (mg) 33.0 (3.00-160.0) 34.0 (2.00-270.0) 40.0 (6.00-141.0) 0.219
Iron (mg) 3.70 (1.40-10.40) 4.55 (0.30-18.30) 4.60 (0.70-15.60) 0.862
Plant iron (mg) 2.40 (0.50-7.70) 3.45 (0.10-17.00) 3.50 (0.70-10.50) 0.059
Animal iron (mg) 1.70 (0.20-5.20) 1.15 (0-7.00) 0.10 (0-5.20) < 0.001
Zinc (mg) 3.8 (0.80-12.6) 3.3 (0.30-12.6) 2.0 (0.40-6.3) 0.006
Copper (μg) 198.0 (25.0-486.0) 211.0 (20.0-1,340.0) 169.0 (19.0-479.0) 0.303
Fluorine (mg) ~0.0 (0-0.05) ~0.0 (0-0.05) ~0.0 (0-0.08) 0.964
Manganese (mg) 0.38 (0.07-1.06) 0.62 (0.01-4.92) 0.49 (0.07-1.84) 0.656
Iodine (μg) 4.90 (0-590.5) 6.30 (0-580.0) 2.30 (0-50.40) 0.131
Selenium (μg) 29.6 (0.10-137.2) 20.6 (1.00-71.6) 13.6 (0.60-121.9) 0.018
Cobalt (μg) ~0.0 ~0.0 (0-56.3) ~0.0 (0-0.07) 0.961
Molybdenum (μg) ~0.0 (0-4.08) 0.10 (0-12.6) 0.15 (0-2.79) 0.125
Cholesterol (mg) 130.0 (7.00-495.0) 84.0 (0-493.0) 17.0 (0-268.0) < 0.001

*Rates of proportions contributing total calories of meals.

ACFS, Anti-cancer food scoring system; RAE, Retinol Activity Equivalent.

ACFS grade S, ideal for cancer prevention; A, good for cancer prevention; B, might have anticancer potential; C, difficult to be regarded as preventive or carcinogenic; D, might be against cancer prevention; E, probably against cancer prevention.

Table 4

Result of the multivariate analysis on statistically significant factors obtained from the univariate analysis.

nrp-14-32-i004
non-standardized standardized
β SE β P
Significant factors
 Animal fat -0.030 0.013 -0.330 0.020
 Animal iron -0.364 0.155 -0.345 0.021
 Niacin -0.138 0.047 -0.359 0.004
 Fiber 0.029 0.013 0.183 0.034
 Animal protein 0.037 0.013 0.525 0.006
 Vitamin C 0.013 0.003 0.420 < 0.001
Non-significant trends
 Pantothenic acid -0.349 0.184 -0.192 0.062
 Sodium 0 0 -0.175 0.077
 Vitamin B12 0.123 0.068 0.193 0.074

SE: standard error

TOOLS
Similar articles