

 PDF
PDF ePub
ePub Citation
 Print
Print


INTRODUCTION
The number of individual with hypertension was estimated up to approximately 1 billion people, more than 25% of the adult population worldwide in 2000 and it was predicted to increase by 1.56 billion people in 2025 [1]. High blood pressure is a significant public priority not only because it is common and its consequences are severe but also because it can be prevented through healthy behaviors. Among them, high sodium intake was focused as a major risk factor to raise blood pressure. Potassium was also studied in relation to lowering blood pressure [2], although the recommended molar ratios of sodium to potassium were still controversial [3,4].
Generally, diet containing abundant fruits and vegetables, like the Dietary Approaches to Stop Hypertension (DASH) diet [2], is recommended to prevent hypertension [5]. The recent INTERMAP (the population-based cross-sectional international study on Macro/Micronutrients and Blood Pressure) studies showed the independent relationships of fruits and vegetables; no significant relation of raw fruit and fruit juice to blood pressure [6]; the inverse relation of commonly consumed raw vegetables and commonly consumed cooked vegetables with blood pressure [7]. However, most cross-sectional and prospective epidemiologic studies have reported the inverse relations of combined intake of fruits and vegetables to blood pressure [8,9].
The intake of total Fruits and vegetables, mainly vegetables, among Koreans was 483.2 g/d in 2011, higher in comparison with those of other European countries [10] and Japan [11]. Despite high consumption of vegetables, Korean population has been well known to have high prevalence of hypertension (overall 26.9%; 29.3% and 23.9% for men and women aged 30 or over, respectively) [12]. These phenomenons make us hypothesize that salt or salty ingredients such as red pepper paste, soybean paste, salt-fermented fishes and shellfishes used before, during, and after cooking vegetables in Korean foods contribute to high blood pressure. There was not enough epidemiologic evidence for the relationship of combined and separate intake of fruits and vegetables and intake of salty or fresh vegetables, as well as sodium and potassium, with blood pressure among Korean adults [13,14].
The present study evaluated the cross-sectional relationship of blood pressure-related nutritional factors including sodium, potassium, and fruits and vegetables including Kimchie with systolic and diastolic blood pressure among Korean adults aged 40 or over who were recruited in the baseline surveys of the Multi-Rural communities Cohort (MRCohort), Korea.
SUBJECTS AND METHODS
Study population
The MRCohort was initiated to identify risk factors for CVD as a part of the Korean Genome Epidemiology Study (KoGES). At baseline, 9,696 subjects aged 40 years and over were recruited from centers located in Yangpyeong, Namwon and Goryeong between January 2005 and February 2010. Yangpyeng is located 45 km east of Seoul, the capital of South Korea, and Namwon and Goryung are located in southwestern and southeastern areas of South Korea, respectively. The majority of the subjects were farmers and housewives. In this cross-sectional analysis using the baseline survey data, we excluded subjects who reported a physician-diagnosed heart disease (n = 614), cerebrovascular disease (n = 336), or cancer (n = 225), those who used any medication for diabetes (n = 731), hypertension (n = 2,190), or dyslipidemia (n = 197), and those who did not have alcohol consumption data (n = 81). In addition, subjects who reported implausible dietary intake (< 500 or > 4,000 kcal/d) or more than 10 missing food items (n = 78), or those who did not have blood pressure data (n = 17), anthropometric measures (height, weight and waist circumference) (n = 39), and smoking status (n = 18) were excluded. A total of 6,283 subjects (2,443 men and 3,840 women) aged 40 or older (range 40 to 89 years) were included in the final data analysis. This study was conducted in accordance with the Declaration of Helsinki and the protocol was approved by the Institutional Review Boards (IRB) of Hanyang University (HYUH 2005-15, 2006-32, 2007-04, 2008-09), Chonnam National University Hospital (CNUH 06-062) and Keimyung University (KU 06-40, 07-39, 09-50). Written informed consent was obtained from all subjects.
General characteristics, anthropometrics and biochemical variables
All procedures were conducted at three centers and followed the standardized protocols, which were developed for a questionnaire and each examination procedure, including measurements of height and weight, blood pressure, and blood sampling. All interviewers and examiners were trained by the same personnel from the coordinating center. A structured questionnaire, including information on demographics, education, smoking, alcohol consumption, exercise, medical history and female reproductive history was administered by trained interviewers.
Height was measured with a standard height scale to the nearest 0.1cm and weight was measured with a metric weight scale to the nearest 0.01 kg in light clothing without shoes. Body mass index (BMI) was calculated as weight (kg) divided by height square (m2). Waist circumference (WC) was measured half way between the lowest rib margin and the iliac crest. Blood samples were collected in the morning after at least eight hours of fasting. Serum total cholesterol, triglycerides, glucose and high density lipoprotein (HDL) cholesterol were measured by the ADVIA1650 Automatic Analyzer (Siemens, New York, USA).
Dietary assessment
Dietary data were collected by interviewers with a food frequency questionnaire (FFQ) composed of 106 food items. Each participant was asked to identify the usual frequency of consumption of 106 food items during the previous year and the average serving size consumed. The FFQ consisted of nine frequency categories ranging from 'never or rare' to '3 times/d', and three serving sizes were specified. For food items with different seasonal availability, the participants were asked to mark how long they had eaten among four categories: 3, 6, 9, and 12 months. The validity and reproducibility of the FFQ have been reported in detail elsewhere [15]. Nutrient intake was calculated using a weighted frequency per day and a portion per unit in each food item. The seventh edition of the Food Composition Table of Korea was used as the nutrient database [16].
Measurement of blood pressure
Blood pressure was measured from the right arm by auscultation using a standard sphygmomanometer and a standard cuff. Two consecutive measurements of blood pressure were taken after each subject had been sitting for at least 5 minutes. Systolic blood pressure (SBP) and diastolic blood pressure (DBP) were measured with a standard mercury sphygmomanometer using the first and fifth Korotkoff sounds, to the nearest 2 mmHg. If the two systolic or diastolic blood pressures were more than 5 mmHg apart, an additional measurement was performed, and the mean value of the last two measurements was used for the subsequent analyses.
Statistical analysis
Nutrient intakes were adjusted for total energy intake by the residual method [17] and subjects were categorized into quintiles by dietary intakes of sodium and potassium and those of fruits and vegetables. As fruits and vegetables exposures, combined all fruits and vegetables intake, fruits and non-picked vegetables (excluded Kimchies and salt-pickled vegetables), Kimchies, fresh vegetables (raw lettuce and vegetables salad), and fruits variables were used. To describe the baseline characteristics of the study participants, the means and standard deviations for continuous variables and the prevalence for categorical variables are shown. To assess potential confounders between dietary exposure and blood pressure, the age-adjusted average and prevalence by quintiles of dietary factors was shown by the general linear model. The variables showing significant differences or linear trend across quintiles of dietary factors were adjusted for in the multivariable analyses as potential confounders. To choose dietary potential confounders, the same procedure above was performed for dietary factors, which have been kwon as risk factors for blood pressure [18,19]. Among them, farmer (yes/no), marital status (married or not), education (relatively highly educated ≥ 9 years/less), regular exercise (yes/no) were included in the multivariable models as categorical variables. The variables which showed 0.6 or higher Pearson correlation coefficient with a dietary exposure factor were not included in multivariable model. For analysis of food as an exposure variable, sodium and potassium was not included in the model because these foods were their major source foods. When statistically significant effects were demonstrated, Tukey's post hoc comparison test was used to identify group differences at P < 0.05. The trend tests were conducted by treating the median value of each category of nutrient intake or fruits and/or vegetables intake as a continuous value. The differences in the means of SBP and DBP between quintiles of intake of nutrients and fruits and/or vegetables were assessed by the general linear model. The average and 95% confidence intervals are shown. All statistical analyses were performed using SAS (version 9.2 SAS Institute Inc., Cary, NC) and P-values < 0.05 were considered significant.
RESULTS
General characteristics of the study population
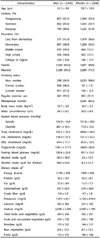
The study participants were recruited from three centers (35.1%, 34.5%, and 30.5% men and 33.4%, 34.7%, and 31.9% women from Yangpyeong, Namwon and Koryung, respectively). The proportion of men was 38.9% and the mean age was 61.5 years for men and 59.7 years for women. Men were more likely to be highly educated, farmers, married, current smokers and current drinkers compared to women. Among drinkers, men reported higher levels of alcohol consumption (46.0 g/day) than women (8.3 g/day). Men also had a higher WC, triglyceride, blood glucose, but women were likely to have a higher BMI, total cholesterol and LDL cholesterol. Daily nutrient intakes and frequency of fruits and vegetables, except fruits, were higher among men than women. The average SBP and DBP was higher among men than women. The proportion of postmenopausal women was 80.2% (Table 1).
The potential confounders of the relationship between sodium intake and blood pressure
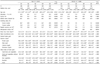
Table 2 presents potential confounding factors according to quintiles of dietary sodium intake only. Among men, the prevalence of farmers, WC, intakes of protein, fiber, calcium, potassium, and kimchies showed significant difference or the linear trend between quintiles of daily sodium intake and fruits were likely to decrease. Among women, age, the prevalence of farmer showed decreasing trend across quintiles of sodium intake. However, the prevalence of married women, BMI, WC, alcohol consumption, and intakes of dietary protein, fiber, and calcium showed increasing trend. Fiber and potassium intake were not included in multivariable model for sodium intake due to high correlation each other. The potential confounders for all other dietary exposures were selected by the same procedure and were described in detail in Table 3 and Table 4.
The relationships of blood pressure with dietary intake of sodium, potassium, and fruits and vegetables
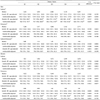
Age- and multivariable-adjusted means of SBP and DBP according to quintiles of sodium, potassium, and sodium to potassium ratio are shown in Table 3. Sodium and sodium to potassium ratio was positively related to blood pressure for men. This relation remained after potential confounders such as job, obesity, and dietary factors (DBP, 78.8 mmHg in the lowest quintile vs 80.6 mmHg in the highest quintile for sodium intake, P for trend = 0.0079; DBP, 79.0 mmHg in the lowest quintile vs 80.7 mmHg in the highest quintile, P for trend = 0.0199 and SBP, 123.8 mmHg in the lowest quintile vs 125.9 mmHg in the highest quintile for sodium to potassium ratio). The fourth quintile of sodium intake had significantly higher DBP comparing to the first quintile of sodium intake. Sodium to potassium ratio for men was also positively related to SBP (P for trend = 0.0246). Among women, dietary sodium, potassium, and sodium to potassium ratio was positively related to DBP and potassium was also related to SBP in age-adjusted model. Unexpectedly the positive relationship between potassium and SBP/DBP remained after the adjustment for potential confounders such as age, the prevalence of farmer and married women, BMI, WC, alcohol consumption and dietary factors (p for trend = 0.0437 for SBP and 0.0277 for DBP).
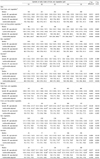
Table 4 shows the relationships between fruits and/or vegetables consumption and SBP and DBP. In men, fruits and non-pickled vegetables (81.2 mmHg in the lowest quintile vs 79.0 mmHg in the highest quintile, P for trend = 0.0040) and fruits consumption (80.9 mmHg in the lowest quintile vs 79.4 mmHg in the highest quintile, P for trend = 0.0430) were inversely related to DBP in the multivariable model. The only highest quintile group of fruits and non-pickled vegetables showed significantly lower DBP comparing to the lower quintile and there was no significant difference between quintiles of fruits consumption in the post-hoc test. In contrast, Kimchies consumption was positively related to DBP (78.2 mmHg in the lowest quintile vs 80.9 mmHg in the highest quintile for DBP, P for trend = 0.0003) in multivariable model. The third and the higher quintiles of Kimchies showed significantly higher DBP comparing to the lowest quintile of Kimchies. Among women, total fruits and vegetables, fruits and non-pickled vegetables, raw vegetables, and Kimchies did not show the linear relationship with DBP and SBP in multivariable models. However, fruits consumption (119.0 mmHg in the lowest quintile vs 121.8 mmHg in the highest quintile, P for trend = 0.0359) was positively related to SBP.
DISCUSSION
In the present study, there was the inverse relationship of fruits and combined intake of fruits and non-pickled vegetables with blood pressure among men. In contrast, sodium, sodium to potassium ratio, and Kimchies were positively related to blood pressure among men. For women, these findings were not found and unexpectedly positive relation of potassium and fruits intake were shown.
In various industrialized populations, the average sodium intakes are also very high, 2-3 folds in comparison with the current Dietary Reference Intakes (DRI) of 1,500 mg/d. The Korea National Health and Nutrition Examination Survey (KNHANES) in 2010 reported that sodium intake was 403% and 289% of DRI for men and for women, respectively [12]. Epidemiological studies [20,21], clinical trials [22,23], and meta-analysis of trials [24] have demonstrated the causal relationship between high sodium intake and high blood pressure. The positive relation of sodium intake with blood pressure among men in the present study was in agreement with these previous findings. However, some previous Korean studies, but not all [25,26], did not show the positive association between sodium intake and blood pressure [13,14,27]. This discrepancy may be due to different dietary assessment methods between previous studies and the present study. In these previous studies, the sodium intakes were calculated from one day 24 hour recall, whereas in the present study the sodium intake was from FFQ, which may generally reflect usual intake better than 24 hour recall. However, it should not be rule out that our FFQ was developed on the basis of food items not including seasoning and oils and thus there was a limitation to estimate salt intake, although almost foods except some salt and red pepper paste among the top 10 Korean sodium source food items (salt, cabbage Kimchi, soysauce, soybean paste, ramen, red pepper paste, small radish Kimchi, white rice, noodle, mixed soybean paste with red pepper paste) [12] were included in our FFQ.
The positive relation of sodium intake to blood pressure was not found among women in the present study. This gender difference was not consistent in previous studies. There was no significant gender difference in the DASH trial [28] and the DASH-Sodium trial. The phase 1 of Trials of Hypertension Prevention (TOHP-1) showed the greater effect of sodium intake in women than men. The DASH-sodium and TOHP-1 trials were among subjects with prehypertension and stage 1 hypertension and thus results from these studies could not directly compared with our findings. A Japanese study suggested a possible mechanism for gender difference between sodium intake and blood pressure; there may be no gender difference in salt-sensitivity and more decrease of plasma rennin activity after NaCl load in men than in women may make different blood pressure elevation between men and women [29].
Potassium and blood pressure hypothesis is that high potassium intake may have beneficial effect on lowering blood pressure [23] and it may be through increasing sodium excretion and decreasing calcium excretion [5]. However, there was no inverse relationship of potassium intake with blood pressure in the present study. It was consistent with the findings of previous Korean studies [14,25]. These results could be due to potassium source foods, vegetables, which were mainly eaten with salt or salty seasonings. Koreans frequently have various Kimchies pickled in salt and also have a lot of cooked or raw vegetables with salt or salty seasonings such as soy sauce, soybean paste, or red pepper paste. Thus, potassium was strongly correlated with sodium intake (Pearson r = 0.70 for men and r = 0.65 for women in the present study). In the present study, men with 116 g/d Kimchies (the lower cutoff value of the third quintile) and higher had relatively higher DBP comparing to men with less than 75 g/d (the upper cutoff value of the first quintile) (p for difference = 0.0001). Kimchies (cabbage Kimchies and Korean radish Kimchies) consumption with salt, which was positively related to SBP and DBP, contributed to more than 20% of potassium intake and more than 50% of sodium intake for men and women (data not shown). The unexpected positive relation between potassium intake and blood pressure among women disappeared after controlling for Kimchies and/or pickled vegetables with salt.
Recently, sodium to potassium ratio, rather than sodium and potassium itself, was recommended [4]. The positive relation of SBP and DBP with sodium to potassium ratio among men was found in the present study. This was in agreement with the effect of urinary sodium to potassium ratio on DBP among adults in the Dallas Heart Study, US [30] and on SBP in older adults in Australia [31]. This positive relation among men was not found among women. The Dallas Heart Study also cross-sectionally demonstrated gender difference that the DBP increase was higher in men than in women per 3-unit increase in urinary sodium to potassium ratio [30].
Despite general recommendation of fruits and vegetables, there were not many epidemiologic studies on the effect of fruits and vegetables on blood pressure. There were some well-known clinical trials using diet rich in fruits and vegetables [28,32]. The most well-known trial is the DASH [28], which showed that the fruits and vegetables diet reduced systolic blood pressure by 2.8 mmHg and diastolic blood pressure by 1.1 mmHg more than the control diet [28]. Although the DASH trial was carried out among adults with borderline high blood pressure and showed beneficial effect, this study suggests the possibility that dietary pattern relatively rich in fruits and vegetables may be beneficial, but salty vegetables may be harmful on blood pressure. The mechanisms of beneficial effect of fruits and vegetables are still unclear. Potassium, calcium, and magnesium, which are rich in fruits and vegetables, may reduce blood pressure [33,34]. In addition, the DASH may lower blood pressure, beyond those minerals and fiber, possibly by antioxidants and isoflavones [35,36,37,38].
In the current study, the relatively high consumption of fruits and non-pickled vegetables (312 g/d and higher) showed the lower DBP comparing to less than 77 g/d fruits and non-pickled vegetables consumption for men (p for difference = 0.0436). In addition, the fruits consumption was linearly related to DBP for men. However, it was not explained by the potassium effect and by the calcium and fiber effect, because potassium was highly correlated with sodium and calcium and fiber was considered as confounders. Thus, this study also could expect the possible effect of antioxidants or isoflavones like the DASH study. Therefore, further study on other components of fruits and vegetables other than potassium, calcium, and fiber involved in reduction of blood pressure is needed. In the present study, the gender difference in the relationship between fruits consumption and blood pressure was found. The positive relationship between fruits consumption and SBP for women may be explained by high content of fructose in fruits, which may induce hypertension [39]. However, the female sex hormone may play an important role in the prevention of hypertension secondary to insulin resistance [39] and thus fructose could not explain the gender difference in this study, although the high proportion of women (80.2%) were post-menopausal (80.2%). Therefore, further studies are needed to confirm this finding and the possible mechanisms.
We did not find beneficial effect of raw vegetables among men and women, and harmful effect of fruits among women, in contrast to beneficial effect among men. The non-significant finding in raw vegetables may be inferred from a unique Korean culture that most vegetables are cooked with salty seasonings. The inverse relation of fruits to blood pressure among men in the present study was in agreement with the KNHANES III finding showing that fruit intake estimated by a 24 hour recall was negatively associated with SBP among subjects with metabolic syndrome [26]. This anti-hypertensive effect of fruits may be through antioxidant vitamins, fiber content, favonols, anthocyanins, and procyanindins [40]. Meanwhile, because the experimental studies suggested that an acute effect of fructose raise blood pressure [41], fructose from fruits may explain the positive relation of fruits among women. However, the conflicting effect of antioxidants and fructose in fruits on blood pressure could not explain the gender-difference in the relationship between fruits and blood pressure.
Several limitations should be considered to interpret results in the present study. First, because this study design was cross-sectional, we cannot conclude the causality in the present study. Second, the relatively low coverage of sodium intake from the food-based FFQ not including most seasonings is the important limitation to interpret the findings, although, as we described in the above, the FFQ in the present study included most of sodium source. The validity of dietary sodium intake using dietary assessment methods, regardless of 24 hour recalls, records, and FFQ, may be low. Therefore, the relation we found in the present study should be confirmed in a large prospective study using more valid sodium and potassium assessment methods. Third, Korean diet is complicate to study on sodium intake and blood pressure due to various sources of sodium such as homemade seasonings and due to common sources of beneficial and harmful effect such as vegetables with salty seasonings. Thus, it was difficult to dissociate the effects of highly correlated nutrients with each other on blood pressure. Therefore, the intervention studies using Korean diet separating beneficial and harmful components and using low salt Kimchies and vegetables on blood pressure are needed.
In conclusion, sodium, sodium to potassium ratio, and Kimchies as a sodium source is positively, but fruits and/or non-pickled vegetables is inversely related to blood pressure for men. The present study findings suggest that dietary recommendation should be culture-sensitive and in the aspect of public health, low salt Kimchies and vegetables should be recommended to prevent hypertension.
 XML Download