

 PDF
PDF ePub
ePub Citation
 Print
Print


Introduction
Non-alcoholic fatty liver disease (NAFLD) affects approximately 10% - 20% of the population in various countries. In addition, a rapid increase in NAFLD prevalence and severity has paralleled the dramatic increase in rates of obesity and type 2 diabetes [1]. Hepatic steatosis, a feature of NAFLD, is characterized by excessive accumulation of fat in the liver, and is induced by excessive dietary fat intake, impaired fatty acid oxidation, and increased hepatic de novo lipogenesis [2]. Fatty liver is known to show an association with metabolic syndromes, such as obesity, diabetes, and dyslipidemia, which are linked to insulin resistance [3]. Patients with NAFLD are generally more insulin resistant than healthy non-steatotic subjects; in addition, patients with NAFLD, as well as those with type 2 diabetes mellitus are at greater risk for development of cirrhosis and mortality [4].
Several natural compounds have been identified as potential therapeutic agents for NAFLD and insulin resistance [5]; mounting evidence has suggested that rosemary leaf extract can improve blood lipid profile, limit weight gain, and attenuate cirrhosis in animals [6]. Carnosic acid (CA) is a primary phenolic compound of rosemary (Rosmarinus officinalis) leaves. Recent studies have demonstrated its anti-cancer, anti-oxidant, and anti-inflammatory efficacies [7-9]. Previous studies have also reported that CA inhibits triglyceride (TG) accumulation in leptin-deficient (ob/ob) mice [10]. However, the in vivo mechanism through which hepatic steatosis is suppressed is not yet fully understood. Therefore, in this study, we examined the role of CA in inhibition of hepatic fat accumulation through measurement of hepatic lipid metabolism-related parameters, such as expression levels of lipogenesis and β-oxidation genes and the composition of fatty acids in high-fat diet (HFD) fed mice.
Materials and Methods
Materials
Carnosic acid powder was purchased from Sigma-Aldrich (St. Louis, Mo, USA). Fatty acid methyl ester (FAME) standards were purchased from Supelco (Bellefonte, PA, USA). Solvents and reagents used in this study were all of analytical grade. Boron trifluoride methanol solution (14%) (BF3), sodium hydroxide, and sodium chloride were purchased from Sigma-Aldrich (St. Louis, MO, USA). Chloroform, normal hexane, and methanol were purchased from J. T. Baker (Philipsburg, NJ, USA). All other reagents were of the highest commercially available grade.
Animals and study design
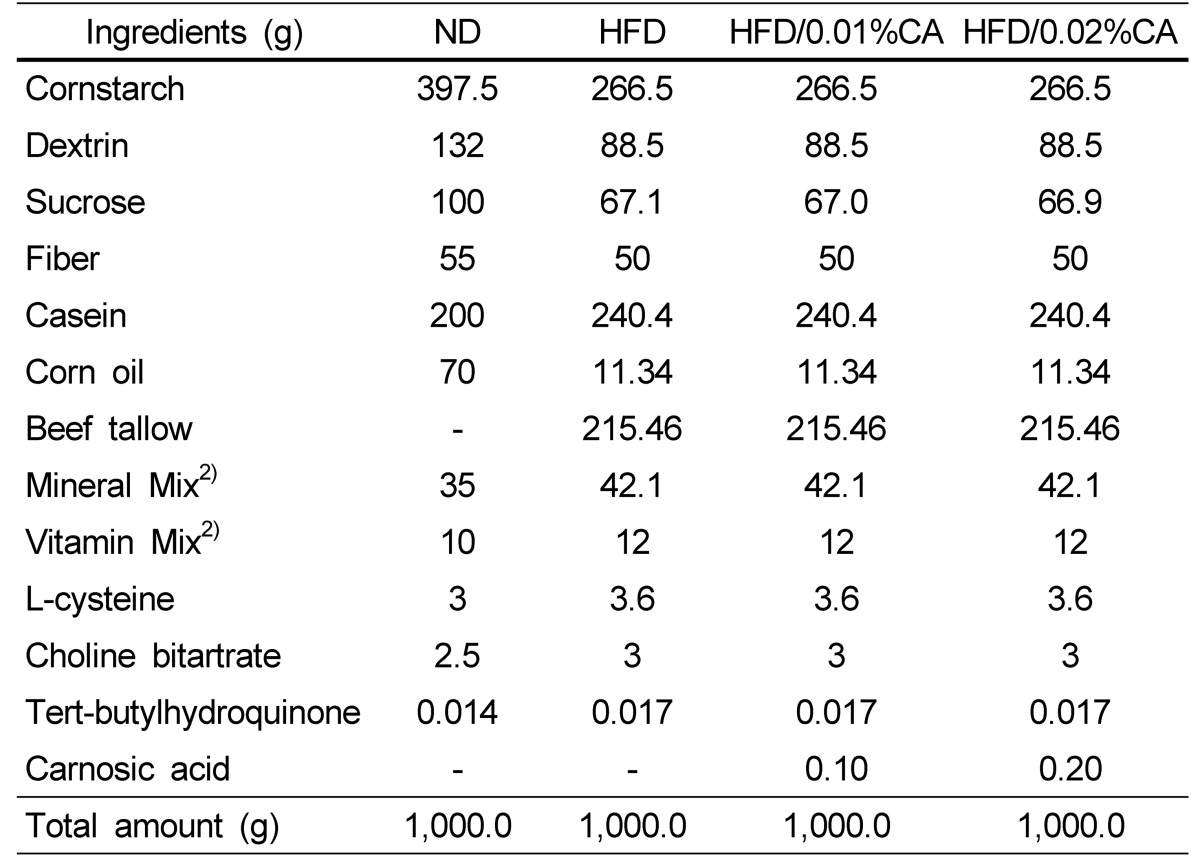
Five-week-old male C57BL/6J mice were purchased from Charles River Laboratories Japan, Inc (Tsukuba, Japan), and were maintained in air-conditioned quarters with 12-h light/dark cycles. The mice were allowed to acclimatize to the laboratory environment for one week prior to onset of the experiment, and were divided into four groups (n = 10 per group), based on their body weight. The first group of mice received a normal diet (ND, 16.7% of calories derived from fat); the second group received a high-fat diet (HFD, 45% of calories derived from fat); the third group received a high-fat diet supplemented with 0.01% (w/w) CA (HFD with 0.01% CA of diet weight); and the fourth group received a high-fat diet supplemented with 0.02% (w/w) CA (HFD with 0.02% CA of diet). The compositions of the experimental diets are shown in Table 1. The treatment period was 12 weeks. During the experimental period, the mice had free access to water and food, and their body weights and food intake were measured twice per week. The animal protocol was approved by the Institutional Animal Care and Use Committee of the National Academy of Agricultural Science, Rural Development Administration, Suwon, Korea (Reference No: NAAS-1113).
Blood and tissue sample preparation
Mice were sacrificed at the end of the experimental period. Serum was separated by centrifuging whole blood at 3,000 rpm for 20 min, and was stored at -70℃ until the assays were performed. Liver and visceral white adipose tissue (WAT), including epididymal, perirenal, retroperitoneum, and mesentery WAT, were immediately excised, rinsed, weighed, frozen on dry ice, and stored at -70℃ until the assays were performed. Tissue sections to be used for histological evaluation were stored in 10% buffered neutral formalin.
Histological tissue analysis
Following fixation of liver tissue and WAT with 10% buffered formalin solution, tissues were dehydrated in ethanol and then embedded in paraffin wax, sectioned, and stained with hematoxylin and eosin (H & E) [11]. Images were captured using an Olympus AX 70 camera (Japan). Hepatic steatosis was graded as 0 (fatty hepatocytes occupying < 5% of liver parenchyma), 1 (fatty hepatocytes occupying 5% - 33%), 2 (fatty hepatocytes occupying 34% - 66%), or 3 (fatty hepatocytes occupying > 66%), according to the percentage of hepatic lipid [11]. Initial assessment was performed under low magnification (40× to 200×) and confirmed under high magnification (400×).
Intraperitoneal glucose tolerance test
Mice were fasted for 16 h, and then received intraperitoneal injection with 2 g/kg body weight glucose. Blood glucose levels were measured 0, 30, 60, and 120 min later [12].
Biochemical measurement
Serum free fatty acid (FFA) level was measured using enzymatic colorimetric methods (Bio BioAssays Systems, Hayward, CA, USA). Serum triglyceride (TG), total cholesterol (T-CHO), and high-density lipoprotein (HDL) levels were determined using commercial assay kits (Asan Pharm., Seoul, Korea), according to the manufacturer's protocol. Serum insulin level was measured using an enzyme-linked immunosorbent assay (ELISA), according to the manufacturer's protocol (Millipore Corp., Billerica, MA, USA). Serum fasting glucose level was measured using a OneTouch Ultra Glucose Analyzer (LifeScan, Inc., California, USA) [13]. Homeostasis model assessment of insulin resistance (HOMA-IR) was calculated using the following formula: fasting glucose (mmol/L) × fasting insulin (mU/L) / 22.5.
Determination of hepatic mRNA expression
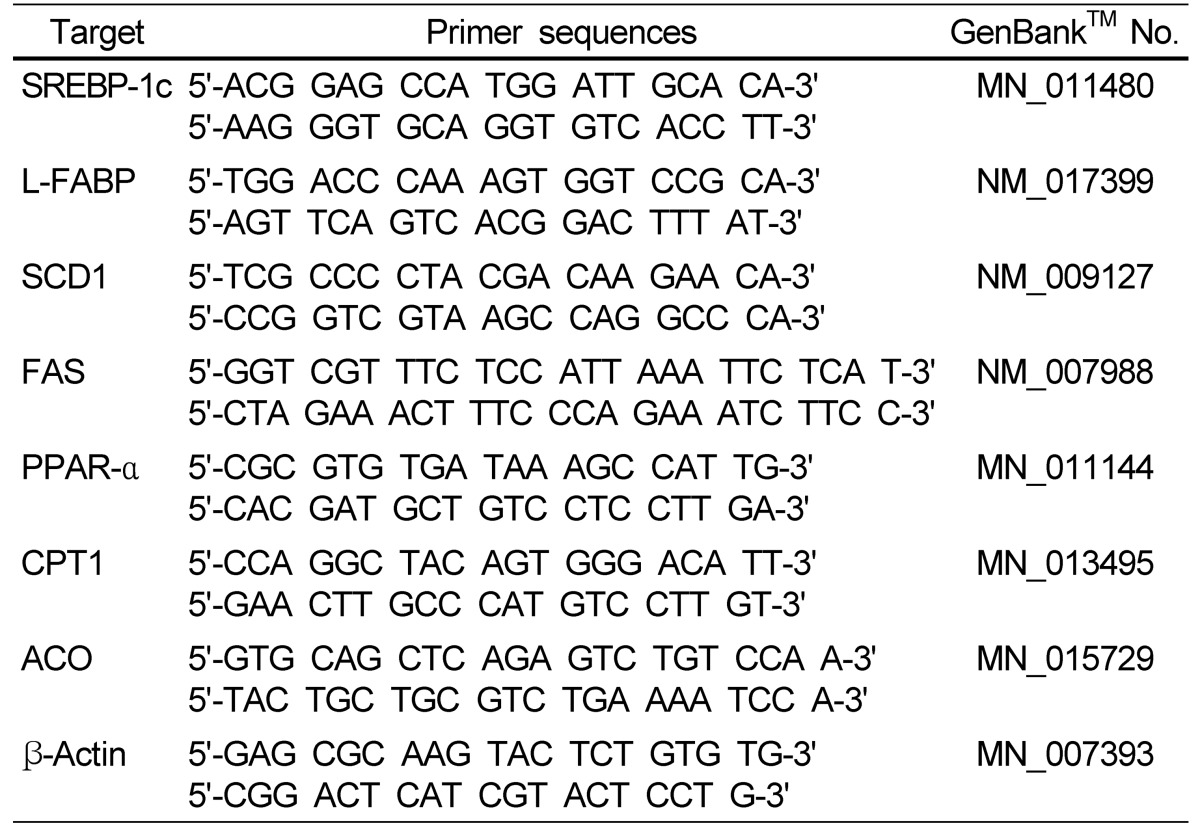
Total RNA was isolated from mouse livers using Trizol reagent (Invitrogen, CA, USA), following the manufacturer's recommendations. Real-time quantitative polymerase chain reaction (PCR) was performed using a SYBR Green™ kit (Quantitect™ SYBR Green PCR, QIAGEN). The cycling conditions were as follows: 15 min at 95℃, 40 cycles of 15 s each at 94℃, and 30 s at 72℃. Relative quantification was calculated using the Delta-Delta method [14]. The primer sequences for the genes examined are shown in Table 2.
Fatty acid analysis
Analysis of the fatty acid composition of the liver was performed according to the method described by Roberts et al. [15], using the lipid layer obtained during the RNA isolation step. Total fatty acid methyl esters (FAMEs) were obtained by a reaction in a Techne DB-3D block heater (Barloworld Scientific US Ltd., Burlington, NJ, USA), using boron trifluoride (BF3) as a catalyst. FAME content was determined using a gas chromatograph (Agilent 6890N GC; Agilent Technologies, Santa Clara, CA, USA) equipped with a flame ionization detector (FID) and an HP-FFAP capillary column (30 m × 0.32 mm I.D. × 0.25 µm film thickness; Agilent Technologies, Santa Clara, CA, USA). Injetion temperature was 230℃, split injection was performed using a split ratio of 10:1, and the FID temperature was 250℃. The oven temperature program was as follows: 100℃ for 1 min, temperature increase at a rate of 3℃ per min from 100 to 230℃, and 230℃ for 10 min. Helium was used as the carrier gas at a constant flow rate of 1.0 mL/min, with an injection volume of 1 µL. The hydrogen flow to the detector was 40 mL/min, air flow was 300 mL/min, and helium makeup gas flow rate was 20 mL/min [15].
Statistical analysis
Data were expressed as mean ± standard deviation (SD). All analyses were performed using SAS statistical software version 9.1 (SAS Institute Inc., Cary, NC, USA). Data were analyzed by one-way analysis of variance (ANOVA) followed by Duncan's multiple range tests. A value of P < 0.05 was considered statistically significant.
Results
Body weight, food intake, and tissue weight analysis
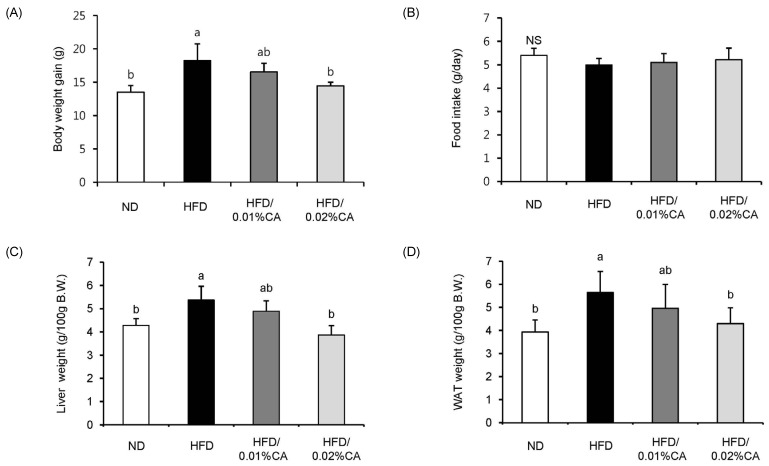
Significantly lower body weight gain due to a high-fat diet was observed in animals fed a 0.02% (w/w) CA diet (Fig. 1A, P < 0.05). Daily food intake during the experimental period did not differ significantly between groups (Fig. 1B). The relative weights of liver and WAT (per 100 g body weight) in mice fed a 0.02% (w/w) CA diet were significantly decreased by 27.93% and 23.89%, respectively, compared to the HFD group (Fig. 1C-D, P < 0.05).
Hepatic steatosis and adipocyte size: histological analysis
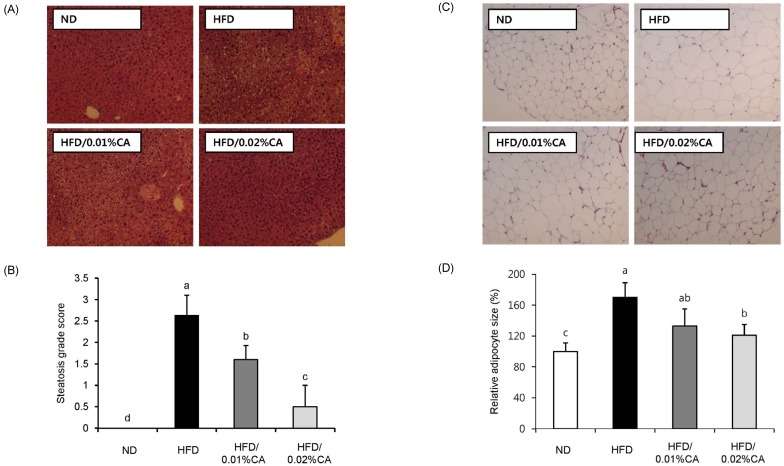
Fig. 2 shows the effects of CA administration on hepatic steatosis in HFD-fed mice. The CA-supplemented diet induced a significant reduction of steatosis as well as lipid accumulation in livers of HFD-fed mice (Fig. 2A-B, P < 0.05). In addition, adipocytes in the WAT of mice fed a 0.02% (w/w) CA diet were smaller than those in the HFD group (Fig. 2C-D, P < 0.05).
Intraperitoneal glucose tolerance test, insulin, and HOMA-IR analysis
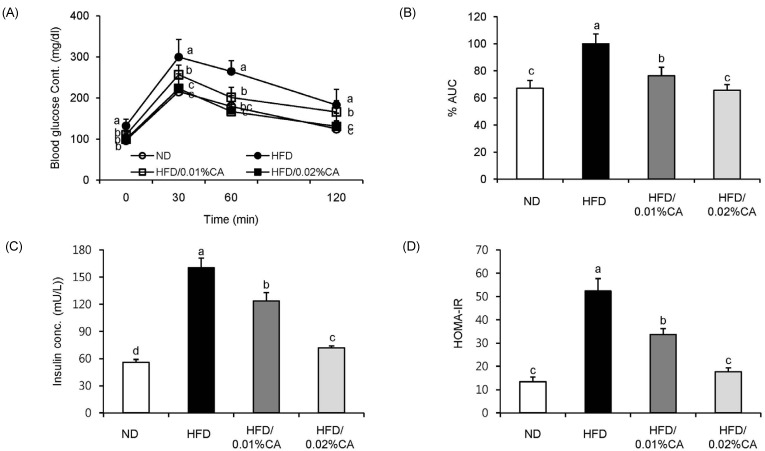
For analysis of glucose tolerance, we performed an intraperitoneal glucose tolerance test (IGTT) at the end of the 12-week experimental period. Blood glucose levels were significantly lower in the 0.01% (w/w) CA and 0.02% (w/w) CA groups than in the HFD group, at 120 min after glucose injection (2 g/kg of body weight; Fig. 3A, P < 0.05). The area under the curve (AUC) in mice fed 0.01% (w/w) and 0.02% (w/w) CA diets was also decreased by 23.61% and 34.34%, respectively, compared to HFD control mice (Fig. 3B, P < 0.05). These data indicated an improvement in glucose tolerance in obese mice fed CA-supplemented diets. In addition, administration of CA (0.01% CA and 0.02% CA, w/w) resulted in significantly reduced levels of fasting insulin. Therefore, the HOMA-IR index was significantly lower in all CA groups compared to that in the HFD group (Fig. 3C-D, P < 0.05).
Blood lipid levels
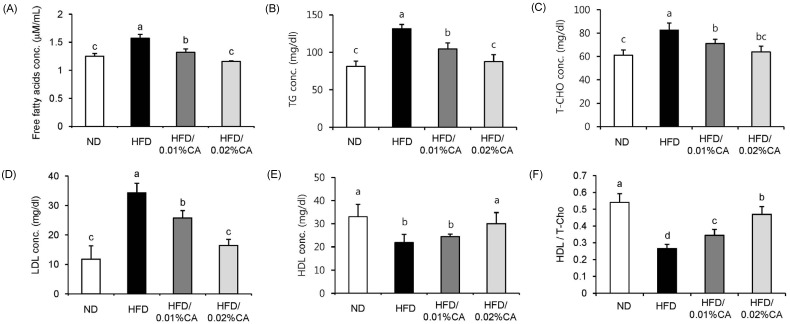
Serum biochemical parameters are shown in Fig. 4. The HFD induced significant changes in all serum parameters, compared to the ND. Administration of CA resulted in significantly reduced levels of serum FFA, TG, T-CHO, and LDL in HFD-fed mice (Fig. 4A-D, P < 0.05). On the other hand, high-density lipoprotein (HDL) level and the HDL/T-CHO ratio were significantly increased by 36.99% and 74.07%, respectively, in the 0.02% (w/w) CA group, compared to the HFD group (Fig. 4E-F, P < 0.05).
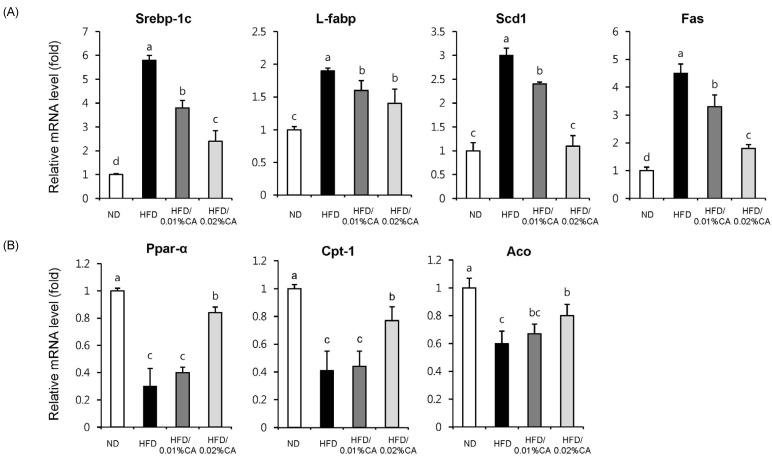
Expression of hepatic fatty acid-related genes
For evaluation of the molecular events underlying the effects of CA, we analyzed the expression of genes involved in lipid homeostasis in the liver. Our results indicated that the gene expression levels of sterol regulating element binding protein-1c (SREBP-1c), liver-fatty acid binding protein (L-FABP), stearoyl-CoA desaturase 1 (SCD1), and fatty acid synthase (FAS), which promote synthesis of de novo monounsaturated fatty acid, were significantly lower in both the 0.01% (w/w) CA and 0.02% (w/w) CA diet groups, than in the HFD group (Fig. 5A, P < 0.05). Of these genes, expression of the SCD1 gene showed the most significant reduction (63.33% decrease) in the 0.02% (w/w) CA group, compared to the HFD group (Fig. 5A, P < 0.05). In addition, the CA-supplemented diet induced a significant increase in the mRNA levels of peroxisome proliferator-activated receptor α (PPARα), carnitine palmitoyltransferase 1 (CPT1), and acyl-CoA oxidase (ACO), compared to the HFD group (Fig. 5B, P < 0.05). Altogether, these data indicated that CA contributes to enhancement of fatty acid synthesis, while inhibiting fatty acid β-oxidation in livers of HFD-fed mice.
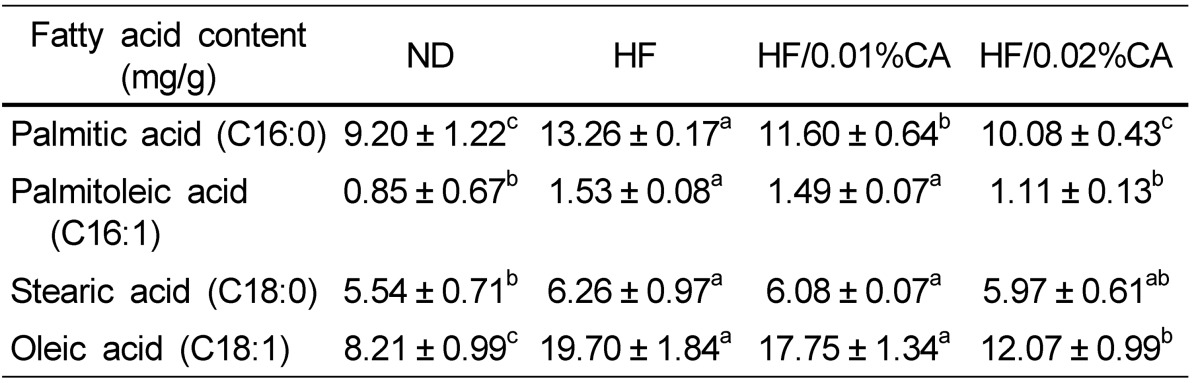
Hepatic fatty acid levels
Synthesis of C16-fatty acids occurs mainly through de novo lipogenesis, whereas C18-fatty acids are produced through elongation of palmitate. The HFD induced a significant increase in the liver content of these fatty acids, whereas administration of CA resulted in reduction of palmitic acid (C16:0), palmitoleic acid (C16:1), and oleic acid (C18:1) in liver (Table 3, P < 0.05). Stearic acid (C18:0) content in the 0.02% (w/w) CA group was also lower than that in the HFD group (Table 3), although the difference was not statistically significant. These data indicated that the 0.02% (w/w) CA diet effectively reduced accumulation of hepatic lipids in response to a HFD, through reduction of de novo lipogenesis and fatty acid elongation.
Discussion
Findings of the present study demonstrated that CA effectively controlled hepatic steatosis-related markers in HFD-fed mice, possibly through regulation of fatty acid metabolism. HFD-fed mice had elevated levels of serum FFA, TG, T-CHO, and insulin, as well as increased glucose tolerance and higher HOMA-IR index values than ND-fed mice. These data are consistent with previous evidence indicating that a HFD promotes hepatic steatosis as well as insulin resistance-associated metabolic disorders [16]. Although the exact underlying mechanisms are not fully understood thus far, disrupted lipid metabolism and insulin resistance may constitute the initial stage of NAFLD development [17]. Elevated blood FFA levels, which induce insulin resistance and enhance delivery of FFA to the liver, and up-regulation of hepatic lipogenic gene expression (SREBP-1c and PPAR-α) have been shown to accelerate progression of NAFLD [18]. In this study, diets supplemented with 0.02% (w/w) CA effectively induced a reduction in serum lipid and insulin levels, and ameliorated glucose tolerance and high HOMA-IR index values induced by the HFD. These data indicate that a CA diet can effectively improve the metabolic profile of hepatic steatosis in HFD-fed mice. Histological observations clearly demonstrate that feeding on a 0.02% (w/w) CA diet for a period of 12 weeks resulted in a significant decrease in the steatosis score, as well as the number and size of lipid droplets in WAT.
For analysis of the mechanism through which CA controls hepatic steatosis induced by HFD, we evaluated the mRNA expression of key genes involved in lipid metabolism and control of hepatic fatty acid levels. While C16-fatty acids are mainly synthesized by de novo lipogenesis, C18-fatty acids are produced through elongation of palmitate. In this study, we demonstrated that C16-fatty acid and C18-fatty acid liver content was significantly increased by a HFD compared to a ND (Table 3), and we found that a HFD enhanced both de novo lipogenesis and FA elongation (Table 3). Although diet supplementation with CA (both 0.01% and 0.02%, w/w) did not affect C18:0 liver content, the 0.02% (w/w) CA diet induced a significant decrease in C16:0, C16:1, and C18:1 content in the liver, compared to the HFD. These data suggested that a CA diet can prevent hepatic steatosis induced by a HFD, through reduction of de novo lipogenesis and fatty acid elongation.
Previous studies have demonstrated the important role of SREBP-1c, a major transcription factor involved in hepatic lipogenesis, and its target genes (SCD1 and FAS) in de novo lipogenesis [19]. One study reported that the level of SREBP-1c showed positive correlation with the degree of hepatic steatosis in patients with NAFLD [20]. In the present study, we showed that a CA-supplemented diet resulted in down-regulated mRNA expression of SREBP-1c and its target genes (SCD1 and FAS). SCD1 catalyzes the conversion of stearic acid (C18:0) into oleic acid (C18:1) in de novo lipogenesis, and its high expression level has been closely correlated with metabolic diseases [21]. SCD1-deficient mice reportedly have less body adipose tissue than normal mice, due to reduced lipid synthesis, enhanced lipid oxidation, and increased insulin sensitivity in the liver [22]. Results of our hepatic fatty acid analysis were consistent with these results, since the liver content of oleic acid (C18:1), a major product of lipogenesis, was significantly decreased in animals feeding on the 0.02% (w/w) CA diet. Hepatic levels of FAS, a key enzyme that catalyzes acetyl-CoA and malonyl-CoA reactions for synthesis of long-chain fatty acids, were reportedly higher in NAFLD patients than in normal control subjects [20]. In addition, in a previous study, hepatic expression levels of L-FABP, which is known to play a critical role in regulation of fatty acid transport by facilitating incorporation of long-chain fatty acid (LCFA) into triacylglycerols, were up-regulated in NAFLD patients compared to control subjects [23]. In our study, the CA-supplemented diet also induced a reduction in mRNA expression of L-FABP in the liver. Thus, a supplementary CA diet may prevent hepatic steatosis induced by a HFD through reduction of fatty acid uptake/transport and synthesis.
Inhibition of hepatic fat accumulation could be due to up-regulation of β-oxidation genes, including PPAR-α. Previous studies have shown that loss of expression of the PPAR-α gene, a critical transcriptional factor involved in the β-oxidation pathway, resulted in hepatic steatosis in HFD-fed mice; in addition, administration of a potent PPAR agonist resulted in improvement of hepatic steatosis via enhancement of FA β-oxidation in mice [24]. In this study, we also demonstrated that mRNA expression of PPAR-α and its target genes (CPT-1 and ACO) were significantly higher in the 0.02% (w/w) CA group than in HFD-fed animals. These data indicate that the 0.02% (w/w) CA diet prevents excess accumulation of fat in the liver by increasing the rate of FA catabolism under HFD feeding conditions.
In conclusion, dietary CA supplementation resulted in significantly reduced accumulation of hepatic fat and amelioration of metabolic disorders, including hyperglycemia, insulin resistance, and blood lipid profile, in HFD-fed mice. In addition, CA appeared to mediate its beneficial effects on HFD-induced hepatic steatosis by regulating expression of hepatic genes related to fatty acid synthesis and β-oxidation. These results suggest that CA is a potent food component that protects against HFD-induced hepatic steatosis and its related metabolic disorders.
 XML Download