

 PDF
PDF ePub
ePub Citation
 Print
Print


Introduction
Hypertension plays a major etiologic role in the development of ischemic heart disease, cerebrovascular disease, and cardiac and renal failure, and it is a significant risk factor for mortality and disability rates throughout the world [1-3]. The hypertension prevalence rate of Korean adults was 28.9% in the 2010 Korean National Health and Nutrition Examination Survey (KNHANES) [4]. Physical inactivity, obesity, smoking, a family history of hypertension, and an unhealthy diet may be contributing factors for the higher prevalence of hypertension [5,6]. Data on the association of dietary factors with the risk of hypertension have been accumulating [7,8].
A variety of studies have been implemented to explain the correlations between dietary patterns and cardiovascular diseases and hypertension [9-11]. High intakes of fruits, vegetables, cereals, fishes, nuts, low-fat dairy products and poultry in addition to relatively low intakes of fat and sugars appeared to be effective in lowering blood pressures and hypertensions [12,13]. Furthermore, a dietary pattern with frequent intakes of fruits and dairy products significantly decreased blood pressure among Chinese [14]. On the other hand, it has been reported that the increased "western" dietary pattern is typically associated with the increased prevalence of chronic diseases such as coronary heart diseases [15], type 2 diabetes [16], cancer [17], and obesity [18] worldwide. The Dietary Approaches to Stop Hypertension (DASH) dietary pattern, which is rich in fruit, vegetables, and low-fat dairy products and limits saturated fat, red meat, and sweets is a success in hypertension control [19]. Since hypertension is a cardiovascular disease risk factor, several prospective cohort studies have shown associations between dietary patterns and CVD. A cohort study in Japan also demonstrates that a dietary pattern with high meat intakes was closely related to an increased risk of cardiovascular diseases [20]. Hypertension and dyslipidemia were the risk factors implicated in various cardiovascular events [21,22] and the association of hypertension and dyslipidaemia has been reported [21]. In several dietary pattern studies, dyslipidemia had been found to be associated with unhealthy dietary patterns [23,24]. To date, numerous studies have reported associations of dietary patterns with blood lipid profiles and/or blood pressures in various patient populations, including groups with cardiovascular disease, metabolic syndrome, and hypertension in Korea [23,25,26].
It has been reported that the typical consumptions of sodium is 3 times greater than the adequate amount of 1.5 g per day and the total fat intakes in Korea increased significantly from 7.2% of total calories in 1969 to 18.5% of total calories in 2007 with an increase in animal fat consumption [27]. Generally, a Korean dietary pattern rich in vegetables, particularly salted vegetables instead of fresh vegetables, may result in high prevalence of hypertension. However, none of the dietary patterns showed any statistical associations of these patterns with hypertension.
The aim of this study is to examine the associations between major dietary patterns and hypertension as well as related blood lipid profiles among the represented Korean adult population that participated in the 2008-2010 KNHANES.
Subjects and Methods
Study population and data sets
This study is based on data from the Korean National Health and Nutrition Examination Survey (KNHANES; 2008-2010) which was conducted by the Korea Ministry of Health and Welfare. The KNHANES was a nationwide representative study that consisted of three sections: a health and behavior interview, a health examination, and a dietary survey. A total of 29,235 individuals were selected for the health interview. A stratified, multi-staged probability sampling design was used in this survey, which has been described in detail previously [4]. Among the population, 12,234 subjects aged 20 to 64 years participated in the health examination survey and the dietary survey. We excluded those who had missing values in the food-frequency questionnaire (FFQ) and dietary intakes of more than 5,000 kcal or less than 500 kcal per day. Therefore, a total of 11,883 subjects were analyzed in the present study.
Assessment of general and anthropometric measurements
Socio-demographic factors such as age, gender, education, income, and residence were collected using a self-reported general questionnaire. Body mass index (BMI) was calculated as weight (kg) divided by height (m) squared (kg/m2). The smoking status and physical activity data were collected using health-related questionnaires. The alcohol consumption data were collected using the FFQ. Blood pressure was measured three times with a phygmomanometer. Three measurements were made on subjects at 5-minutes intervals, and the average of the second and third blood pressure readings was used in the analysis. Investigators were trained to measure blood pressure and administer the questionnaire before conducting the survey. Blood samples were collected after fasting for at least 8 hours. Serum total cholesterol (TC), high-density lipoprotein (HDL)-cholesterol, low-density lipoprotein (LDL)-cholesterol, and triglycerides (TG) were analyzed by a certified laboratory.
Definition of hypertension
The information on hypertension was collected with the self-reported questionnaire only. We counted subjects as having hypertension only if they answered "yes" to the question "if a physician had diagnosed their blood pressure as being ≥140/90 mmHg (either systolic or diastolic)" or "if they reported using an antihypertensive medicine".
Assessment of dietary patterns
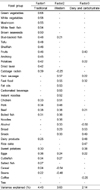
The FFQ was used in the present study, and factor analysis was conducted to derive dietary patterns from the food consumption frequencies. According to the similarities in food nutrient profiles and culinary usage, the 63 food items in the FFQ were categorized into 36 food groups to reduce the complexity of the data (Table 1). This regrouping of food items was based on the previous study with modification, including a combination of beer and soju into "alcohol" and cake and bread into "bread" [11]. Principal component factor analysis was used to identify dietary patterns, with the factors rotated by orthogonal transformation. To determine the retained number of factors, we considered components with eigenvalue greater than 1.6 and scree plot results. Factor names reflecting the food groups have more than 0.20 loadings. Factor scores were categorized into quartiles according to the distribution of the study subjects. Because the FFQ included only frequency of consumption and did not include portion sizes; nutrient intakes were analyzed using a 24-hour recall, which is the most appropriate method for estimating the mean intakes for groups.
Statistical methods
All statistical analyses were conducted using SAS (version 9.2; SAS Institute, Cary, NC, USA). Dietary patterns based on the 36 food groups from the FFQ were identified with a principal components analysis (eigenvalue > 1.6, varimax rotation) using factor analysis. Mean levels of continuous variables were estimated using the generalized linear model. The chi-square test was used to compare proportions across the groups of categorical variables. Logistic regression analysis was used to determine the association of dietary patterns with the risk of hypertension. The odds ratios (OR) were estimated for each quartile compared with the lowest quartile of each dietary pattern as the reference. Model 1 was adjusted according to age and sex. Model 2 was adjusted for education and income status in addition to the adjustments made in Model 1. Model 3 was adjusted for BMI, smoking status, physical activity, and energy intake in addition to the adjustments made in Model 2. All analyses were performed with P < 0.05 considered statistically significant.
Results
Dietary patterns
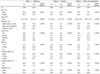
Using factor analysis, we first classified three major dietary patterns among Korean adults. The factor-loading matrix for the dietary patterns identified in the study subjects is shown in Table 2. The first factor was characterized by tofu, beans, fruit, vegetables, and fishes, and was named the "traditional pattern". The "western pattern" (Factor 2) was characterized by high intakes of hams, sausages, fast foods, fats and oils, carbonated beverages, meats (pork, chicken, and beef), noodles, and alcohols and then negatively loaded with cereals and beans. Factor 3 was characterized by a high consumption of rice cakes, breads, snacks, sweet potatoes, and dairy products and a low consumption of alcohol, and it was named the "dairy and carbohydrate" pattern.
General characteristics of the subjects by dietary patterns
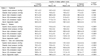
Table 3 shows the general characteristics of all the subjects according to the three dietary patterns. Subjects with higher traditional pattern scores were older and had higher education, higher income, and higher physical activity levels than those with a lower traditional pattern scores. Subjects with higher western pattern scores were more likely to be males, younger, current smokers, and more physically-active than the group with the lower western pattern score. Participants with higher dairy and carbohydrate pattern scores were more likely females with a higher education. Subjects with higher western pattern scores in all three groups tended to live in urban areas rather than in rural areas.
Mean blood pressure and blood profiles across quartiles of dietary patterns
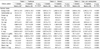
Table 4 shows mean blood pressure and blood profiles according to the quartile for each dietary pattern. The adjusted mean diastolic blood pressure (DBP) increased accordingly to the quartile in the traditional pattern. Compared with subjects in the lowest quartile, subjects in the highest quartile of the traditional pattern showed higher DBP (P for trend = 0.0015). The adjusted mean systolic blood pressure (SBP), DBP, TC, HDL-cholesterol, and TG levels were increased according to the quartile in the western pattern. Subjects in the highest quartile of the western dietary pattern had higher SBP (P for trend < 0.0001), higher DBP (P for trend < 0.0001), higher TC (P for trend < 0.0001), higher HDL (P for trend < 0.0001), and higher TG (P for trend = 0.0321) compared with participants in the lowest quartile. For the dairy and carbohydrate pattern, the adjusted mean SBP, DBP, HDL, and TG value were decreased with the quartile, but the adjusted mean serum LDL-cholesterol value increased with the quartile. Compared with participants in the lowest quartile of the diary and carbohydrate pattern, those in the highest quartile had lower SBP (P for trend < 0.0001), lower DBP (P for trend < 0.0001), lower HDL (P for trend < 0.0001), lower TG (P for trend < 0.0001), and higher LDL (P for trend < 0.0001).
Association of each dietary pattern with hypertension
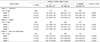
Table 5 presents the association of each dietary pattern with hypertension. A significant relationship between hypertension and either the traditional pattern or the western pattern was not being observed in Models 1, 2, and 3. Although the relationship was not statistically significant, there was a tendency that a higher western pattern score was associated with a higher prevalence of hypertension (P-value for trend = 0.07) after adjustments for age, sex, education, income, BMI, smoking, physical activity, and energy intake. The OR comparing the highest western pattern quartile to the lowest was 1.24 (95% CI, 1.04-1.46). There were significant inverse associations between hypertension and the dairy and carbohydrate pattern in Models 1, 2, and 3. A higher dairy and carbohydrate pattern score was associated with a lower prevalence of hypertension after adjusting for age and sex (P for trend < 0.0001). The inverse association remained significant after further adjustments for education, income, BMI, smoking, physical activity, and energy intake (P-value for trend < 0.0001). The OR for the top quartile was 0.64 (95% CI, 0.55-0.75) compared with the lowest quartile of the dairy and carbohydrate pattern score.
Nutrient intakes across quartile of dietary patterns
To characterize the nutrient intakes of all subjects according to the three dietary patterns, we analyzed the relationship between nutrient intakes and the dietary pattern scores by general linear regression using a 24-hr dietary record in Table 6. A higher traditional pattern score was associated with a higher energy intake. After adjustments on age, sex, education, income, smoking, physical activity, and energy intake, a higher traditional pattern score was associated with higher intakes of protein, fiber, calcium, phosphorus, iron, sodium, potassium, vitamin A, carotene, vitamin B1, vitamin B2, niacin, and vitamin C. Higher western pattern scores were associated with higher intakes of fat and lower intakes of carbohydrates, fiber, and calcium. Micronutrient intakes were decreased from the lowest to the highest quartile of the western pattern. A higher dairy and carbohydrate pattern score was associated with a higher intake of carbohydrate, protein, fat and fiber, and most vitamins, including vitamin A, vitamin B1, vitamin B2, niacin, and vitamin C. The sodium intake was significantly lower as the dairy and carbohydrate pattern score increased.
Discussion
In the present study, we have identified three major dietary patterns in a Korean adult population using factor analysis, and observed the associations of these dietary patterns with hypertension, and investigated the blood lipid profiles according to dietary patterns.
The traditional pattern was similar to the "prudent" or "Korean traditional" pattern reported in previous studies [11,28,29]. The traditional pattern did not significantly affect blood pressure and the risk of hypertension, which is consistent with a previous study [11]. It has been reported that vegetable and fruit consumptions increased HDL-cholesterol level in blood and also decreased the prevalence of hypertension, cardiovascular disease, and cancer [29-31]. It has been suggested that although the traditional Korean pattern involves a high intake of vegetables, most Koreans consume salted vegetables such as "kimchi" instead of unprocessed and fresh vegetables, which are being consumed in western countries [11]. This observation may be applied to fish intake as well. Furthermore, a high intake of refined carbohydrates may be another factor contributing to the lack of effect of the traditional pattern on hypertension in spite of the high level of vegetable consumption. Individuals with a high traditional pattern score had a higher sodium intake than those individuals with lower traditional pattern scores. Reports have indicated that high sodium intake elevated blood pressure [29,32] and resulted in cardiovascular diseases and hypertension [33,34]. According to Shimazu et al. [20], the Japanese pattern includes a high sodium intake, and a high Japanese pattern score was associated with an increased hypertension risk. Previously, the level of sodium intake in the rice-vegetable pattern was higher than that in other patterns among Koreans, and the rice-vegetable pattern was positively associated with the hypertension risk [35]. Therefore, a high intake of sodium may mask the protective effects of a high consumption of vegetables in the traditional pattern. The older population tends to consume the traditional Korean diet a lot more than the younger population [36], which might be another contributing factor to this finding. As in other developing countries in Asia, the westernized dietary pattern has become more popular among the younger population in Korea [36].
A western dietary pattern with a high intakes of red meat, processed instant food, sweets and desserts, oils, and fats was related to a significantly increased risk of hypertension in western populations [37,38]. Hu [39] reported that the "western diet pattern" score was positively associated with the fat intake percentage and the prevalence of coronary heart disease. Ahn et al. [40] reported that a dietary pattern with high meat consumption was associated with an increased percentage of fat intake and hypertension compared to other dietary patterns. In the present study, a higher western pattern score was significantly associated with increases both in SBP and DBP, total cholesterol, and triglyceride levels in blood. A higher western pattern score tended to be associated with a higher prevalence of hypertension, which was consistent with previous results of a Chinese population [9]. A number of previous studies have observed the atherogenic lipid profile, including high triglycerides, low HDL-cholesterol concentration, and insulin resistance, which may associate with hypertension [20,41]. These metabolic changes caused by the western dietary pattern may be associated with the risk of a hypertension and dyslipidmemia, which are risk factors of cardiovascular disease.
In determining the association between dietary patterns and hypertension, we discovered that the dairy and carbohydrate patterns were inversely associated with the risk of hypertension. A high dairy and carbohydrate pattern score was related to a high intake of fiber, calcium, potassium, and several vitamins, including vitamins A, B, and C. Calcium [42,43] and potassium [44,45] play important roles in the prevention of hypertension and the inhibition of blood pressure elevation. Our data may imply that the decreased risk of hypertension in the dairy and carbohydrate pattern may be related to increased calcium and potassium intake. A previous cross-sectional study based on the second KHANES of 1869 Korean men conducted in 2001 reported no significant correlations between dietary pattern and hypertension [46]. However, a recent cross-sectional study of 5308 Korean adults based on the 2007-2008 KHANES data indicated that the drinking dietary pattern was significantly associated with both hypertension and pre-hypertension [47]. We found that dairy and carbohydrate dietary pattern was associated with a reduced risk of hypertension among Korean adults. The various findings among these studies may be related to their different study designs and population.
The intake of sodium was significantly decreased and the intake of antioxidant vitamins was increased in subjects with a higher dairy and carbohydrate pattern score. Intakes of antioxidant vitamins decreases blood pressure by suppressing aldehyde, which is a risk factor for essential hypertension [48]. Previously, it has been reported that a dietary pattern with a high consumption of bread and milk was inversely associated with the prevalence of hypertension [9]. Another study has shown that the "fruit and milk" pattern with a high intake of milk, bread, and fruit was significantly associated with low SBP and DBP [14]. In the present study, we observed that the dairy and carbohydrate pattern had an inverse association with blood pressure.
The positive relation between alcohol consumption and blood pressure has been widely recognized [49-51]. The average annual increase in SBP was greater among drinkers than among non-drinkers in Japan, which suggested that long-term alcohol consumption may increase hypertension [52]. Previously, it has been reported that blood TG levels was elevated due to high alcohol consumptions [36,53], which was consistent with the results of this study. In the present study, alcohol consumption was high in the population with the western diet whereas alcohol consumption was low in subjects with the dairy and carbohydrate pattern. These results indicated that alcohol consumption may be an important contributing factor for identifying the link between dietary patterns and hypertension risk.
One limitation of the study is a cross-sectional study, which makes it difficult to find a causal relationship between dietary patterns and hypertension risk, and may cause reverse causality. This design may not allow a sequence of temporality to be established for hypertension and dietary patterns. Patients may alter their diet after awareness of previously diagnosed hypertension in order to follow their clinician's advices. If the patients consumed a healthy diet, the dietary pattern we identified may not be the cause of hypertension, but the result. Future prospective cohort studies are necessary in order to verify our findings. In addition, there was a lack of detailed information on foods (e.g., types of meats, cooking methods, and seasoning), which made it difficult to characterize dietary patterns in more specific details. It is complicated to distinguish one dietary pattern from another since many lifestyle factors are related to dietary patterns and different dietary patterns overlap. Furthermore, although we have adjusted for major lifestyle and sociodemographic factors, confounding factors may also be present. Also, a third limitation was that we used a 24-hour recall data on dietary patterns and nutrient comparisons, because nutrient intakes from FFQ were not available. Dietary data from a single day is seldom a representative of an individual's usual nutrient intakes due to day-to-day or intra-individual variations [54,55]. Therefore, multiple 24-hour recalls may provide a better estimate of nutrient intakes.
In conclusion, three major dietary patterns were identified by factor analysis and were associated with the prevalence of hypertension among Korean adults. The dairy and carbohydrate pattern was inversely associated with the risk of hypertension whereas the western pattern was positively associated with such risks. In the future, these results need to be confirmed by interventional or longitudinal cohort studies.

 XML Download