

 PDF
PDF ePub
ePub Citation
 Print
Print


Introduction
Ethiopia is facing successive droughts that are badly affecting the food and nutrition security situation of about four million people each year. The situation has been aggravated since 2008 as a result of a combination of factors: erratic rainfall, high food and fuel prices that hit the country in 2008 and the global financial crisis. The government of Ethiopia and the humanitarian community are concerned with the country's high rates of malnutrition, and a relatively small though increasing HIV/AIDS prevalence [1].
Nutrition is one of the most vital inputs to child survival and early development. Damage in early childhood can have deleterious long-term effects on an individual's well-being and that of the next generation. Malnutrition is associated with more than half of all child deaths in Ethiopia through increasing the risk factors of other child illnesses [2]. It has been also well reported that under nutrition can also impair cognitive development of children. When children's cognitive development is impaired, particularly before the age of two, the effects may be irreversible. Such children find learning more difficult. They will fail to obtain crucial skills thereby constraining their future employment opportunities. Despite these facts, an estimated 30 million children continue to be born each year in developing countries with impaired growth due to poor nutrition during fetal life [3]. Throughout the developing world, malnutrition affects almost 800 million people or 20 percent of the population. Approximately one third of all child deaths in developing countries is attributed to under nutrition [4]. Nearly all of these deaths occur in impoverished parts of Africa and Asia, where they often result from contamination of water supply by waste [5]. In developing countries, children and women are the most vulnerable to malnutrition because of low dietary intakes, infectious diseases, lack of appropriate care and inequitable distribution of food within the household [6].
Ethiopia, being one of the developing countries, its rate of child malnutrition is one of the highest, even within Sub-Saharan Africa [7]. Each year an estimated 472,000 children under the age of five die in Ethiopia [2]. Out of 100 children born in Ethiopia, 14 will not live to celebrate their fifth birthday. Of those, about ten will not see their first birthday and five will not live beyond their first month of life. This tragic fact places Ethiopia sixth among the countries of the world in terms of the absolute number of child deaths. The national mortality rate for children under five years of age is about 140 per 1,000, with variations among regions from 114 to 233 per 1,000. About 90% of mortality in children under-five years of age is caused by pneumonia, measles, malaria, diarrhea and neonatal causes. Malnutrition is the underlying cause of death in about 57% of these deaths and 11% are associated with HIV infection [2].
Ethiopia's vision for national development will rely on adequate human resource, which will only be realized if the children conceived and born today are given the opportunity to live to their full capacity. However, this opportunity is outside the reach of many Ethiopian children because of malnutrition [8]. In poorly nourished populations like Ethiopia, which ranked 171 out of 182 countries in the United Nations Development Programme (UNDP) human development index [9], reductions in hunger and improvement in nutrition convey considerable productivity gains. Such productivity gains are necessary for economic growth. In addition, improved nutrition reduces the need for health services and thus can free up resources for other pressing investments [10].
According to UNICEF, Afar Region, along with other regions of Ethiopia is identified as being hotspot because of a combination of high food insecurity, moderate to high malnutrition rates and rapid onset of emergencies like epidemic outbreaks, floods or conflicts [11]. The current nutrition situation in vulnerable districts of Southern Nations, Nationalities and Peoples (SNNP), Oromia and Afar region is graded as serious and critical with Global Acute Malnutrition (GAM) and Severe Acute Malnutrition (SAM) prevalence ranging from 7.7 to 23.4 and 2.0 to 4.5 percent, respectively. To mitigate the problem of child malnutrition, micro level studies on its cause and status of prevalence are needed. Hence, this study was conducted in one of the districts of Afar National Regional State, Aysaita with the objective of determining the status of child malnutrition in the study area and to scrutinize its association with sociodemographic, economic, institutional and other relevant farm level characteristics.
Subjects and Methods
Description of the study area
Aysaita district, which is categorized in zone one among the five zones of Afar National Regional State, is located in Eastern part of the Region sharing international boundary with Republic of Djibouti and bordered by neighboring districts: Elidar in the north, Dubti in the west, Afambo and Dire Dawa council in the south. It is 65 km from Semera (capital city of the region) and 649 km from Addis Ababa. It has a total area of 138,800 hectares having 13 kebeles; of which two urban, six pastoral and five agro-pastoral kebeles. Naturally, it is plain in terms of topography. The soil is mostly alluvial and the temperature ranges between 30℃ and 45℃. Altitudinally, it extends between 350-500 meters above sea level.
According to Central Statistical Agency (CSA), the total population of the district was estimated to be 47,210. Of the total population, 31,162 (66%) live in rural areas and the rest 16,048 (34%) live in urban areas [12]. In Aysaita, though some oil crops like groundnut and sesame are grown, maize is the staple crop and pastoral and agro-pastoral system is the dominant agricultural practice.
According to the regional Bureau of Pastoral Agriculture and Rural Development report, in the study area there are four clinics, three health posts and one health center [13]. Regarding the livestock health facilities; there is one animal health center, one health post and eight crash centers. The total water supply coverage of the district is 25.17%. Generally, erratic rainfall, diseases (malaria, fever, diarrhea), inadequate availability of health facilities, low coverage and delay of relief food distribution are among the major problems of the district.
Sampling design
A multi-stage random sampling procedure was applied to select the required number of sample units. First, Aysaita district was purposively selected for it was more accessible and has well-functioning governmental administration system than other districts of Afar National Regional State. Secondly, three agro-pastoral kebeles (Kerbuda, Mamule, and Rumaytu) were selected randomly from the total number of five agro-pastoral kebeles. To select respondents, first list of households with children under five years of age were identified and then random sampling was used to select households from the total list. To give equal chance in the selection of the sampling unit from each category, probability proportional to size (PPS) was employed across kebeles. According to Cochran's sample size determination formula, the minimum sample size required for the study area was 141 but based on the general objective of the study 180 households who have children aged less than five years were selected randomly from the prepared list depending on the total number of agro-pastoral households who have children under five years of age in each kebeles. Thus, 45, 61, and 74 children aged less than five years were selected from Kerbuda, Mamule, and Rumaytu kebeles, respectively.
Data source and data collection
Primary data had been collected by properly designed and pre-tested questionnaire. Some adjustments were made to the final version of the questionnaire based on the feedback obtained from the pre-test. The study obtained ethical clearance through the School of Postgraduate Studies since the researcher has been registered at Haramaya University and informed written consent from all of the households was obtained before the actual survey and respondents also accepted to be part of the study. The questionnaire had covered information about the child and parents, household assets, anthropometric data, etc. Weights and heights of all eligible children were measured to get data on children's growth. Appropriate training, including field practice, had been given to the enumerators to develop their understanding regarding the objectives of the study, the content of the questionnaire, how to approach the respondents and conduct the interview. Enumerators who have better command in local language were selected from the study area. They had been trained about basic interviewing techniques and measurements of anthropometric data. Moreover, personal observations and informal discussions with household head and the child's mother were made to generate primary information and secondary data were obtained from published and unpublished documents of government offices and other relevant organizations.
Method of data analysis
Classification of malnutrition and cut-off points
The use of a cut-off, a predetermined risk level used to differentiate between malnourished and adequately nourished segments of the population, enables the different individual measurements to be converted into prevalence statistics. Cut-off is used for identifying those children suffering from or at a higher risk of adverse outcomes. The children screened under such circumstances may be identified as eligible for special care. Based on recommendations by World Health Organization (WHO), these measures will be useful when they are compared with corresponding measures for a well-nourished and healthy reference population of children (of the same age and gender). In order to standardize the three measures of child malnutrition mentioned above, they are typically transformed into Z-scores referred to as height for age Z-scores (HAZ), weight for height Z-scores (WHZ) and weight for age Z-scores (WAZ). A child is considered stunted, wasted or underweight if the corresponding HAZ, WHZ and WAZ -scores are less than -2 [14]. When the measures of HAZ, WHZ and WAZ are less than -3, the child is considered severely stunted, severely wasted and severely underweight, respectively [15]. The Z scores were calculated with the help of the Epi-Info (Centers for Disease Control and Prevention, Atlanta, Georgia) statistical package whereas relevant descriptive statistics such as percentages, mean values, standard deviation (SD) and frequencies, as well as chi-squared analysis and t-test were performed using STATA 11.2 (StataCorp, Texas) statistical software.
Results
Status of child malnutrition
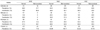
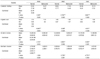
In order to scrutinize the prevalence of child malnutrition, weight-for-height Z-score (WHZ), weight-for-age Z-score (WAZ), and height-for-age Z-score (HAZ) were used. The result of the survey proved that out of 180 children under five years of age, 12.8%, 46.1%, and 67.8% were malnourished as measured by WHZ (wasting), WAZ (underweight), and HAZ (stunting) scores, respectively (Table 1).
Employing the three indicators across each kebele, the prevalence of wasting, underweight and stunting were found to be 31.1%, 55.6% and 62.8% respectively in Kerbula kebele. In Mamule kebele 50.8% and 93.6% were underweight and stunted, respectively. Whereas the prevalence of wasting, underweight and stunting in Rumaytu kebele were found to be 12.2%, 36.5% and 50% respectively. It is also worth to examine the contribution of each kebele to overall malnutrition indicator. The results indicate that out of the wasted children under five years of age, 60.9% reside in Kerbuda kebele whereas the remaining 39.1% reside in Rumaytu kebele. Weight-for-age Z-score which indicates both acute and chronic malnutrition showed that out of malnourished children 30.1%, 37.4%, and 32.5% reside Kerbuda, Marmule and Rumaytu kebele, respectively. According to HAZ indicator, the malnourished children in Kerbuda, Mamule, and Rumaytu kebeles constitute 23%, 46.7%, and 30.3% of the stunted children, respectively.
The difference among kebeles can also be shown by their respective mean Z-score values of the three indicators. The average height-for-age Z-scores for the children in Mamule, Kerbuda, and Rumaytu kebeles were -4.485, -2.305, and -1.569, respectively. That is, the severity of stunting is highest in Mamule than the other kebeles. On average, Kerbuda has the highest severity of underweight (-2.045) relative to the other two kebeles even if the number of stunted children in the kebele were the smallest. Overall, 17.8%, 46.11% and 67.78% of the children studied were wasted, underweighted and stunted, respectively.
Variables associated with child malnutrition
Household characteristics
Sex of the household head
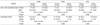
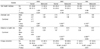
The survey results revealed that among the total respondents, 84.4% were in male-headed households and the remaining 15.6% were in female-headed ones. The proportions of malnourished children who lived in male-headed household were 43.5%, 69.9%, and 79.5% using WHZ, WAZ and HAZ indicators, respectively. With respect to prevalence of malnutrition, 46.4%, 89% and 89% of children in female-headed households are wasted, underweight and stunted, respectively. In the contrary, 6.6%, 38% and 63.8% of children in male-headed households were wasted, underweight and stunted, respectively. Generally, in all the three Z-scores, children who live in female-headed households were more vulnerable to malnutrition than who live in male-headed (Table 2).
The chi-square test for the distribution of malnourished children among male-headed and female-headed households revealed that there is statistically significant difference in proportion of malnourished children between male-headed and female-headed households in wasting, underweight, and stunting parameters (χ2 = 33.69, P = 0.000; χ2 = 24.874, P = 0.000; χ2 = 7.023, P = 0.008, respectively).
Parental educational status
Among sampled respondents, illiterate parents constitute 86.1%, whereas the rest 13.9% have some degree of exposure to formal education. As presented in Table 3, the proportions of literate parents who have malnourished children (0%, 4%, and 8%) were lower than illiterate parents (14.8%, 52.9%, and 77.4%) based on the same WHZ, WAZ, and HAZ indices, respectively. In other words, out of the total malnourished children all wasted, 98.8% of underweight, and 98.4% of stunted children had illiterate parents. The results also indicated that children whose parents are illiterate are more vulnerable to malnutrition than those under literate parents. Moreover, the result of chi-square test (χ2 = 4.254, P = 0.039; χ2 = 20.719, P = 0.000; χ2 = 47.503, P = 0.000) for wasting, underweight, and stunting, respectively revealed that the difference in the proportion of malnourished children is statistically significant (at less than 5% significance level) based on parental education.
Family size
In this study, the average family size of the sampled respondents was found to be 5.28 with standard deviation of 1.76. The maximum family size was 11 while the minimum was 2 persons. The mean family size of the households who had normal children was 5.08, 4.92, and 4.43 persons with standard deviations of 1.51, 1.51, and 1.43 in wasting, underweight and stunting indices, respectively. Nevertheless, households who had malnourished children own 1.57, 0.78, and 1.25 more persons in the family than those families who had normal children in WHZ, WAZ, and HAZ indices, respectively. The mean difference of the two categories in terms of WHZ, WAZ, and HAZ indices were found to be statistically significant (t = -4.185, -3.031, and -4.698) at less than 1% significance level, respectively (Table 3).
Experience to agro-pastoral mode of life
According to the results presented in Table 3, on average the respondents have celebrated 11 years of being agro-pastoralists. The most experienced agro-pastoralists in the sample had 39 years of experience as agro-pastoralist whereas the least experienced ones had 2 years. The average years of experience of the households who had normal children was 11.94, 13.09, and 13.67 years with standard deviation of 6.03, 6.21, and 5.7 in wasting, underweight, and stunting indices, respectively. The average year of experience of households having malnourished children was 8.83, 9.72, and 10.52 years with standard deviation of 6.63, 5.65, and 6.16 in WHZ, WAZ, and HAZ indices, respectively. This shows that households having malnourished children have less experience in agro-pastoral mode of life than their counterpart. There is also significant mean difference (t = 2.282, P = 0.024; t = 3.782, P = 0.000; t = 3.281, P = 0.001) between nutrition categories using WHZ, WAZ, and HAZ indicators of malnutrition, respectively. Therefore, the more experience the households have in the way of life of agro-pastoralism, the lesser chance of having malnourished children. The same result was reported in reference to poverty studies [16].
Children under five years of age in the household
As depicted in Table 3, the average number of children under five years of age in the household was 1.68 with standard deviation of 0.68 and the minimum and maximum number of under-five children was 1 and 4 children, respectively. The average number of children under five years of age in the household having malnourished children was 2.09 with standard deviation of 1.04 in WHZ, 1.86 with standard deviation 0.78 in WAZ, and 1.85 with standard deviation of 0.7 in HAZ. Whereas the average number of children under five years of age in the household having normal children was 1.62 with standard deviation of 0.59 in wasting, 1.54 with standard deviation of 0.54 in underweight, and 1.33 with standard deviation of 0.47 in stunting indices. Analysis of mean comparison has confirmed the existence of significant mean difference between normal and malnourished children with regards to number of under-five children variable (t = -3.118, P = 0.002 in WHZ; t = -3.218, P = 0.002 in WAZ; t = -5.17, P = 0.000 in HAZ). Another study carried out in Ethiopia has also indicated that more children below five years of age in a family imply shorter birth intervals and more difficulty in caring for children [15].
Dependency ratio
The average dependency ratio for the sampled households was 1.20 with standard deviation of 0.74. The mean dependency ratio of households having malnourished children was higher than their counterparts by 0.2, 0.3, and 0.73 in weight-for-height, weight-for-age, and height-for-age Z-scores, in that order. The mean difference was significant at 0.01 probability level between nutritional categories in WAZ and HAZ indices (t = -2.847, P = 0.005 and t = -7.014, P = 0.000, correspondingly) whereas based on wasting criteria there was no significant difference between the two categories with regard to this variable (t = -1.19, P = 0.236).
Maternal characteristics
Age of the mother/caregiver
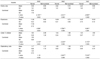
The mean age of the caregiver (mother) in the study area was found to be 27.83 years with standard deviation of 6.93. The youngest age of the caregiver was 16 whereas the oldest age was 50. According to the survey result, malnourished children were cared by elder mothers compared to the normal children i.e. the average age of caregivers for malnourished children was 34.04 years in WHZ, 29.33 years in WAZ, and 28.69 years in HAZ indices, respectively. However the mean age of the caregivers of normal children was 26.92, 26.56, and 26.03 years with standard deviation of 5.79, 5.3, and 6.33 in the three Z-scores, respectively. Similarly, the mean difference between normal and malnourished children categories with regard to age of the mother was statistically significant (t = -4.886, -2.718, -2.433) at less than 5% in wasting, underweight, and stunting, respectively (Table 4). Similar association between age of the caregiver and child malnutrition has been reported by related studies [8].
Body mass index (BMI)
The results presented in Table 5 indicate that the average BMI of the mothers was 19.6 kg/m2 with standard deviation of 2.66. The maximum BMI of the mothers was 28.44 kg/m2 while the minimum was 13.22 kg/m2. The mean BMI of mothers who have malnourished children in wasting, underweight, and stunting indices was found to be 18.46 kg/m2 with standard deviation of 1.66, 19.07 kg/m2 with standard deviation of 2.43, and 19.50 kg/m2 with standard deviation of 2.75, respectively. The mean BMI of mothers who have normal children was found to be 19.77 kg/m2 with standard deviation of 2.74, 20.05 kg/m2 with standard deviation of 2.77, and 19.82 kg/m2 with standard deviation of 2.46, respectively. Result of the independent sample t-test indicated that there was no significant mean difference between the mean BMI of the mothers who have normal children and that of malnourished children in underweight and stunting indices (t = 2.509, P = 0.13 and t = 0.773, P = 0.44, respectively) but significant at 0.05 level in wasting index (t = 2.237, P = 0.027).
Target child characteristics
Age of the target child
Various studies reported that the probability of a child being underweight or stunted increases as the child gets older [15,17]. The results of the study also indicated that the mean age of the target children in the study area was 25.25 months with standard deviation of 15.96. The youngest age of the target child was 0.2 months whereas the oldest age was 56 months. As indicated in Table 4, the mean age of malnourished children was 34.26, 29.63, and 27.11 months and that of normal children was 23.93, 21.5, and 21.33 months for wasting, underweight, and stunting, respectively. The independent sample t-test showed that there was statistically significant mean difference between the age of normal and malnourished children (t = -2.963, P = 0.003 in WHZ index; t = -3.512, P = 0.001 in WAZ index; and t = -2.299, P = 0.023 in HAZ index, respectively).
Birth order of the target child
This is the chronological order of births in a multiple birth. Children of first birth order are expected to be at a significantly higher risk of stunting than children of higher birth [18]. In the study area, 52.2%, 26.1%, 8.7%, 4.3% and 8.7% of malnourished children's birth order was 1st, 2nd, 3rd, 4th, and 5th and above, respectively for weight-for-height Z-scores. In weight-for-age Z-scores, 24.1% of malnourished and 11.3% of normal children were first birth; 25.3% of malnourished and 20.6% of normal children were 2nd birth; 28.9% of malnourished and 22.7% of normal children were 3rd birth; 14.5% of malnourished and 24.7% of normal children were 4th birth and 7.2% of malnourished and 20.6% of normal children were 5th and above birth order. Similarly for HAZ, 14.8% of malnourished and 22.4% of normal children were first birth; 23% of malnourished and 22.4% of normal children were 2nd birth; 29.5% of malnourished and 17.2% of normal children were 3rd birth; 17.2% of malnourished and 25.9% of normal children were 4th birth and 15.6% of malnourished and 12.1% of normal children were 5th and above (5+) birth order.
The chi-square test indicated that there is a statistically significant difference between birth order of the target child and child malnutrition in WHZ and WAZ indicators of malnutrition (χ2 = 25.598, P = 0.000 and χ2 = 13.254, P = 0.01, respectively). The HAZ indicators of malnutrition showed statistically non- significant difference (χ2 = 5.464, P = 0.243) between child malnutrition and birth order in the study area. From all the three malnutrition indicators, it can be concluded that wasted, underweight and stunted children were more in the lowest birth order. This might be because of the mothers' tendency to shift to the new born child expecting more care is required for it.
Socio-economic characteristics
Livestock holding
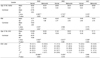
The livestock holding is an indicator of household's wealth position as well as main source of food in the ago-pastoral community. Thus, livestock holding is expected to have negative relationship with child malnutrition. The data on livestock ownership was measured using tropical livestock holding (TLU). The average livestock ownership for the sampled households was 22.44 TLU with standard deviation of 16.88. The mean livestock holding of the households having normal children was higher than the households having malnourished children by 8.45, 9.1, and 10.26 in WHZ, WAZ, and HAZ indices. The mean difference was significant at 0.01 level between households having normal and malnourished children in underweight and stunting indicators (t = 3.735 and t = 3.967, respectively). With regard to WHZ, the mean difference between the nutritional categories was significant at 5% level of probability (t = 2.267, P = 0.025) (Table 5). Some of the other empirical studies have also reported similar conclusion [15,18].
Irrigated land size
As Table 5 shows, the average irrigated land size of the sampled households was 1.65 ha with standard deviation of 0.98. The minimum and maximum irrigated land holding was 0.26 and 6.4 ha, respectively. The average irrigated land size of the sampled households were 1.74 ha and 1.01 ha, 1.8 ha and 1.48 ha, and also 1.87 ha and 1.55 ha for those having normal and malnourished children in weight-for-height Z-scores, weight-for-age Z-scores and in height-for-age Z-scores, respectively. In the WHZ, WAZ, and HAZ indices, there was significant mean difference between the households having normal and malnourished children categories with regard to irrigated farm size (t = 3.445, P = .000; t = 2.205, P = 0.029; t = 2.077, P = 0.039, correspondingly). These figures confirm that those households having enough irrigable land could secure food for their family and the prevalence of malnutrition might be lower than their counterpart.
On-farm income
Livestock, livestock products, vegetables and maize are the major source of on-farm income in the study area. The average annual on-farm income of the households was Birr 12,781.88 with standard deviation of 8,245.80. The minimum and maximum on-farm income of the households was Birr 1,140.00 and Birr 51,200.00, respectively. On average households who have normal children had higher on-farm income (Birr 13,282.84, 14,345.89, and 15,770.86) in wasting, underweight, and stunting indices, respectively as compared to their counterpart (Birr 9,362.28, 10,954.07, and 11,360.89) in wasting, underweight, and stunting indices, respectively. Analysis of mean comparison in WHZ, WAZ, and HAZ confirmed the existence of significant mean difference between households having normal and malnourished children in their on-farm income (t = 2.151, P = 0.033; t = 2.803, P = 0.006, and t = 3.454, P = 0.001, respectively) (Table 5).
Non-farm income
In the study area, the major non-farm activities were employment as guard and laborer in the Tendaho Sugar Factory irrigation canal construction, charcoal making, gift from their relatives, and livestock trading. As presented in Table 5, the average annual non-farm income of the sample respondents was Birr 2,616.11 with standard deviation of 4,938.77. The minimum and maximum non-farm income of the households was 0 and Birr 18,720.00, respectively. On average households who have normal children had higher non-farm income (Birr 2,793.89, 3,528.04, and 5,020.69) in wasting, underweight, and stunting indices, respectively as compared to their counterpart (Birr 1,402.61, 1,550.36, and 1,472.95) in wasting, underweight, and stunting indices, respectively.
Analysis of mean comparison in WAZ and HAZ nutrition indicators has confirmed the existence of significant mean difference at 1% level between those households having normal and malnourished children in their non-farm income (t = 2.726, P = 0.007 and t = 4.77, P = 0.000), respectively. However, the mean difference in non-farm income between the two nutrition categories in weight-for-height Z-scores was not statistically significant (t = 1.264, P = 0.208).
Institutional characteristics
Visit to health institute
The probability of children to be malnourished might decrease if their caregivers visit health institutes while children were caught by diseases. Among the sample households, those who visited health institutes were 59.4%, the rest 40.6% did not visit health institutes. As the figures in Table 6 indicate, the proportions of malnourished children whose caregivers visit health institutes were 47.8%, 65.1%, and 63.9% and that of normal children whose caregivers visit health institute were 61.1%, 54.6%, and 50% in WHZ, WAZ, and HAZ indices, respectively. On the other hand, out of the total caregivers who did not visit health institutes 16.4%, 39.7%, and 60.3% have malnourished children in the criteria of WHZ, WAZ, and HAZ indices, respectively. On the contrary, 10.3%, 50.5%, and 72.9% of the caregivers who visit health institute had wasted, underweight, and stunted children, respectively. Moreover, the result of chi-square test (χ2 = 1.476, P = 0.224; χ2 = 2.015, P = 0.000; and χ2 = 3.166, P = 0.075 for wasting, underweight, and stunting, respectively) revealed only height-for-age Z-scores showed significant relationship between visiting health institute and child malnutrition at 10% significance level. The reason might be because of access to counseling about proper child care and sanitation during their visit to health institutes.
Antenatal care
The average number of antenatal care visits was 2.71 with standard deviation of 2.17. The minimum and maximum number of antenatal care visits was found to be 0 and 8, respectively. The average number of antenatal care visit that the mothers of normal and malnourished children conducted were 2.83 and 1.87 in wasting criteria, 3.73 and 1.51 in underweight criteria, 4.48 and 1.86 in stunting indicator of malnutrition, respectively. Moreover, the mean comparison disclosed significant mean difference (t = 1.997, P = 0.047; t = 7.978, P = 0.000; and t = 9.178, P = 0.000) between normal and malnourished children groups with regard to number of antenatal care visits in WHZ, WAZ, and HAZ indices, respectively (Table 6).
Distance to health institutions
In the study area, agro-pastoralists used to go a minimum and a maximum of 5.1 and 17.7 km from their residence to reach the nearest health centre, respectively. On average they had to travel 9.28 km with standard deviation of 2.49 to reach the nearest health centre to get treatment and follow their antenatal care. Similarly the mean time required to reach to the nearest health centre was found to be 194.88 minutes. Based on weight-for-height Z-scores, weight-for-age Z-scores, and height-for-age Z-scores, mothers whose children were normal and malnourished have traveled on average 9.13 and 10.36 km, 8.15 and 10.61 km, and 7.94 and 9.92 km, respectively. Table 6 also revealed that there is significant mean difference (t = -2.245, P = 0.026; t = -7.575, P = 0.000; and t = -5.366, P = 0.000) with regard to distance to health centre between nutritional categories in the criteria of wasting, underweight, and stunting.
Discussion
In this study the status and prevalence of malnutrition in Aysaita district Afar National Regional State of Ethiopia have been examined after conducting anthropometric survey of 180 randomly selected households who have children age under five years old.
As it can be extrapolated from the results, out of the sampled children who are less than five years old, the proportion of wasted children is 12.8%, while those who are underweight are 46.1% of the sample, and 67.8% are stunted. When we compare this result with the findings of Mekonnen et al. [7], the children in our sample are less wasted (12.8% compared with 14%) but are more underweight (46.1% as compared to 40%) and more stunted (67.8% compared with 38%). Employing the three indices, the comparison of malnutrition concentration across the kebeles illustrated that the proportion of malnourished children living in the study area were markedly the highest in Kerbuda in WHZ but the lowest in WAZ and HAZ indices. The proportion of malnourished children in Rumaytu was moderate in all the three Z-scores whereas Mamule has the highest proportion of underweight and stunted children but there were no wasted children, relatively. Besides, the mean Z-score values showed that incidence of stunting is high in Mamule than the others. Kerbuda has high incidence of underweight relative to the other two kebeles even if the number of stunted children in the kebele were the smallest.
According to the results of descriptive statistics, sex of the household head and parental educational status were significantly related to child malnutrition indicating that being male headed and literate is negatively correlated with underweight and stunting of children, correspondingly. Due to various sociocultural values and norms, males have freedom of mobility and participation in different meetings and consequently have better resources and access to information [19]. Thus, children living in a female-headed household were expected to be malnourished than those of male-headed ones. Furthermore, education enhances the capacity of individuals to obtain, process, and utilize information disseminated through different communication channels. Therefore, children of educated parents are expected to be at a lower risk of malnutrition [20-23]. Christiaensen and Alderman [21] and Glewwe [24] have also investigated the mechanisms through which education results in better child nutrition and concluded that parental education, especially mothers' education, is a key element in improving children's nutritional status. Besides, children living in households having large family size, high dependency ratio, more number of children under five years of age, and less experience in agro-pastoral mode of life were more vulnerable to malnutrition (wasting, underweight and stunting).
Children could not be able to get adequate and balanced food required for their growth and development as the number of family size increase [8]. Thus, larger family size have adverse effect on the nutritional status of a child. Moreover when economically inactive members in a household increases relative to the number of economically active members of a household, the limited available food resources will be depleted without satisfying the required nutrition [8]. However, agro-pastoralists with higher experience appear to have often full information and better skill to increase productivity by adopting improved technologies and can supply enough food for their families.
As to factors related to maternal characteristics and targeted children, not only mothers with small body mass index have wasted children but also first birth order children were wasted and underweight than birth order two, three, and five. That is, women who are undernourished are more likely to give birth to low birth weight children, grow poorly, and remain malnourished throughout their childhood. In addition, the mother having small BMI could not be able to care for her children adequately [23]. With regard to the household socio-economic variables, malnourished children live in households who have relatively small number of livestock (TLU) and non-farm income. Mekonnen et al. [7] also indicated in their study the importance of wealth and their results agree with current findings. Haider et al. [25] also reported that child malnutrition is significantly lower in households with crossbred cows than in those without.
Concerning institutional characteristic of agro-pastoral households, visits to health institutions, number of antenatal care visits, distance to the nearest health service, and forage production were found to have significant relationship with child malnutrition. This confirms that mothers of underweight and stunted children did not have more antenatal visit and also mothers of wasted children did not visit health institutions when they had been caught by diseases than their counterpart. Households having wasted and underweight children did not involve in forage production and reside far from health institutions than those households who have normal children.
Accordingly, in order to effectively address these problems, it is suggested that coverage of quality primary health services has to be increased, counseling has to be given in order to improve the knowhow of the caregiver about child care, and health extension has to be strengthened.
 XML Download