

 PDF
PDF ePub
ePub Citation
 Print
Print


Introduction
With a declining birthrate and increasing life expectancy, Korea is rapidly aging in its demographic structure. While the population aged 65 or over was 3.8% in 1980, this grew to 11.0% in 2010 and is expected to reach 38.2% in 2050. It is also estimated that the old age dependency ratio will increase from 6.1% to 72.0% within this timeframe. An increase in old age dependency has already led to an increase in medical expenses; the percentage of the total medical cost that was expended on elderly care increased from 17.0% in 1999 to 30.5% in 2009, according to National Health Insurance statistics [1].
The aged population is, in general, an undernourished group in Korea. Although the nutrient intake of the total population has increased, the nutritional status of Korean elderly people has not much improved over the past ten years. While the rate of under-nutrition based on the Korea National Health & Nutrition Survey was 14.6% in those aged 1 or over, it was 22.7% in those aged 65 or over (17.8% in men, 26.1% in women). The percentage of people with excess energy/fat consumption was 1.3% among the elderly, while it was 4.5% among the entire population [2]. These results imply that problems related to inadequate nutrition may be more prevalent among elderly people, and more serious in elderly women than in elderly men. Considering the sociodemographic factors that influence nutritional problems, these problems were also more serious for women than their male counterparts and for those who live alone, who live in rural areas, who have lower economic and educational levels or who are of an older age [3]. The problem of under-nutrition in the elderly results in increased health problems, leading to a rise in medical costs for the elderly. These problems cannot be solved solely by individuals, and the government is thus making various efforts to address the issue. Such efforts include the provision of meals to older people who are more likely to skip meals, hub-health promotion programs, health check-ups, long-term care insurance systems, and home-visit health management programs. However, nutritional programs for the elderly need to be further expanded.
As the population ages, the number of nuclear families grows, more women enter the workforce, and more households comprise aged single persons, it has become more difficult for family structures to provide care for the elderly. Considering this, the government introduced a long-term care insurance system in July 2008, which defines care for the elderly as being one of its social roles. Under this system, elderly people with a senility-related disorder who are considered to be unable to manage daily life by themselves for six months or more can receive long-term care [4]. Currently in Korea, long-term care hospitals and long-term care facilities provide services to senior citizens, with the two being run without a clear divide in terms of function or conditions [5]. With an increase in the aged population, the number of people eligible for the system is increasing, and this in turn, may be increasing insurance costs. Therefore, the main issue at stake is how to prevent currently healthy older people from becoming eligible for long-term care insurance, alongside the issue of how to reduce the cost of medical treatment in these facilities. In this context, the importance of nutrition management is emphasized as one approach. Nutrition management designed to attenuate nutritional problems can include nutrition education, nutrition counseling, tube feeding and other supplemental nutrition programs, in which proper methodology should be applied considering the characteristics of each individual.
When addressing the nutritional problems of the elderly, it is important to consider their characteristics and potential limitations; due to a weakening of physical and mental functions, the elderly may not only have less motivation to acquire new knowledge and lower studying abilities but may also be somewhat rigid in their habits, all of which factors could make nutrition interventions less effective. Previous studies, however, have indicated that there is a positive effect of nutrition education or counseling for the elderly [6-10].
This study was designed to measure the effect of nutritional education that is targeted to elderly patients in long-term care hospitals. Most of these patients are beneficiaries of the long-term care insurance system. In the hospital setting, dieticians manage patients' diet, but the cost of this is not covered by the insurance system, with patients having to pay for it [11]. This makes it difficult for patients or caretakers to engage with diverse nutrition management programs including education, counseling, tube feeding, and supplemental nutrition programs. This study therefore attempts to measure the extent to which long-stay patients' nutritional status can be improved when nutrition education is added to their basic meal management service, which is the minimum level nutrition service provided currently by hospitals. We hope that the results of this study can be used as preliminary data for establishing guidelines for nutritional management programs targeted at elderly patients in long-term care hospitals.
Subjects and Methods
Subjects
Subjects comprised elderly, long-stay patients in a long-term care hospital in Naju in the Cheollanamdo province of South Korea, from January to May 2009. To evaluate improvements in their nutritional status following the application of nutrition education, we conducted a comparative analysis of changes before and after the program. The preliminary survey was conducted in January 2009, and based on the results of this a final, revised version of the survey questionnaire and methods were prepared. The pretest was conducted in February targeting 81 people who agreed to take part in the study, and based on its results, a nutritional education program was provided to these patients and their caretakers for four weeks. After the education was completed, we conducted a post-test, applying the same assessment method as with the pre-test, although some items were included only in the pretest. Considering the patients' age, a face-to-face interview was conducted by well-trained hospital dieticians and college students who were food and nutrition majors. The number of participants included in the final analysis was 61 (18 men, 43 women), excluding those who did not finish the nutritional education program or who did not completed the post-test.
General factors and health behaviors
The survey consisted of five factors: general factors, health behaviors, dietary behaviors, a Nutrition Screening Initiative checklist, and nutrient intake assessment. General factors included household structure, educational level, and economic status. Health behaviors included self-rated perceptions about health and depression, smoking and drinking status, exercise, and previous participation in nutrition education.
Anthropometry and biochemical indices
For data on subjects' height and weight, blood glucose, albumin, total cholesterol, HDL-cholesterol, triglycerides, and hemoglobin, we referred to the records of the hospital lab.
Dietary behaviors and nutrition screening initiative checklist
Dietary behaviors were examined based on the 'Dietary Guidelines for the Elderly (Ministry of Health & Welfare)' [12]. The survey consisted of 12 questions which asked participants whether they ate regularly, had a balanced diet, ate various types of foods, and so on. To measure the level of compliance with dietary guidelines, a score of 3 was given for yes, 2 for moderate, and 1 for no for each question, and these scores were used to calculate a total dietary behavior score. To assess participants' nutritional risk level, we applied the Nutrition Screening Initiative checklist (NSI) [13], in which the higher the total score received from 10 questions, the higher the risk level. Scores below 2 are regarded as indicating low risk, scores between 3 and 5 are considered moderate risk, while scores above 6 indicate high risk.
Nutrient intake
The amount of foods consumed was examined over a five day period. Dieticians working in the long-term care hospital and college students studying food and nutrition measured both the amount of food provided and the leftovers of each meal for each individual to calculate consumption. The intake of foods brought from outside the hospital was also reflected in nutrient intake based on interviews with caretakers. To assess nutrient intake, CAN-PRO 3.0 (Computer Aided Nutritional Analysis Program, The Korea Nutrition Society (KNS)), a nutrition-evaluating program, was used to calculate the intake of each nutrient, and the average intake over the five days was used to measure nutrient intake data for each individual. We used the Dietary Reference Intakes for Koreans [14] to evaluate the adequacy of nutrient intakes.
Nutritional education
Nutritional education was provided to the elderly patients and their caretakers in a long-term care hospital to improve their nutritional status and thus to help with treatment of their diseases. Implementing the education program was the responsibility of dieticians working within the hospital. The program was provided once a week for four weeks. Each session lasted for 60 minutes during the first three weeks, broken down into 20 minutes of information being given and 40 minutes of practical training and games. In the fourth week, the session lasted for 120 minutes, consisting of meal planning and nutrition counseling for each individual. Along with the four week basic education program, we also held mini-education sessions at lunch times for patients and caretakers. Educational materials consisted of PowerPoint resources made by our research team, and pamphlets and leaflets issued by medical institutions or public health centers. For practical training, we utilized the food guide tower, a food model and a salt amount model, and used multiple visual materials with pictures to help the elderly, illiterate patients understand the contents.
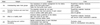
Table 1 shows the detailed content of the nutritional program provided. In the first week, the education was focused on the physiological changes that occur with aging, the importance of nutrition management, and the need for a balanced diet. After this lecture, participants played a game consisting of putting food models into a food guide tower board. In the second week, participants learned about essential nutrients, their functions in the body, minimum requirements, and the major food sources of each nutrient. They also played the food traffic light game (KFDA), which was designed to enhance and reinforce their previous learning. In the third week, the education focused on dietary guidelines for the elderly (Ministry of Health & Welfare), and considering the characteristics of those patients who had one or more chronic diseases, a model based on salt intake was used to help them reduce salt intake. After this lecture, participants were given a chance to talk about their own eating habits and were encouraged to change their dietary behaviors. In the fourth week, participants practiced menu planning and received individualized nutrition counseling. Participants were encouraged to plan their own menu, and one-on-one tailored counseling was provided. To educate about adequate food composition, foods were prepared that were within the categories of rice, soup, side dishes, and snacks in the hospital cafeteria, and each food was provided in one serving size unit based on the food exchange system. Through this, participants could practice making better choices so as to develop a balanced diet. This approach was applied to the caretakers in the same way. The mini-nutritional education that accompanied the main program focused on helping participants to understand the characteristics of daily lunch menus and on how to apply basic food group knowledge in their diet. To reduce the amount of leftovers, a survey was conducted measuring how satisfied patients were with their meals. To measure the effect of the nutrition education program, a one group pretest-posttest design was applied, and changes in their dietary behaviors, health behaviors, Nutrition Screening Initiative checklist scores, and nutrient intake were assessed before and after program participation.
Statistical analysis
Statistical analysis was conducted using SPSS 17.0. Basic statistical analysis, including mean, standard deviation and frequency data for each survey item was conducted. To analyze differences by sex, a t-test was carried out for continuous variables, while an χ2-test was applied to the categorical variables. To assess the differences between pre-test and post-test results in all categories, paired t-tests were applied to measure statistical significance.
Results
General characteristics and health behaviors
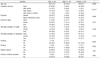
Elderly patients' general characteristics and health behaviors are indicated in Table 2. The average age of the elderly men was 76.7 and that of the elderly women was 78.8. In terms of household structure, the percentage of subjects who indicated that they lived alone was the highest in both men and women (44.4% vs. 46.5%). However, of those not living alone, elderly men were more likely to live with a spouse, while elderly women tended to live with their children. Therefore, household structure differed by sex (P < 0.01). In terms of self-rated perceptions of health, 27.9% indicated being in good health, 59.0% normal, and 45.9% poor. The percentage of subjects who saw themselves as being in poor health was higher in elderly women (51.1%) than in elderly men (33.3%), which corresponds to results from national level statistics (27% in men vs. 45% in women) [4]. In self-rated perception of depression level, 50.8% indicated a good mental state, 29.5% normal and 19.7% poor. For other health related behaviors, 11.1% of elderly men reported that they smoked, and 5.6% of elderly men and 4.7% of elderly women indicated drinking alcohol. 72.2% of elderly men and 53.5% of elderly women reported exercising regularly. On the other hand, only 9.8% of participants had received nutrition education in the past.
Anthropometry and biochemical indices
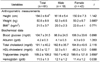
The anthropometry and biochemical indices of subjects are indicated in Table 3. The average height of elderly men was 161.6 cm and that of elderly women was 150.9 cm, while the average weight of elderly men was 52.3 kg and that of elderly women was 50.2 kg. The average BMI was 20.0 kg/m2 in the case of men and 22.0 kg/m2 in the case of women, which is somewhat low compared to the average BMI recorded in older people aged 70 or over (22.6 kg/m2 in elderly men and 23.9 kg/m2 in elderly women) from the Korea National Health & Nutrition Survey [2]. Fasting blood glucose was 98.9 mg/dl in men and 106.3 mg/dl in women. Other biochemical indices measured through blood testing included albumin, which was at 4.1 mg/dl in men vs. 4.3 mg/dl in women; total cholesterol at 182.8 mg/dl in men vs. 194.8 mg/dl in women; HDL-cholesterol at 32.3 mg/dl in men vs. 48.2 mg/dl in women; triglycerides at 150.7 mg/dl in men vs. 195.6 mg/dl in women; and hemoglobin, which was at 12.1 g/dl in men vs. 11.4 g/dl in women. The overall distribution of biochemical indices was found to be within the reasonable range.
Dietary behaviors and Nutrition Screening Initiative checklist
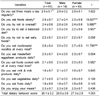
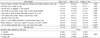
The results of the assessment of dietary behaviors, which was developed based on the Dietary Guidelines for the Elderly (Ministry of Health & Welfare), are described in Table 4. The total score for the 12 questions measuring dietary behaviors was 29.5 in men and 27.3 in women, indicating that the dietary behaviors of elderly men were slightly better than those of elderly women. The results also showed a significant difference between elderly men and elderly women from the questions asking whether they ate food slowly, whether rice/bread/noodles formed a part of every meal (P < 0.001), whether they overate (P < 0.01), whether they had a balanced diet, and whether foods cooked with oils formed a part of every meal (P < 0.05).
Subjects' nutritional risk levels, as measured by the Nutrition Screening Initiative checklist (NSI), are indicated in Table 5. The total NSI score was 7.3, on average. Elderly men averaged 6.0 whereas elderly women averaged 7.9. Thus, the average score from both sexes were within the high-risk group, and the nutritional status of women was worse than that of men (P < 0.05). By classifying findings using the criteria described earlier, we found that the rate of a low-risk group was 9.8% and that of a moderate-risk group was 26.2% while the rate of a high-risk group was 63.9%. It was also found that the percentage of participants belonging to the high-risk group was higher in elderly women than in elderly men (P < 0.05).
Nutrient intake
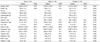
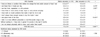
Nutrient intake findings are shown in Table 6. This indicates that the intake of most nutrients, including that of energy, were considerably lower than recommended intake levels. The daily energy intake of elderly men was 1,333.9 kcal (65.7% of the Estimated Energy Requirement, EER) and that of elderly women was 1,213.3 kcal (75.8% EER). In both men and women, the intake of calcium (57.8% Recommended Intake (RI) in men vs. 49.0% RI in women), phosphorus (56.7% RI in men vs. 53.1% RI in women), thiamin (66.7% RI in men vs. 67.8% RI in women), riboflavin (54.8% RI in men vs. 65.5% RI in women), and vitamin C (74.2% RI in men vs. 71.6% RI in women) were below recommended levels.
Changes to health behavior after nutritional education
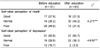
Changes to health behaviors after nutritional education are shown in Table 7. In terms of self-rated perception of health status, those who reported being in 'poor' health decreased from 45.9% to 21.3% after the education program, while those who saw their health as 'normal' increased from 26.2% to 49.2%. This result shows that there was an improvement in participants' perceptions of their health, with negative perceptions significantly reduced (P < 0.001). Considering self-rated perception of depression, the percentage of participants who said they were in a 'poor' mental state fell from 19.7% to 3.3%, while those responding as being at 'normal' increased from 29.5% to 36.1%, and 'good' responses increased from 50.8% to 60.7%. These results indicate that self-rated perceptions of depression also improved after the nutrition education program had taken place (P < 0.001).
Changes to dietary behaviors after nutrition education
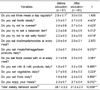
Participants' changes to their dietary behaviors after nutritional education are shown in Table 8. The total dietary behavior score increased from 28.1 to 31.2 after the education program (P < 0.001), and of the 12 questions, scores for 10 increased with statistical significance (P < 0.05). Scores were most drastically increased in the following questions: 'do you eat meats/fish/eggs/bean products daily?', 'do you eat fruits daily?', 'do you enjoy your meals?' (P < 0.01),'do you eat slowly?', 'do you try not to overeat?', 'do you try to have a balanced diet?', 'do you try not to eat salty foods?', 'do you eat foods cooked with oil in every meal?', and 'do you eat vegetables daily?' (P < 0.05).
Changes to nutrition screening initiative checklist score after nutritional education
Table 9 shows changes to the Nutrition Screening Initiative checklist scores after the nutrition education program. The total score on the Nutrition Screening Initiative checklist fell from 7.3 to 6.4, confirming that there were improvements in terms of nutritional risk level (P < 0.001). Scores dropped significantly for three questions, namely 'I eat alone most of the time' (P < 0.001), 'I eat fewer than two meals per day', and 'I eat fruits, vegetables, or milk products' (P < 0.05). When scores were classified by risk level, the percentage of subjects in the high-risk group fell from 63.9% to 60.7% after the education program, while the number within the the low-risk group rose from 9.8% to 13.1%. These results confirm that there were improvements in Nutrition Screening Initiative checklist scores after the nutritional education program.
Changes in nutrient intake after nutritional education
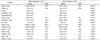
Changes in nutrient intakes after nutritional education are shown in Table 10. This indicates that intake of most nutrients increased significantly after the educational program. Energy intake increased from 72.8% of EER to 82.5% (P < 0.001), and the intake of protein (120.5 → 136.6% RI), fat, carbohydrate, calcium (51.6 → 60.7% RI), phosphorus (101.6 → 118.5% RI), iron (123.7 → 143.5% RI), vitamin A (79.8 → 120.6% RI), thiamin (67.4 → 78.9% RI), riboflavin (62.4 → 73.0% RI), niacin (88.2 → 103.4% RI), and vitamin C (72.4 → 85.0% RI) also increased after the educational program (P < 0.001). However, intakes of calcium, potassium, and riboflavin remained insufficient after the program, confirming the need for a proper nutritional assistance system that encourages the elderly to increase intake of these nutrients, which are more likely to be deficient in their diet.
Discussion
This study was designed to measure improvements to nutritional status after the application of a nutritional education program designed for elderly patients in a long-term care hospital. To analyze whether there were improvements in nutritional status, we compared changes in health behaviors, dietary behaviors, Nutrition Screening Initiative scores, and nutrient intakes.
In general, the purpose of nutrition education programs is to provide proper knowledge and information about nutrition-related issues, to draw attention to current dietary issues, to encourage modification of dietary behaviors and to increase participants' ability to practice healthy eating behaviors through a process involving 'knowledge, attitude, and practice' [6].
Although there have been conflicting results regarding the effect of nutritional education, recent studies conducted in Korea have indicated that nutritional education has a positive effect in improving dietary behaviors and nutritional status [6-9,15]. However, there are specific difficulties related to implementing nutritional education for the elderly. It is relatively hard to motivate this group to actively participate in educational programs. Elderly people may find it relatively difficult to understand the contents of the education and may tend to more easily forget what they have learned compared to other age groups [16]. Considering this, the nutritional education program in this study, from planning to implementation, was led by trained dieticians, whose role was to manage elderly patients' diet and who therefore understood their characteristics very well.
The nutritional status of the Korean elderly was reported to be lower than that of other age groups [2]. Among elderly people aged 65 or above, the percentage whose nutrient intake is insufficient is relatively high (14.6% for one year or older vs. 22.7% for 65 or older), while the rate of elderly people whose energy/fat intake exceeds the recommended level is rather low (4.5% for one year or older vs. 1.3% for 65 or older). In terms of sociodemographic factors, nutritional status is reported to be lower among elderly women than elderly men, and lower among the recipients of government assistance [17], among those who live alone [18-20], among people with a low educational level or low income [21-23], and among those living in a rural area [24]. The result of the Mini Nutritional Assessment (MNA), which was applied to recipients of the long-term care insurance system, including both the elderly people in long-term care facilities and those living at home, showed that those in care facilities had a better nutritional status than those living at home [11]. The studies that compared the nutritional status of low-income, elderly people living at home with that of elderly people in care facilities also reported that those staying in care facilities were less likely to skip meals and ate more diverse foods [25]. The reason for this difference is that those in care facilities are under nutritional care led by dieticians whereas those living at home, especially given the increasing number of nuclear families and single households, are less likely to have access to adequate diet management. However, care facilities may also have difficulties with providing appropriate nutrition management. The cost for nutrition management programs for patients in care facilities is not covered by insurance but by the patients themselves. Therefore, it is hard for them to receive specialized services such as nutritional assessment, nutritional education, individualized counseling or tube feeding. This study therefore tried to measure improvements to nutritional status when nutritional education was added to the existing meal management service for elderly patients in a long-term care hospital.
The results indicate that the application of a nutritional education program yielded positive changes in elderly patients in terms of their health behaviors, dietary behaviors, nutrient intake, and nutritional risk levels. After the program was completed, the elderly patients' negative perceptions about their health and depression level decreased while positive perceptions increased (P < 0.001). Previous studies showed that nutritional intervention may be more effective when participants have high interest in and awareness of their health status [10] and that elderly people who were highly depressed or under severe stress were more likely to be exposed to nutritional risk [26,27]. It is therefore expected that the positive changes in self-rated perceptions of health and depression following nutritional education will also have a positive impact on patients' nutritional status. This study further confirms that, after nutrition education, elderly patients' dietary behavior scores increased significantly (P < 0.05). Previous studies that applied nutritional education to healthy old men or elderly people with chronic diseases also reported that, after education, nutritional knowledge scores increased [6-8] and positive changes occurred in terms of dietary behaviors [7,8].
One of the core purposes of nutritional education is to encourage participants to change their behaviors by acquiring proper knowledge about what constitutes a healthy diet and thus to resolve their nutritional problems. The NSI checklist is a tool designed to check nutritional problems over relatively a long period of time, and it generally has limitations in measuring the effect of short-term nutrition education. In this study, improvement was confirmed in three assessment items out of the 10, suggesting changes in behavior could be observed even in a short period of time (I eat fewer than 2 meals per day/ I eat few fruits or vegetable, or milk products/ I eat alone most of the time) (P < 0.05). Due to the fact that the subjects were elderly, long-stay patients with chronic diseases, their nutrient intake was much lower than that of healthy counterparts. After nutrition education, however, their overall nutrient intake increased (P < 0.001). Some previous studies that applied nutritional education or intervention to elderly people with poor nutritional status also confirmed a positive effect, indicating that after nutritional education or intervention, intake of nutrients or foods was increased [6,8,9], while intake of sodium, which is harmful in excess, was decreased [7]. Even after nutritional education, however, elderly patients' intake of calcium, potassium, and riboflavin remained low in this study. This finding was also reported in other studies on the elderly, which showed that there were little improvements in terms of intake of essential nutrients such as iron, vitamin A, thiamin, and riboflavin [8,9]. These results suggest that in order to address the poor nutritional status of the elderly, a nutritional assistant system is needed, alongside a nutritional education program, so as to increase the intake of nutrients that more likely to be deficient in the diet of elderly populations.
In summary, after a nutritional education program was applied to the elderly, who comprised long-stay patients in a long-term care hospital, self-rated perceptions on health and on depression improved, positive changes occurred in dietary behaviors and nutritional risk levels, and there was an increase in nutrient intake. These results suggest that efforts designed to improve the nutritional status of the elderly could be more effective when a nutritional assistant program is combined with nutritional education. We hope that the results of this study can be used as preliminary data when establishing guidelines for nutritional management in elderly care facilities, the demand for which is expected to rise in the future.
 XML Download