

 PDF
PDF ePub
ePub Citation
 Print
Print


Introduction
Dietary life is the fundamental element affecting health maintenance. Individual dietary life is influenced by several environmental factors such as age, education, job, economic level, family status, and residence [1]. Housewives often have less time available to maintain their health due to typical homemaking duties, which include maintenance of familial dietary life and child care [2,3]. Women's social participation has recently increased the number of working housewives, resulting in changes in dietary patterns. Recently, the use of instant and processed foods has increased for reasons of convenience. Instant and processed foods are high-calorie foods and lead to safety problems when consumed regularly. Consequently, diseases associated with obesity and a sedimentary lifestyle have increased due to unbalanced diets.
Changes in the dietary intake of housewives, along with decreases in physical activity, have led to the social problem of obesity [4]. Obesity is the over accumulation of subcutaneous or abdominal fat that occurs when energy consumption decreases due to decreased activity [5,6]. The cause of obesity is a result of genetic, social, economic, and environmental factors, as well as various factors including physical form, physique, and concept of health [7-9]. Obese individuals tend to consume diets that have higher energy and fat contents than normal individuals [10,11]. Additionally, it has been reported that a 10% increase in body weight can result in changes in plasma cholesterol and triacylglycerol levels [5]. This is especially true for women over 40 years of age after menopause, who undergo decreases in female hormones and increases in abdominal fat. Women 40 and 50 years of age tend to suffer from lifestyle diseases, including hypertension and diabetes, and often have endocrinal disease and health problems after menopause [12,13]. In previous studies [14-16], it was reported that women 30 and 40 years of age tend to consume much more fruit, bakery goods, noodles, and beverages as snacks as well as favor processed food, resulting in obesity.
Many recent studies [17-22] have been conducted to evaluate familial dietary management, purchasing habits of food, preparation of side dishes, nutrition status, and food preferences, but studies on obesity after childbirth are insufficient so far.
Accordingly, this study surveyed the obesity rate by analyzing the patterns of obesity in women as a result of dietary habits and nutrient intake.
Subjects and Methods
Subjects and study period
This study surveyed 212 subjects aged 45 to 60 years from October to December 2010 in Seoul and the Kyunggi Area. The subjects were stratified according to their BMI into underweight (21), normal (133), and obese (58) groups. Questionnaires were given to survey dietary habits, nutrient intake, and BMI.
Anthropometric measurements and BMI
Height (Sam Hwa Co., Korean) and weight (Tanita Co., Japan) were evaluated by a well-trained technician. Body fat was analyzed using a Tanita BIA (bioelectrical impedance analyzer). To ensure the accuracy and reliability of the data, measurements were conducted by the same person. BMI values were calculated based on the measured heights and weights and stratified into underweight (BMI < 18.5 kg/m2), normal (18.5 kg/m2 ≤ BMI < 22.9 kg/m2), and obese (BMI ≥ 23 kg/m2) groups according to the Korea Obesity Association [23-25].
Survey of eating habits
Evaluation of eating habits was based on regularity of meal times, eating breakfast or not, reason for skipping meals, overeating, reason for overeating, eating out, preference for specific foods, and unbalanced meals.
Mini dietary assessment and types of snacks
A dietary life assessment survey [26] composed of ten questions was used to briefly assess the respondents' dietary habits. Specifically, questions with 3-point responses were given to the subjects (3 = Very often, 1 = Seldom). The results of the dietary life assessment were stratified into good (30~26), fair (25~18), and poor (under 17) groups. The types of snacks included milk and its products, fruit, bread, and potato, carbonated drinks and ices, fast food and fried foods, and the subjects were queried regarding their intake of snacks.
Intakes nutrition
Dietary intake information was collected using food-frequency questionnaires [27]. Detailed descriptions of a total of 100 types of foods, including 14 types of grains and grain products, 10 types of meat products, 18 types of marine products, 13 types of fruits, seven types of beverages, as well as information regarding snacks, dairy products, and others items, were collected.
Diet composition was analyzed according to each nutrient using the Computerized Nutrient Analysis Program 3.0 (CAN PRO 3.0, 8th edition, 2005). The nutrient intake of each subject was assessed based on the Estimated Average Requirement (EAR), Recommended Intake (RI), and Adequate Intake (AI), which are commonly used to assess the standard dietary intakes of women aged 50 to 64 years in Korea [28].
Health habit
Items of health such as sleeping time, exercise, frequency of exercise, duration of exercise, interest in health, and methods of maintaining health were surveyed.
Intake of supplements and disease
Supplement intake, types of supplements, disease suffering, types of disease, and rate of influenza were evaluated.
Statistical analysis
The difference among the means were determined by ANOVA, followed by Duncan's multiple range test using the SPSS package (version 13.0). The level of statistical significance was set at P < 0.05. Frequency, percentage, and differences among factors were analyzed by a χ2-test (P < 0.05).
Results
Anthropometric measurements and BMI
Physical characteristics and BMI are shown in Table 1. The average height, weight, and BMI of the women in this study were 156.0 ± 4.5 cm, 55.7 ± 6.3 kg, and 21.8 ± 2.3 kg/m2, respectively. The rates of height and weight that were larger than normal values were 94.3% and 65.1%, respectively. Significant differences among the three groups were observed (P < 0.05). The rates of underweight, normal, and obese individuals stratified by BMI were 10.0%, 62.5%, and 27.6%, respectively. The average BMI values of the underweight, normal, and obese groups were 18.0 ± 0.5 kg/m2, 21.1 ± 1.1 kg/m2, and 24.6 ± 1.4 kg/m2, respectively (P < 0.05).
Survey of eating habits
The data obtained from the survey of eating habits are shown in Table 2. Overall, 43.6% of normal and 41.4% of obese individuals reported that they ate three meals regularly, whereas only 23.8% of underweight individuals reported they ate three meals regularly (P < 0.05). In addition, 33.4% of underweight, 50.4% of normal, and 60.3% of obese individuals ate breakfast everyday, whereas 8.6% of the obese group and 9.5% of the underweight group never ate breakfast. The major reason for not eating breakfast was being too busy in the morning. Moreover, 52.4% of underweight, 36.1% of normal, and 27.6% of obese individuals never overate, whereas 2.3% of normal and 10.3% of obese individuals frequently overate. The most common reason reported for overeating was that the meal was delicious (P < 0.05). A total of 23.8% of underweight, 47.4% of normal, and 62.1% of obese individuals never ate out (P < 0.05). Those that did eat out favored Korean food. Finally, 57.1% of underweight, 55.6% of normal, and 62.1% of obese individuals ate an unbalanced diet frequently, whereas 3.0% of normal and 6.9% of obese individuals did not eat an unbalanced diet (P < 0.05).
Mini dietary assessment
A mini dietary assessment of housewives is shown in Table 3. Among the underweight group, 38.1% of subjects reported that they consumed more than one bottle of milk and its products, 52.4% of subjects ate more than one serving of fruit or one cup of fruit juice, and 52.4% of subjects ate a variety of foods everyday. Among the underweight group, 38.1% of subjects ate fried or roasted food more than twice a week.
Among the normal group, 50.0% of subjects reported that they ate vegetables besides kimchi, and 43.2% stated that they ate one piece of fruit and drank one cup of fruit juice daily. Additionally, 43.2% of the normal group ate three meals a day and 53.8% ate a variety of foods. Among the obese group, 46.6% of subjects ate one serving of fruit and drank one cup of fruit juice daily, 46.6% of subjects regularly ate three meals, and 48.3% ate a variety of foods. Meanwhile, 13.8% of housewives added source or salt to their meal.
The average value in the dietary assessment was 21.9 ± 2.9 (Table 4). Overall, 12.7% of subjects assessed their diet as good, 81.1% as fair, and 6.1% as poor. In addition, 28.6% of underweight, 12.8% of normal, and 6.9% of obese individuals reported that their dietary assessment was good.
Intakes snacks
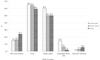
The rates of snack intake are shown in Fig. 1. Compared to other groups, the rate of snack intake was highest (15.0%) in the underweight group (P < 0.05). Among obese individuals, the rates of intake of milk and its products (24.1%) and fast and fried foods (5.6%) was higher compared to those of other groups (P < 0.05).
Intake of nutrients
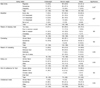
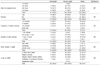
The rates of nutrient intake are shown in Table 5. The average energy intakes and intake rates of the underweight, normal, and obese groups were 2,223.6 ± 654.0 kcal (117.0%), 2,220.4 ± 674.9 kcal (169.9%), and 2,184.5 ± 604.8 kcal (115.0%), respectively.
The rates of protein intake of the underweight, normal, and obese groups were 225.8%, 223.8%, and 225.6%, respectively. The rates of intake of vitamin A in the underweight, normal, and obese groups were 1,104.1 ± 607.7 µgRE (169.9%), 1,200.1 ± 631.1 µgRE (184.6%), and 1,262.4 ± 683.6 µgRE (194.2%), respectively. No significant differences were observed in the intake of vitamin B1, B2, and B6. The rates of niacin intake in the underweight, normal, and obese groups were 140.7%, 137.9% and 137.9%, respectively. The rates of intake of vitamin C in the underweight, normal, and obese groups were 135.6%, 151.3%, and 153.5%, respectively.
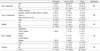
The rates of folic acid intake in the underweight, normal, and obese group were 339.9 ± 160.9 µg (85%), 417.3 ± 172.8 µg (104.3%), and 449.6 ± 193.7 µg (112.4%), respectively (P < 0.05). The rates of intake of vitamin E, calcium, iron, and zinc in the obese group were 16.5 ± 8.1 mg (165.0%), 1,166.0 ± 521.7 mg (166.6%), 24.0 ± 11.6 mg (171.4%), and 14.3 ± 8.0 mg (178.8%), respectively. The rates of intake of phosphorus among the underweight, normal, and obese groups were 228.6%, 232.7%, and 233.5%, respectively. The sodium intake rates in the underweight, normal, and obese groups were 349.8%, 367.8%, and 381.5%, respectively. The intake rates of cholesterol in the underweight, normal, and obese groups were 369.2 ± 203.7 mg, 304.5 ± 154.4 mg, and 315.8 ± 160.4 mg, respectively.
Health habit
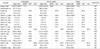
The health habits of housewives are shown in Table 6. The average sleeping time was 6-8 hours, with 57.1% of underweight, 74.2% of normal, and 70.7% of obese individuals falling within that range. Additionally, 66.7% of underweight, 62.9% of normal, and 63.8% of obese individuals exercised regularly, with 42.9% of underweight and 37.3% of normal individuals exercising three times weekly and 43.2% of obese individuals exercising 1 or 2 times a week. Duration of exercise in the underweight (57.1%) and normal group (52.4%) was 30 min to 1 hour, whereas 37.8% of the obese group exercised for only 1 to 2 hours weekly.
Overall, 28.6% of underweight, 16.7% of normal, and 12.1% of obese individuals appeared to have interest in health. All three groups reported that the major important factor for health was regular exercise.
Intake of supplement and disease
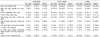
Intake of supplements and rates of disease are shown in Table 7. A total of 66.7% of underweight, 68.7% of normal, and 57.9% of obese individuals reported that they took health supplements. Among supplements, the rate of intake of vitamins was highest, followed by intake of synthetic medicine, calcium, and iron in order of decreasing amount.
Overall, 24.1% of the respondents reported that they are ill. Among the obese group, 43.0% had hypertension, 21.4% had thyroid disease, and 14.3% suffered from diabetes. In addition, 33.3% of underweight, 20.8% of normal, and 17.2% of obese individuals had influenza at the time of the survey.
Discussion
This study evaluated 212 female subjects (aged 45 to 60 years) in Seoul and the Kyunggi area to determine their rates of obesity through BMI and dietary factors related to obesity, including dietary habits, dietary assessment, and nutrient intake. The average height and weight of the subjects were 2 cm higher and 3.5 kg heavier, respectively, than the average values [28].
The rates of height and weight that were larger than normal values were 94.3% and 65.1%, respectively. For the underweight group, height was larger than the standard value while the weight was below normal. Among obese individuals, height was the same as the standard value while the weight was an average of 8.5 kg above normal. Overall, underweight, normal, and obese individuals comprised 10.0%, 62.5%, and 27.6% of the total group, respectively, when stratified according to BMI (P < 0.05). Rhie et al. [29] previously reported that the average height and weight are 156 cm and 54 kg, respectively, in the Youngin area, whereas Choi et al. [30] showed that the average height and weight are 160.20 cm and 54.05 kg, respectively, in the Daejun area.
The results of the present study indicate that 23.8% of underweight individuals ate regularly three daily meals, implying that underweight subjects ate three regular meals less often than normal and obese individuals (P < 0.05). Lee and Shim [31] reported that 61.8% of women in Seoul did not regularly eat three meals a day.
More than 50% of normal and obese subjects ate breakfast daily, whereas only 33.4% of underweight subjects answered that they regularly ate breakfast. The primary reason for skipping breakfast was being busy. Choi et al. [32] reported that 56.8% of subjects regularly eat breakfast, whereas Park et al. [33] found that 68.7% of subjects regularly eat breakfast and 10.6% of subjects never eat breakfast. Additionally, Lim and Na [34] reported that 43.7% of subjects eat breakfast and 39.8% of subjects do not eat breakfast because they are too busy, which is similar to the results of the present study.
In the present study, 35.4% of all subjects reported that they never overate (52.4% of underweight subjects never overate, and 2.3% of normal subjects and 10.3% of obese individuals frequently overate). The main reason for overeating was that the food was delicious (P < 0.05). Additionally, a total of 49.1% of all subjects reported that they never ate out, whereas 62.1% of obese subjects never ate out (P < 0.05).
Among the underweight group, the rates of intake of milk and its products as well as one serving of fruit and one cup of fruit juice were high, and a greater percentage (52.4%) of these subjects ate a balanced diet compared to the obese group. In the normal group, the rates of eating vegetables other than kimchi as well as one serving of fruit and one cup of fruit juice were higher than in the other groups, and a high percentage of these subjects ate three balanced meals daily. Among the obese group, the rates of eating one serving of fruit, one cup of fruit juice, and eating a balanced diet was high.
The average dietary assessment was 21.9 ± 2.9. Overall, 12.7% of the subjects answered that their dietary life was good; however, only 6.9% of obese individuals reported that their dietary assessment was good.
Among underweight subjects, the rate of intake of carbonated drinks and ice was significantly higher than those of other groups (P < 0.05). In the obese group, the rate of intake of milk and its products was 24.1%, whereas that of fast food and fried food was 5.6%, and these rates were higher compared to those of the normal group (P < 0.05).
Average energy intake rates of the underweight, normal, and obese groups were 2,223.6 ± 654.0 kcal (117.0%), 2,220.4 ± 674.9 kcal (169.9%), and 2,184.5 ± 604.8 kcal (115.0%), respectively.
These values were higher than the KDRI values (EAR: 1,800 kcal) for the groups [28]. In a previous study [29], it was reported that the daily energy intake of women in the Youngin area is 1,770.3 ± 249.2 kcal. Jang [35] showed that the daily energy intake is 2,123.7 ± 518.4 kcal. Additionally, Park and Choi [36] reported that the energy intake of women in the Taegu area is 2,247.0 ± 415.0 kcal, with that of obese individuals being 2,157.0 ± 375.0 kcal. These differences in energy intake among studies are likely due to differences in survey time and area. The rates of intake of protein, vitamin A, vitamin B1, B2, and B6, niacin, vitamin C, and vitamin E in all three groups were higher than the KDRI values [28].
The average intakes of folic acid in the underweight, normal, and obese groups were 339.9 ± 160.9 µg (85%), 417.3 ± 172.8 µg (104.3%), and 449.6 ± 193.7 µg (112.4%), respectively (P < 0.05). The intake rate of folic acid in the obese group was significantly higher than those of the underweight and normal groups (P < 0.05). Folic acid plays a crucial role in the synthesis of amino acids, nucleic acids, formation of red blood cells, cell growth, hematogenus function, fetal growth, and anabolism, especially during pregnancy [37]. Macrocytic anemia, abortion, and retardation of nerve growth are all associated with folic acid deficiency [38]. Therefore, intake of folic acid must be increased by women during pregnancy.
The rates of calcium, zinc, and sodium intake were in excess compared to the KDRI values [28]. Sodium intake rates of the underweight, normal, and obese individuals in this study were 349.8%, 367.8%, and 381.5%, respectively. In previous reports [29,39], it was reported that sodium intake was 4,330.0 ± 1,779.2 mg and sodium intake was too high (5,190 mg) in some industry. Chang [40] suggested low sodium intake during growth before reaching middle age, since excess sodium intake is associated with hypertension. Accordingly, Chang [40] stated that sodium intake should be kept low in processed foods and printed clearly on the packaging. Further, foods high in dietary fiber such as vegetables or fruits are recommended to be consumed everyday.
Cholesterol intake rates in the underweight, normal, and obese groups were 369.2 ± 203.7 mg, 304.5 ± 154.4 mg, and 315.8 ± 160.4 mg, respectively. In a previous study [41], it was recommended that one's cholesterol intake be under 300 mg daily and 100 mg per 1,000 kcal in order to prevent cardiovascular disease. In this study, it appeared that cholesterol intake was higher compared to a previous report [41]. In another report [42], nutrient intake varied according to the sample area. For example, fat intake was high in Taegu area, whereas intake of iron, vitamin B1, B2, niacin, and vitamin C was high on Hansan island.
The average sleeping time of subjects was 6 to 8 hours. A total of 66.7% of underweight, 62.9% of normal, and 63.8% of obese individuals reported that they spent time exercising. Specifically, the average frequency of weekly exercise for underweight and normal individuals was three times, whereas 43.2% of the obese group exercised one or two times weekly. Duration of exercise for the underweight and normal group was 30 minutes to 1 hour, whereas 37.8% of obese individuals exercised for 1 to 2 hours per week. The most important factor for health among all three groups was exercise. Middle-aged women had endocrinal problems and chronological syndromes related to post-menopause [43]. It has been shown that management of health factors related to chronological diseases is necessary during middle age to achieve longevity [44]. Education regarding exercise and nutrition has been shown to be necessary to prevent obesity and metabolic diseases [43].
Accordingly, the moderated of exercise for middle-aged women must be preferred them unreasonable diet. In a previous study [40], 56.0% of women answered that a controlled diet and exercise are essential to maintain health. In addition, 52.7% of subjects agreed that they must lose weight. The rate of supplement intake was low in the obese group. The most common supplement among all subjects was vitamin tablets, followed by synthetic medicine, calcium, and iron tablets in order of decreasing amount. Lee et al. [45] has reported that the reasons for taking supplements are maintenance of health, to supply nutrients, and recover from tiredness.
A total of 24.1% of the obese group suffered from disease at the time of the survey. The most common disease was hypertension (43.0%). Further, 33.3% of underweight subjects were susceptible to influenza. Therefore, this study concluded that women in the underweight group must eat a balanced, regular diet to raise their level of immunity against influenza infection.
The results of this study show that the underweight group tended to not eat three regular meals daily and had very low rate of eating breakfast. Conversely, the rate of overeating among the underweight group was low, although the rates of consuming milk and its products as well as one serving of fruit and one cup of fruit juice per day were high. Women in the underweight group also consumed carbonated drinks and ice frequently, resulting in lower folic acid intake compared to standard values. Women in the obese group commonly ate one serving of fruit and one cup of fruit juice daily, and they tended to consume nutrients in excess. The rate of hypertension was high among obese women, although their frequency and duration of exercise were greater than those of the underweight and normal groups.
In conclusion, the results of this study demonstrate that it is essential not to consume excessive amounts of nutrients. New programs to assess dietary habits and diagnose health status should be developed to enable maintenance of physical health among the respondents.


 XML Download