

 PDF
PDF Citation
 Print
Print


INTRODUCTION
Synovitis, capsulitis and destruction of the articular cartilage are closely related events, and one of these conditions may initiate or exacerbate the others [1]. Benito et al. [2] reported that the synovial tissues of patients have significantly more inflammatory mediators in early osteoarthritis than in late osteoarthritis, indicating that activation of the pathophysiological pathways that lead to progressive cartilage loss is an early event.
Corticosteroids, including triamcinolone acetonide (TA), are among the most frequently used therapeutic agents to treat early osteoarthritis owing to its highly effective anti-inflammatory properties [3]. Nevertheless, this therapy has drawbacks, as described in many reports, including possible deleterious effects on the cartilage and bone structures [4].
An alternative therapeutic approach that has been introduced in equine practice in the 1990s is known as “viscosupplementation” [5]. Hyaluronic acid (HA) is responsible for most of the viscoelastic properties of the synovial fluid (SF). The intra-articular injection of HA has been proposed as a potential treatment to restore the viscoelastic properties of the SF, improving its mechanical function [6].
HA is also a prominent component of the extracellular matrices, and binds with high affinity to the cell membrane receptor CD44, which is expressed by many cell types, including leukocytes and synoviocytes, and thus may modulate the inflammatory response by different mechanisms [7], such as the downregulation of prostaglandin E2 (PGE2) synthesis [8], and reduction of reactive oxygen species by activating Akt in chondrocytes [9].
Recently, many studies have examined the influence of the HA molecular weight upon its biological properties. Moreover, it was shown that high and intermediate molecular weight HA (1,800–50 kDa) increased the healing process, whereas the very low molecular weight HA (6 kDa) caused inflammation [10]. Other studies have also suggested pro-inflammatory activity for low molecular weight hyaluronic acid (LMW-HA) in various pathological processes [1112]. A systematic review by Altman et al. [13] showed that in vitro high molecular weight hyaluronic acid (HMW-HA) has superior chondroprotective, anti-inflammatory, mechanical, and analgesic effects, thereby activating proteoglycan/glycosaminoglycan synthesis, but it is unclear if this will influence the clinical signs. On the other hand, one meta-analyses comparing the intra-articular administration of different HA preparations has shown that the risks of systemic adverse events and post-injection flares were double for HMW-HA than for LMW-HA (or intermediate molecular weight HA) [14].
In horses, Aviad et al. [15] did not observe any significant clinical differences between intra-articular treatments with HMW-HA (3.8 × 10⁶ Da) and LMW-HA (0.15 × 10⁶ Da), whereas Filion and Phillips [16] showed superior clinical effects for HMW-HA over LMW-HA. Regarding the biological turnover of HA, no significant difference among HA with different molecular weights were observed [17]. Recently, the anti-inflammatory effects of a mixture of HMW-HA and LMW-HA were superior to either LMW-HA or HMW-HA [18].
The hypothesis of this study was that intra-articular LMW-HA or HMW-HA could have chondroprotective effects on the articular cartilage, and prevent SF HA breakdown, preserving the SF viscoelastic properties. Their anti-inflammatory actions were also examined. Acute synovitis was induced in horses by the intra-articular injection of lipopolysaccharide (LPS), and these joints were treated with either TA, which are considered the gold standard for this disease and used as control, or with LMW-HA or HMW-HA. The clinical features of the joints submitted to the different treatments, as well as their anti-inflammatory, antioxidant and chondroprotective activities were assessed in the SF.
MATERIALS AND METHODS
Experimental design
The present study was approved by the Ethical Committee of the University of São Paulo (USP) – CEUA/USP (4376260615), and was carried out in accordance with the USP guidelines, and also in accordance with the Animal Research: Reporting of In Vivo Experiments (ARRIVE) guidelines and EC Directive 2010/63/EU for animal experiments (http://ec.europa.eu/environment/chemicals/lab_animals/legislation_en.htm).
This study included 12 clinically healthy Purebred Arabian horses (males; mean age of 3.2 years), which were non-athletes and had no history of joint diseases; thus, a total of 24 metacarpophalangeal joints were evaluated. All horses were evaluated for lameness and the normality of the joints was determined by radiography and ultrasonography exams.
The 24 metacarpophalangeal joints were assigned randomly to 3 groups in a way that the same horse did not receive the same treatment (8 per group): a control group treated with TA and 2 experimental groups treated with LMW-HA (approximately 40 kDa) or HMW-HA (approximately 1,350 kDa). LMW-HA and HMW-HA were obtained from R&D Systems Inc. (USA), and produced by the microbial fermentation of Streptococcus pyogenes. Each metacarpophalangeal joint was treated only once, and the horses were allowed a 30-day rest period between the treatment of each joint.
Initially, intra-articular injections of sterile phosphate buffered saline (PBS, 1 mL) containing 0.25 ng of Escherichia coli LPS (from E. coli O55:B5, catalog #L5418; Sigma-Aldrich, USA) were administered to one joint of each animal. Only one metacarpophalangeal joint of each animal was used at any time. The horses were housed in single 12 m2 boxes (3 × 4 m) and fed pellets (1% of the animal body weight), coast cross hay, and water ad libitum.
Before LPS administration, SF samples were collected (time 0) for the baseline determinations. Arthrocentesis was always performed by the same operator. One hour later, the control group was treated with intra-articular TA (10 mg, 1 mL; Apsen Farmacêutica, Brazil), whereas the LMW-HA and HMW-HA groups received 1 mL either LMW-HA or HMW-HA, respectively, at 20 mg/mL. The animals were assessed three times a day to any signs of discomfort.
Sample size calculation
The sample size calculation was defined to allow 80% statistical power for chondroitin sulfate (CS) and interleukin (IL)-1 to detect a 30% difference between the groups with a 2-sided alpha level of 0.025 and β = 0.20 based on 2-way analysis of variance (ANOVA).
Randomization
A block design randomization was used because three conditions (treatments) and two joints for each horse (2 joints) were tested. To avoid order effects for each treatment, as well as to have an equal number of repetitions, 12 cards were used with the possible pairs of treatments, and the order of the metacarpophalangeal joint (R/L or L/R) used. The cards were kept in an envelope, and for each horse, the card was drawn at the time of the treatment to address concealment. Therefore, the investigator was blinded to the treatment allocation and the joint that would be used first until the time for the first injection.
Joint clinical evaluation
Joint evaluation was carried out before the LPS injection (time 0), and 8, 24, and 48 h after LPS. The evaluation consisted of the following: 1) palpation for heat, pain, and alteration in the consistence and measurement of joint circumference using a tape-measure (cm); 2) lameness examination by the Lameness Locator system, which aims to quantify the degree of lameness objectively during the experiment [19].
SF analysis
The SF samples were collected aseptically at time 0 (before LPS injection), and 8, 24, and 48 h after LPS. An aliquot (500 µL) of the collected fluid was processed immediately for the white blood cell (WBC) count and oxidative burst evaluation (by flow cytometry). The remaining 3–4 mL were centrifuged at 2,000 × g for 15 min at 4°C, and the supernatant was aliquoted and stored at −80°C for analyses of glycosaminoglycans, cytokines, and PGE2. The WBC counts were performed in a Neubauer chamber using in natura aliquots.
The SF PGE2 level was quantified using a commercially available enzyme-linked immunosorbent assay (ELISA) kit – Monoclonal (Cayman Chemical, USA), whereas IL-1, IL-6, IL-10, and tumor necrosis factor (TNF)-α were quantified using an equine cytokine/chemokine panel (MILLIPLEX MAP; EMD Millipore Corporation, Ireland) based on Luminex xMAP Technology (Luminex Corporation, USA). All determinations were performed in duplicate.
For the analysis of glycosaminoglycans (sulfated and HA), SF samples (100 µL) were submitted to proteolysis (4 g/L maxatase in 0.05 M Tris-HCl, pH 8.0, 200 µL). After incubation overnight at 50°C, maxatase was heat inactivated and the debris was removed by centrifugation. The supernatant was collected, frozen, dried, and resuspended in 50 µL of water. The identification of SF glycosaminoglycans (HA and CS) were performed by a combination of agarose gel electrophoresis (0.55%) in a 0.05 M 1,3-diaminopropane-acetate (PDA) buffer, pH 8.0, and differential staining of sulfated and non-sulfated glycosaminoglycans by Toluidine Blue at different pH [20]. These compounds were quantified by densitometry of the electrophoresis gel slabs.
The HA molecular weight was determined by electrophoresis in 1% agarose gels in 0.04 M Tris-acetate-ethylenediaminetetraacetic acid (EDTA) (TAE) buffer, pH 8 (0.02 M acetate, 0.01 M EDTA), as described previously [21]. The gels were calibrated with HA of known molecular weights (Select-HA; Sigma-Aldrich), and two HA standards of known molecular weights were used on each gel slab: rooster comb HA, 2 mg/mL (modal molecular weight of 800 kDa), and bovine trachea HA, 1 mg/mL (modal molecular weight of 20 kDa). Bromophenol Blue was used as an indicator of the migrated distance. After electrophoresis, the gels were stained with 0.1% Toluidine blue in 0.025 M sodium acetate buffer, pH 5, 15 min, and the excess of dye was removed by washing with 0.025 M sodium acetate buffer. The migration patterns and migrated distances were measured by densitometry. The migration distances were inversely proportional to the logarithm of the HA molecular weight (low molecular weight 0–500 kDa; median molecular weight ≥ 500 and < 2,000 kDa; high molecular weight ≥ 2,000 kDa).
The oxidative burst was evaluated by flow cytometry using a FACS Calibur cytometer (BD, USA) using the SF samples collected at 0, 8, 24, and 48 h. The oxidative burst from leukocytes and synovial cells was evaluated by direct measurements of the mean fluorescence of green channels that are directly proportional to the reactive oxygen species generated, and the analyses were performed using FlowJo software (Tree Star Inc., USA). The fluorescence data were recorded on a logarithmic scale and the green dichlorodihydrofluorescein fluorescence was measured at 530 ± 30 nm (FL-1 detector). The quantification of the oxidative burst was estimated by the average fluorescence intensity/cell and the results are expressed as mean fluorescence intensity (MFI).
Statistical analysis
The distribution of the residuals of the observed values was evaluated using Shapiro–Wilk tests; the variables that did not show a normal distribution were transformed according to the method described by Templeton [22]. The variables were analyzed using the 2-way ANOVA model, considering the treatment factors, time, and interaction between both. Post hoc analysis was performed using a Fischer's LSD test. The significance level was set to 5%. To examine the molecular weight of HA, the percentage of HA-HMW was divided in 3 categories: high (above 68%), median (between 33% and 67.99%), and low (between 0% and 32.99%). The Wilcoxon Signed Rank test was used to evaluate the frequency of samples graded in different categories of HA-HMW (high, median, and low). The SPSS Statistics 20 software was utilized (IBM Corp., USA).
RESULTS
Local effects of LPS and treatments
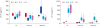
Fig. 1 shows that the joint circumference increased significantly in all groups 8 h after LPS administration (p < 0.0001). The TA-treated animals returned to their baseline at 24 h but the joints of the horses treated with HA, irrespectively of their molecular weights, remained high up to 48 h (in comparison to their respective baselines). Compared to the TA-treatment, LMW-HA was unable to control joint swelling over time (24 and 48 h), which is in contrast to the HMW-HA, that reduced the swelling to the same levels of the TA-treated animal (48 h).
Fig. 1
Local effects of LPS injection and treatment with TA or HA of low (LMW-HA) or high (HMW-HA) molecular weights. The joint circumference, lameness evaluation (Lameness Locator), WBC counts, and SF PGE2 concentrations are shown as BoxPlots for all 3 groups, indicating the median (−), mean (×), first and third quartiles.
LPS, lipopolysaccharide; TA, triamcinolone acetonide; HA, hyaluronic acid; LMW-HA, low molecular weight hyaluronic acid; HMW-HA, high molecular weight hyaluronic acid; WBC, white blood cell; SF, synovial fluid; PGE2, prostaglandin E2.
*Differences statistically significant compared to the baseline values (p < 0.05); †Differences statistically significant compared to the TA group (p < 0.05).
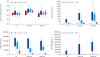
The lameness was assessed by the Lameness Locator, as described in Methods. Fig. 1 shows that all animals showed lameness at 8 h, which decreased afterwards, but did not return to the baseline values (all groups). Compared to the TA-treated group, only the animals treated with HMW-HA showed higher vector sum values at 8 and 24 h, indicating higher degrees of lameness (p = 0.04 and p = 0.005, respectively).
The WBC count in the SF (Fig. 1) was increased more than 200 times 8 h after LPS, irrespective of the TA- or HA-treatments. This number decreased slowly (24 and 48 h). At 24 h, only the LMW-HA treatment caused a significant decrease in the WBC count compared to the TA group (p = 0.048), whereas both LMW-HA and HMW-HA treatments caused more prominent decreases in the cellularity of the SF at 48 h.
Regarding PGE2, compared to time 0 (TA = 36 pg/mL; LMW-HA = 48 pg/mL; HMW-HA = 45 pg/mL), enormous increases occurred in all groups at 8 h (TA = 19,552 pg/mL; LMW-HA = 50,400 pg/mL; HMW-HA = 63,849 pg/mL), (p < 0.001). In the HA-treated joints, the PGE2 concentrations increased even further. These values decreased with time and were near the baseline after 24 h (even though the differences were still statistically significant, p = 0.05). At 48 h, the mean PGE2 concentrations were as follows: TA = 78 pg/mL; LMW-HA = 321 pg/mL; HMW-HA = 264 pg/mL.
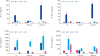
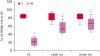
Compared to the corresponding baseline values, all groups exhibited an increase in the IL-1 and IL-6 concentration in the SF at 8 h (p = 0.03 for TA; p = 0.04 for LMW-HA; and p = 0.03 for HMW-HA) and 24 h, respectively (p = 0.04 for TA; p < 0.001 for LMW-HA; and p = 0.03 for HMW-HA). The SF TNF-α concentrations were higher in the TA and HMW-HA groups at 8 h than at time 0 (p < 0.0001 and p = 0.008, respectively). The LMW-HA group showed lower concentrations of TNF-α and IL-6 at 8 h compared to the TA (p = 0.001 and p = 0.04, respectively) and HMW-HA groups (p = 0.01 and p = 0.04, respectively), and lower concentrations of IL-10 at 48 h compared to the TA group (p = 0.03) (Fig. 2).
Fig. 2
IL-1, TNF-α, IL-6, and IL-10 concentrations (pg/mL) in the SF of TA, LMW-HA and HMW-HA groups. Quantitative data are given as BoxPlots showing the median (−), mean (×), first and third quartiles for each experimental group.
IL, interleukin; TNF, tumor necrosis factor; SF, synovial fluid; TA, triamcinolone acetonide; LMW-HA, low molecular weight hyaluronic acid; HMW-HA, high molecular weight hyaluronic acid.
*Differences statistically significant compared to the baseline values (p < 0.05); †Differences statistically significant compared to TA group (p < 0.05).
Agarose gel electrophoresis of HA and CS
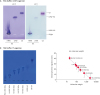
The main SF glycosaminoglycans were HA (approximately 600 µg/mL) and CS (approximately 50 µg/mL) [23]. These glycosaminoglycans were identified and quantified by 0.55% agarose gel electrophoresis in PDA buffer, and stained with Toluidine blue at pH 1 (for sulfated glycosaminoglycans) and 5 (for sulfated and non-sulfated glycosaminoglycans), as described in the Methods section. As expected, at pH 1, only CS (and trace amounts of HA) were stained, whereas at pH 5, both CS and HA were stained. Fig. 3A presents representative images of these gel slabs. The HA molecular weight was estimated by its electrophoretic migration in 1% agarose gel electrophoresis, in TAE buffer. Electrophoretic migration was inversely proportional to the logarithm of the chain sizes (Fig. 3B).
Fig. 3
Agarose gel electrophoresis of HA of high (HMW-HA) and low (LMW-HA) molecular weights and of CS in PDA buffer (A), and electrophoretic migration of HA of different molecular weights in TAE buffer (B). The migration distances were measured by densitometry and plotted against the logarithm of the molecular weights.
HA, hyaluronic acid; HMW-HA, high molecular weight hyaluronic acid; LMW-HA, low molecular weight hyaluronic acid; CS, chondroitin sulfate; PDA, 0.05 M 1,3-diaminopropane-acetate; TAE, Tris-acetate-ethylenediaminetetraacetic acid.
SF glycosaminoglycans
Fig. 4 shows representative agarose gel electrophoresis results of glycosaminoglycans isolated from the SF, submitted to 0.55% agarose gel electrophoresis in PDA buffer, stained at either pH 5 (showing both HA and CS) or pH 1 (CS and trace amounts of HA). The samples from horses treated with TA, LMW-HA or HMW-HA are shown. In all samples, 2 main bands appeared: a fast migrating band, which was identified as CS; and a slow migrating smear, identified as HA. These bands were measured by densitometry; Fig. 5 shows the quantitative data.
Fig. 4
Representative agarose gel electrophoresis of SF glycosaminoglycans.
SF, synovial fluid; TA, triamcinolone acetonide; LMW-HA, low molecular weight hyaluronic acid; HMW-HA, high molecular weight hyaluronic acid; CS, chondroitin sulfate; HA, hyaluronic acid; Or., origin; St, standard glycosaminoglycans.
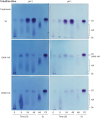
Fig. 5
Quantitative data of SF HA and CS obtained by densitometry of agarose gel slabs. Quantitative data are given as BoxPlots showing the median (−), mean (×), first and third quartiles for each experimental group.
SF, synovial fluid; HA, hyaluronic acid; CS, chondroitin sulfate; TA, triamcinolone acetonide; HA, hyaluronic acid; LMW-HA, low molecular weight hyaluronic acid; HMW-HA, high molecular weight hyaluronic acid.
*Differences statistically significant compared to baseline values (p < 0.05); †Differences statistically significant compared to TA group (p < 0.05).
LPS caused a decrease in the HA concentration, which was not recovered by the HA treatments. Regarding the HMW-HA treatment, the increase observed at 8 h was possibly due to the exogenous high molecular weight HA, which migrated as the endogenous HA (Fig. 4, pH 5). Nevertheless, this exogenous HA was no longer present at 24 and 48 h. For LMW-HA, which migrated slightly less than CS (Fig. 4, pH 5), the exogenous HA did not interfere with the quantification of endogenous HA, which remained low until the end of the experiment. For the TA group, the SF HA concentration decreased at 8 and 24 h, returning to the baseline values at 48 h. Indeed, the SF from horses treated with TA had, on average, the highest concentration of HA at 48 h, which was significantly different from that of the HA groups (p < 0.001) (Table 1).
Table 1
The HA levels (ug/mL) for the TA- and HA-treated groups throughout the experiment

Two-ways analysis of variance: treatment (0.003), time (0.008), treatment*time (< 0.001), post hoc LSD test. Data shown are mean concentrations ± standard deviations.
HA, hyaluronic acid; TA, triamcinolone acetonide; LMW-HA, low molecular weight hyaluronic acid; HMW-HA, high molecular weight hyaluronic acid.
The capital letters indicate a statistically significant difference between treatments; the lowercase letters indicate a statistically significant difference between each time and time 0.
Table 2 shows that in TA-treated animals, the SF CS concentrations increased from 8 h, and achieving very large values at 24 and 48 h (15 × normal, mean up to 700 µg/mL) (p < 0.001). In contrast, in HA-treated joints, the CS did not increase at 8 h, increased significantly less at 24 h, and almost returned to the baseline at 48 h. The CS concentrations peaked at 24 h, indicating that they were at the recovery phase at 48 h. These findings suggest that the SF CS is a product of aggrecan digestion in the cartilage matrix, which was possibly induced by LPS, either increased or unaffected by TA, and inhibited by HA.
Table 2
The CS levels (µg/mL) from the TA- and HA-treatment groups throughout the experiment

Two-ways analysis of variance: treatment (< 0.001), time (< 0.001), treatment*time (0.002), post hoc LSD test. Data shown are mean concentrations ± standard deviations.
CS, chondroitin sulfate; TA, triamcinolone acetonide; HA, hyaluronic acid; LMW-HA, low molecular weight hyaluronic acid; HMW-HA, high molecular weight hyaluronic acid.
The capital letters indicate a statistically significant difference between treatments; the lowercase letters indicate a statistically significant difference between each time and time 0.
SF HA molecular weight
To investigate the effects of these treatments on the LPS-induced synovitis, the molecular weights of the HA chains present in the SF of each group were analyzed at times 0 and 48 h (Fig. 6). Surprisingly, despite the highest concentration of HA, the TA-group showed a dramatic decrease in the relative amounts of high molecular weight HA (p = 0.014), indicating HA degradation. The mean HA molecular weight decreased in the LMW-HA group (p = 0.046) but to a lesser degree (p < 0.001).
Fig. 6
Percentage of HMW-HA in the SF. The HA molecular weight was determined by electrophoresis, and the migration patterns and distances were obtained by densitometry. The figure shows the amounts of HMW-HA relative to the total HA concentrations.
HMW-HA, high molecular weight hyaluronic acid; SF, synovial fluid; HA, hyaluronic acid; TA, triamcinolone acetonide; LMW-HA, low molecular weight hyaluronic acid.
*Differences statistically significant compared to the baseline values (p < 0.05); †Differences statistically significant compared to the TA group (p < 0.05).
This HA degradation could be induced either by the increased expression/activity of hyaluronidases or by the action of oxygen/nitrogen reactive species. Therefore, the oxidative burst (expressed as the MFI) was measured. The MFI increased at 8, 24, and 48 h after LPS (p < 0.001), irrespective of the TA- or HA-treatments. This suggests that HA degradation could be due to oxidative processes. The hyaluronidases, as well as the hyaluronan synthases, remain to be analyzed.
DISCUSSION
Given the importance of synovitis in the pathophysiology of OA, a well-described experimental model was used to induce acute inflammation in equine joints by an intra-articular injection of 0.25 ng of LPS without causing systemic effects [2425]. The increased joint circumferences indicated that all groups had responded to the LPS stimulus, and the joints swelled at 8 h. The TA-treated animals returned to their baseline at 24 h but the swelling persisted until 48 h post-injection in the HA-treated groups being higher for LMW-HA. Lucia et al. [26] reported that LPS-induced swelling (0.25 ng) persisted for up to 24 h with no treatment. These results suggest that the TA-treatment reduces the level of swelling significantly (Fig. 1).
Early evidence of synovitis was also demonstrated by the Lameness Locator, which revealed an abnormal gait in all groups 8 h post-LPS. According to McCracken et al. [27], this system was more sensitive in detecting lameness than a subjective evaluation, even when carried out by experienced veterinarians, and produced quantitative results. The lameness severity in horses was higher in the HA-treated animals at 8 h, particularly those of the HMW-HA group. The TA-treated group showed the smallest amplitude of lameness (vector sum) at 8, 24, and 48 h, which could be explained by the recognized anti-inflammatory action of TA. On the other hand, the lameness almost disappeared at 48 h in all groups.
A previous study [26] reported that the lameness scores increased up to 24 h in response to the intra-articular injections of LPS and repeated arthrocentesis. In the present study, both treatments, TA and HA, promoted a decrease in the lameness scores at 24 and 48 h post LPS injection. These findings are in agreement with other reports, which showed that an intra-articular injection of TA can control inflammation and pain in lame horses [24]. White et al. [28] also observed the efficacy of HA in the relief of lameness.
To analyze the SF composition, serial collections of SF were made at 0, 8, 24, and 48 h. The serial articular puncture itself may impart mechanical stress to the synovial membrane, causing a transient inflammatory response [2930], but with lower magnitudes than those induced by an intra-articular injection of LPS [26].
Previous studies have shown that LPS increases the synovial WBC count [25], PGE2, and glycosaminoglycan concentrations [2426]. In the present study, the WBC counts were significantly higher 8 h after an LPS injection in all groups, achieving 100,000–200,000 cells/µL (compared to a baseline of 200–400 cells/µL), and decreased afterwards. Interestingly, the WBC counts decreased faster in the HA-treated joints than in the TA-treated ones, and at 48 h, the mean values in the LMW-HA, HMW-HA, and TA groups were 12,475 cell/µL, 8,463 cells/µL, and 32,713 cells/µL, respectively. Although TA is a potent analgesic and anti-inflammatory medication for acute synovitis, an intra-articular treatment with TA induced higher WBC counts [31], which may explain the slower decrease in WBC in TA-treated group.
The most well recognized effect of TA as an anti-inflammatory agent is its ability to inhibit phospholipase A2, which prevents the release of arachidonic acid from the membrane phospholipids. As arachidonic acid is the substrate for cyclo-oxygenases to form eicosanoids, the synthesis of prostaglandins is inhibited [32]. The finding that TA was more effective in inhibiting PGE2 synthesis than HA agrees with this concept.
The LMW-HA group, but not the HMW-HA group, showed a lower concentration of SF TNF-α and IL-6 than the TA group. Other studies reported that equine fibroblast-like synovial cells exposed to LPS showed increased concentrations of IL-6, but the cells treated with HMW-HA had significantly better viability and morphology scores and lower concentrations of IL-6 than the untreated LPS-exposed cells [33]. Furthermore, HMW-HA can suppress the LPS-activated PI3K/Akt pathway, leading to the downregulation of nuclear factor (NF)-κB with decreased IL-6 production through an interaction with intercellular adhesion molecule 1 [34]. HMW-HA also had an anti-inflammatory effect mediated by the down-regulation of TNF-α in fibroblast-like synoviocytes. These effects occur through an interaction of high molecular weight HA with CD44 [7]. The fact that LMW-HA was more efficient than HMW-HA in inhibiting the production of these cytokines (Fig. 2) requires further examination.
A previous study [35] reported that a treatment with either TA or HA can maintain the chondrocyte morphology in culture and protect chondrocytes from the toxic effects of LPS. Nevertheless, TA had no chondroprotective effect because the CS concentration in the TA-treated animals achieved very high levels, suggesting cartilage matrix digestion. The SF CS is a reliable biomarker for the cartilage catabolism and comes from the partial digestion of aggrecan [232930]. LPS induces an increase in the SF CS concentration [24], and TA leads to the increased expression of matrix metalloproteases, increasing even more than aggrecan digestion, which increases the severity of cartilage structural damage, chondrocyte loss, and aggrecan loss in the OA cartilage [36].
Matrix metalloproteinase (MMP)-13 was also measured in the SF samples (data not shown), but the anti-MMP13 used cross reacted with other horse SF components. Therefore, it was impossible to quantify the expression of this enzyme. Another possibility was to quantify aggrecan degradation through specific epitopes, but all the available antibodies were developed with human aggrecan and may not recognize horse antigens.
The results of the effects of triamcinolone on chondrocytes and cartilages differed according to the authors. Some in vitro chondrocyte investigations concluded that triamcinolone is chondrotoxic at a 5 and 10 mg/dose. On the other hand, other in vivo animal and human clinical studies support the possible chondral protective effect of triamcinolone on injury or osteoarthritis [37]. In the present study, an enormous increase in the SF CS was observed upon the LPS and TA-treatment. In contrast, treatment with HA inhibited the build-up of CS in the SF. Previous studies have shown that the anticatabolic properties of HA may involve Toll-like receptor 4 (TLR-4), blocking the intracellular signaling pathways that would otherwise initiate inflammatory and catabolic cascades, and/or activation of the cellular receptors linked to anti-inflammatory signaling, such as NF-κB, ICAM-1, and CD44 [123839]. The addition of low molecular weight HA could decrease the chondrotoxicity of TA in normal chondrocytes, as observed by the chondrocyte viability [36].
The TA-induced digestion of both cartilage aggrecan and SF HA could be mediated by enzyme induction and/or oxidative stress. In the present study, the oxidative burst in the TA-treated joints was similar to that of the HA-treated joints and could not explain the digestion of these macromolecules.
Small fragments of HA in the SF have been associated with catabolic and pro-inflammatory states; they may induce an increase in the expression of matrix metalloproteinases that can degrade extracellular matrix components and can bind to the CD44 receptors and initiate the intracellular signaling pathways that lead to the expression of inflammatory mediator genes [1240]. Overall, the depolymerization of HA may contribute to the detrimental effects on the cartilage matrix, particularly in the TA and LMW-HA groups.
Compared to the TA group, treatment with HA of high or low molecular weight led to lower levels of SF CS, and a higher proportion of high molecular weight HA, indicating less catabolism of cartilage aggrecan and less degradation of SF HA molecules. Therefore, the HA treatments are beneficial in this experimental model of acute synovitis in horses, particularly HMW-HA, which was associated with lower SF CS concentrations.
In conclusion, the data indicates that a treatment with HA, irrespective of its molecular weight, although less effective in reversing the symptoms of inflammatory reaction than TA, is efficient in preserving the cartilage and SF HA, in cases of acute synovitis in horses. Low molecular weight HA was more effective in reducing cytokine release to the SF than TA. Nevertheless, complete elucidation of the molecular mechanisms that lead to aggrecan and HA digestion in LPS-induced and TA-treated synovitis remain to be clarified.
 XML Download