

 PDF
PDF ePub
ePub Citation
 Print
Print


Introduction
Intracellular fat accumulation in the liver is a common feature of many liver disorders, and hepatic steatosis is widely recognized in humans as the most prevalent cause of liver disease and a contributing factor in the progression of chronic hepatic disorders [1828]. Hepatic steatosis (lipidosis) is also observed in dogs and cats and is associated with obesity, diabetes, prolonged fasting, congenital portosystemic shunts, endocrinopathy, and toxic liver injury [4]. Consequently, diagnostic tools to reliably detect and grade hepatic fat accumulation have been much sought after in human medicine and may prove useful in veterinary medicine [33]. Liver biopsy, the current gold standard, is invasive, provides evaluation of only 0.002% of the liver, is subject to inter-observer variability, and is associated with a risk of bleeding [218]. Ultrasound can detect moderate to marked fatty infiltration of the liver but other diffuse hepatic disorders may have similar sonographic appearances, and interpretation is operator-dependent [6891316]. Moreover, quantitative methods based on histogram analysis only grade echogenicity, which is non-specific for fatty infiltration, and inapplicable in routine practice [58]. Computed tomography has been evaluated in humans and cats for the diagnosis of hepatic lipidosis but is unreliable at quantifying fatty infiltration when concurrent hepatic parenchymal disease exists [1421].
Dual gradient echo magnetic resonance imaging (DGE-MRI) is considered one of the most sensitive modalities for the detection of fatty infiltration of the liver in humans [2]. This technique uses chemical shift imaging, taking advantage of the different precession frequencies of fat and water protons in a magnetic field. Different echo-time parameters are used such that the signal from fat protons is either in phase (IP) or in opposed phase (OP) with that of water protons. The derived signals are those of fat and water added together (IP) or water minus fat signal (OP) [20]. Using this principle, the modified Dixon (mDixon) imaging method uses a reconstruction algorithm from which the fat fraction is derived from the difference in IP and OP signal intensities on a pixel-by-pixel basis, producing water only, fat only, IP, and OP images via fast gradient echo sequencing [18].
Proton magnetic resonance spectroscopy (1H MRS) records signals from protons embedded in different chemical bonds within a given volume of tissue, with the bonds identified by their spectral frequencies. As protons are surrounded by nuclei and electrons with their own magnetic properties, slight differences occur in the received frequencies from protons in different chemical bonds. The spectral position of resonances, due to these chemical shifts, is expressed in parts per million (ppm) relative to a reference set at 0 ppm. At field strengths at or above 1.5 T, the frequency peaks of lipid and water protons are approximately 1.2 ppm and 4.7 ppm, respectively [18].
As 1H MRS can distinguish spectral frequencies of protons in water from those in fatty acids, the fat signal fraction can be calculated, providing an accurate measure of hepatic fat compared to estimates from biopsy or chemical triglyceride assays [31829]. Previous studies have described hepatic fat quantification using 1H MRS in humans [18], lean and obese cats [3], and rats [26], as well as in a study of experimentally-induced hepatic fat accumulation in dogs and rabbits [29]. In lean and obese cats, the median liver fat percentages measured by applying 1H MRS were 1.3% and 6.8%, respectively [3]. To the authors' knowledge, hepatic fat content in lean or obese dogs has not, thus far, been quantified by using DGE-MRI or 1H MRS techniques.
The objective of this prospective sample survey study was to explore the feasibility of hepatic fat quantification by using DGE-MRI and 1H MRS in healthy adult dogs and to compare fat quantification derived via these techniques with results from histological and cytological examination, which represent the standard diagnostic approach in clinical patients. The use of the investigated techniques in a clinical setting may be of potential benefit in non-invasive diagnosis and monitoring of canine patients.
Materials and Methods
Ethical approval
All procedures involving the dogs in this study were approved by the Cantonal Veterinary Office of Zurich (approval No. 114/2013).
Dogs
Eleven research purpose-bred dogs (5 females and 6 males) were used in the study. The dogs had a mean age of 4.1 years (range, 3.4–6 years) and a mean body weight of 13.6 kg (range, 10.0–15.0 kg). The dogs had a median body condition score (BCS) of 7/9 (range, 6–8). The dogs were deemed healthy based on physical examination, complete blood count, and biochemistry profile results.
Anesthesia
Dogs were anesthetized following a standard protocol. This included premedication with methadone (0.2 mg/kg) followed, 30 min later, by midazolam (0.1 mg/kg intravenous [IV]) administered via a cephalic catheter. Anesthesia was induced, to effect, with propofol. Following endotracheal intubation, anesthesia was maintained by using sevoflurane delivered in an oxygen/air mixture with a flow of 50 mL/kg/min and an inspired fraction of oxygen of 0.5. Dogs were mechanically ventilated by using a breathing system in volume-cycled mode to maintain an end-tidal PCO2 of 35 mmHg. Lactated Ringer's solution (5 mL/kg/h) was administered IV throughout anesthesia. Monitoring included continuous assessment of heart and respiratory rates, pulse oximetry, body temperature, and end-tidal PCO2, as well as intermittent oscillometric non-invasive blood pressure measurements. If mean arterial pressure was below 60 mmHg, the inspired fraction of sevoflurane was decreased by 0.5% and an IV fluid bolus (2 mL/kg) of lactated Ringer's solution was administered. If hypotension persisted, a constant rate infusion of IV dobutamine (initial dose, 2 µg/kg/h) was administered.
Magnetic resonance imaging and spectroscopy
The dogs were placed in dorsal recumbency in a 3 T scanner (Philips Ingenia 3.0 T scanner; Philips Healthcare, Switzerland) with a phased-array anterior coil (dStream body coil solution, 32 channels; Philips Healthcare). Initial transverse cranial abdominal sequences were performed to rule out hepatic morphologic abnormalities by obtaining T2-weighted (turbo spin echo; repetition time, 1,250 msec; echo time, 80 msec; flip angle, 90°; field of view, 220 mm; voxel size, 0.60 mm × 0.73 mm × 3.00 mm; slice thickness, 3.00 mm; slice gap, 0.5 mm) and T1-weighted pre- and post-contrast scans.
For breath-hold sequences (both DGE-MRI and 1H MRS sequences), mechanical ventilation was interrupted to allow brief expiratory apnea (maximal scan length, 28 sec) and resumed immediately thereafter. The DGE-MRI sequence was performed on the cranial abdomen via a transverse scan (3D T1-weighted, fast dual gradient echo; repetition time, 3.6 msec; echo times, 1.2 msec [OP] and 2.3 msec [IP]; field of view, 280 mm × 280 mm × 165 mm; voxel size, 1.5 mm × 2.5 mm × 1.5 mm; number of excitations, 1). Hepatic 1H MRS spectra were obtained by using a multi-echo single shot technique (point resolved spectroscopy, PRESS) on a single voxel (volume, 20 mm3) of the liver (echo time, 38 msec; recovery time, 2,000 msec; number of signal averages, 12; spectral bandwidth, 2,000 Hz; flip angle, 90°) using pencil-beam automatic shimming. The voxel to be analyzed was selected based on the T2-weighted and DGE-MRI sequences in order to avoid blood vessels, gallbladder, and fatty tissue.
Finally, gadodiamide contrast (Gadodiamid [Omniscan], 0.3 mmol/kg; GE Healthcare, Switzerland) was administered IV by using an automatic injector (2 mL/sec), followed by a 10 mL saline flush. An enhanced T1 high-resolution isotropic volume excitation (e-Thrive) sequence was performed by using turbo field echo, and SENSE (dynamic parallel imaging performance sensitivity) encoding was performed (repetition time, 3.1 msec; echo time, 1.5 msec; flip angle, 10°; field of view, 280 mm; voxel size, 1.49 mm × 1.51 mm × 3.00 mm; slice thickness, 3 mm; slice gap, −1.5 mm; number of dynamics, 6). The scan was manually started when contrast enhancement was visible in the descending aorta in the pre-monitoring window and was repeated 6 times consecutively.
Ultrasound and tissue sampling
Following the MRI and spectroscopy procedures, and during the same anesthesia session, dog livers were examined by using ultrasound (Philips iU22 Ultrasound system; Philips Healthcare) applied by a single examiner (F. Del Chicca). Two ultrasound-guided fine-needle (22 gauge) aspirates and two ultrasound-guided needle biopsies (Tru-cut, 16 gauge) using an automatic biopsy gun were obtained.
Subsequently, the dogs recovered from anesthesia following IV methadone (0.2 mg/kg) administration and were monitored for 2 to 4 h in the intensive care unit. Finally, a follow-up abdominal ultrasound was performed to evaluate the abdomen for possible signs of a bleeding complication.
Tissue processing analysis
All cytologic and histologic samples were assessed by a single board-certified pathologist (P. Grest) blinded to the imaging outcomes. Cytologic samples were stained with a modified Wright's stain. Biopsies from 7 of the 11 dogs were fixed in 4% buffered formaldehyde and embedded in paraffin. Sections (4 µm thick) were cut and routinely stained with hematoxylin and eosin. In formalin-fixed, paraffin-embedded tissue, fat presents as velar, empty, variable-sized vacuoles. Hepatocytes were evaluated for the presence of microvesicular changes characterized by numerous uniform intracytoplasmic vacuoles that are smaller than the centrally located nucleus or for macrovesicular changes with vacuoles the size of the nucleus or larger and, frequently, with a displaced nucleus. Biopsies from the remaining 4 dogs were used for the biochemical assays. This was done by extracting lipids by applying a modified Foch method. Briefly, 1 mL chloroform/methanol (2:1) was added to 50 mg fresh liver followed by homogenizing in a bead mill (30 Hz, 4 × 30 sec). The homogenate was centrifuged (5 min) to separate the upper phase (aqueous methanol dragging) and lower phase (chloroform) containing lipids. The upper phase was removed by siphoning, which was repeated after rinsing the interface between phases twice with methanol/water (1:1) without mixing. The lower chloroform phase was evaporated under vacuum, resuspended in 50 µL DMSO, and shaken for 20 min at 37℃. Finally, triglyceride level was measured by using a commercial enzymatic colorimetric kit (Diatools Trig; Diatools, Switzerland) on a biochemistry analyzer (Cobas Mira; Roche Diagnostics, Switzerland).
Postprocessing and data analysis
Postprocessing of magnetic resonance data was conducted on a dedicated workstation (Extended MR WorkSpace, ver. 2.6.3.5; Philips Medical Systems, The Netherlands).
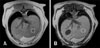
On DGE-MRI sequences, 3 regions of interest (ROIs) that avoided large vessels and organ boundaries were drawn in the liver parenchyma (Fig. 1). The signal intensity (SI) in IP and OP phase images was recorded and the hepatic fat fraction (HFF) was calculated as [SI(IP) − SI(OP)] / [2 × SI(IP)] [18]. For data analysis, the average of 3 calculated HFF values was used.
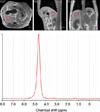
The relative proton densities of fat and water were calculated from 1H MRS spectral data by using an automated fitting method (LCModel, ver. 6.3-0B; Stephen Provencher, Canada) [23]. The fitting algorithm for liver analysis provided estimates for all lipid signals. For hepatic fat quantification, the ratio between the fat signal peaks and the sum of the fat and water peaks was calculated [fat signal peak / (fat signal peak area + water peak area)] (Fig. 2). The ratio was corrected for different T1 times of water and fat in relation to the applied repetition time (2,000 msec).
Statistical analysis
Statistical analysis was performed by using a commercial software package (IBM SPSS Statistics for Windows, ver. 21.0, 64-bit edition; IBM, USA). Descriptive statistics were obtained and hepatic triglyceride concentration results from biochemical analysis and HFF, calculated with DGE-MRI and 1H MRS, were compared. Correlation between measurements was assessed by using Spearman's rank correlation with significance set at p < 0.01. For interpretation of the strength of an association, rank correlation (rs) values of 0.8 to 1.0 were regarded as very strong, 0.6 to 0.79 as strong, 0.4 to 0.59 as moderate, 0.2 to 0.39 as weak, and 0 to 0.19 as very weak.
Results
The results of ultrasonographic examinations of liver and gallbladder were considered unremarkable in echogenicity and structures in all dogs. Likewise, cytologic and H&E stained histologic samples revealed no abnormalities or intracytoplasmic lipid vacuoles in any of the dogs. Histologic samples stained with Oil Red O revealed small (< 1 µm) lipid droplets within hepatocytes and bile ducts. Hepatic MRI morphology was considered unremarkable with homogeneous hyperintense signals compared to the epaxial musculature and hypointense signals compared to the spleen on T2-weighted images, as well as homogeneous and mildly hyperintense signals compared to the epaxial musculature on T1-weighted mages. The mean length of the T2-weighted sequences was 6.2 ± 2.9 min, while that of DGE-MRI sequences was of 2 min ± 30 sec. The mean length of the spectroscopy sequences was 12 ± 5 min.
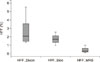
The mean ± SD size of the ROIs on DGE-MRI sequences was 1.05 ± 0.04 cm2 (Fig. 1). There was no statistically significant difference in HFF calculated from the different ROIs. The median calculated HFF was 2.1% (range, 1.3–5.5%) based on DGE-MRI (modified Dixon) sequences, 0.3% (range, 0.1–1.0%) based on 1H MRS, and 1.6% (range, 1.0–2.5%) based on biochemical analysis (Fig. 3). The correlations between the biochemical analysis and HFF results based on DGE-MRI (rs = 1.0) and 1H MRS (rs = 0.8) were very strong. However, the correlation between the HFFs based on DGE-MRI and 1H MRS analysis was weak (rs = 0.34).
Discussion
The present study evaluated two imaging techniques to quantify HFF in dogs and to determine their potential as alternative methods to invasive procedures for the diagnosis, grading, and/or monitoring of hepatic steatosis. To the authors' knowledge, non-invasive techniques for hepatic fat quantification in healthy dogs have not been previously described.
A suspicion of hepatic steatosis may be aroused by observation of diffusely increased echogenicity when using ultrasound. However, increased echogenicity is not specific for fatty infiltration and has been described in association with a number of other parenchymal disorders [912]. Therefore, a definitive diagnosis is generally only possible by sampling hepatic tissue, but such sampling is invasive, carries a risk of bleeding, and only allows evaluation of small amount of tissue. Moreover, the distribution of the steatosis may be uneven throughout the liver, and the region sampled may not be representative of the severity of the disease.
In humans, HFF using DGE-MRI or 1H MRS has been shown to have greater correlation with histopathologic examination results than those from ultrasound or computed tomographic examination [152831]. In healthy humans, the HFF using 1H MRS was reported to be 1.9%, and a cut off of 5.6% has been proposed for the diagnosis of hepatic steatosis [30]. Other studies have shown that DGE-MRI yields HFF values comparable to quantitative fat measurements from biopsies [1119] and 1H MRS measurements [110]. Moreover, one study showed that HFF based on DGE-MRI was the most accurate method for the diagnosis of hepatic steatosis compared to results from other non-invasive imaging techniques [15].
On morphological MRI images the liver of all dogs was considered to have normal signal intensity [7]. Data from the present study suggest that DGE-MRI is also valid for estimation of HFF in canine livers as it provided a high correlation with the biochemical fat quantification estimates. Given that DGE-MRI is fast, it is relatively insensitive to motion artifacts and requires only a short apnea. Moreover, it allows evaluation of images from the entire parenchyma, reducing the risk of unrepresentative sampling due to variation in the distribution of histopathologic lesions [13]. SI loss on IP images may, however, result from excessive hepatic iron accumulation [32], which was excluded in dogs in the present study based on histopathologic examinations. As all dogs in the present study were healthy animals, further studies are required to assess the usefulness of DGE-MRI and 1H MRS in dogs with hepatic disease.
In humans, 1H MRS was reported to have a high correlation (rs = 0.876) with hepatic lipid content [2527] in non-alcoholic fatty liver disease. Data from the present study shows a strong correlation between 1H MRS and biochemical analysis results, similar to that reported in humans [25]. However, HFF based on 1H MRS underestimated HFF in the present study, as was also previously observed in a study in mice with moderately elevated hepatic fat content [26].
Previous studies have shown a greater correlation between HFF based on 1H MRS and histology in rats with severe steatosis than that in those with only moderate steatosis [17] suggesting an increase in correlation with increasing fat content. As a consequence, 1H MRS may perform better when estimating HFF than the data from our study in healthy lean dogs suggest. The PRESS sequence was used in the present study, which has a higher signal-to-noise ratio than other spectroscopy sequences [2224], although it allows measurements of only 2 of a possible 6 lipids resonance peaks. As one of the minor lipid peaks overlaps with the water peak [22], and cannot be quantified with the PRESS sequence, this may have produced some degree of underestimation of HFF with 1H MRS in the present study.
Disadvantages of 1H MRS include high sensitivity to motion artifacts, thus a breath holding or gating technique is mandatory. The highly variable length of this sequence in each dog depended on the compensation time between subsequent apneas. With another kind of triggering, such as gating, it is likely that the sequence length would have been shorter and more uniform among the dogs.
In 1H MRS sequences only a small region of hepatic parenchyma is evaluated. The technique provides spectra for a small sub-region of the liver parenchyma and, in order to obtain a spectrum of good quality, the voxel should not be in contact with organ boundaries, blood vessels, or biliary structures. Thus, mainly in smaller dogs, there may be only limited possibilities for voxel placement, and the voxel may not necessarily match the region with the most severe pathology. In the dogs we examined, even if the major hepatic vessels were avoided, the voxel may have likely included smaller blood vessels. As the placement of the voxel was based on previous MRI sequences acquired some minutes earlier, slight motion of the diaphragm may have caused some degree of spatial mismatch. This may, at least in part, explain the weak correlation found between the HFFs estimated using DGE-MRI and 1H MRS.
Neither of the two imaging techniques used in the present study can be used to discriminate between microvesicular and macrovesicular hepatic steatosis or to show the histologic distribution of lipid accumulation, but both may provide non-invasive anatomic and semi-quantitative information without the use of ionizing radiation or the need for contrast media. Moreover, both of the described techniques require adequate software. For the 1H MRS, additional LCModel software and expertise in this field are necessary for the correct post-processing and data interpretation.
In contrast to human medicine, veterinary medicine MRI examination requires general anesthesia. This may encounter some clinical resistance because of the intrinsic risk for the patient, as well as time and costs issues. On the other hand, the possibility of non-invasive diagnosis and monitoring of patients is attractive and should be investigated.
One major limitation of the present study was the small number of animals examined. This greatly limits the validity of the measured correlations; thus, further studies are necessary to evaluate the use of these techniques in dogs with varying degree of hepatic lipid accumulation. A further limitation was that the region of liver sampled for biopsy was differed among the dogs and did not correspond to the ROI of the DGE-MRI images or to the voxel of the 1H MRS. As dogs included in the present study were lean healthy dogs with minimal hepatic fat, as measured by using any technique, this is unlikely to have greatly affected the results, but it may be a confounder in future studies of dogs with hepatic disorders exhibiting non-uniform distribution of fat accumulation.
In conclusion, herein, we report the first use of DGE-MRI and 1H MRS to estimate HFF in dogs. Unremarkable cytologic and histologic sample results in dogs with a mean BCS of 7/9 corresponded with the reported HFF values obtained using the two described techniques. There was a tendency for 1H MRS to underestimate HFF. Further studies in dogs in different body condition and with varying hepatic lipid content are necessary for further evaluation and validation of both techniques and for consideration as future diagnostic applications.
 XML Download