

 PDF
PDF ePub
ePub Citation
 Print
Print


Introduction
As multi-detector row computed tomography (CT) is widely available in veterinary medicine, the acquisition time for renal CT images can be reduced to optimize the enhancement phases of kidney scanning in the detection of vascular or parenchymal abnormalities [918]. Contrast-enhanced CT consists of three phases: renal arterial, corticomedullary, and nephrographic phases, which are assessed according to the excretion of the contrast agent after its injection. The renal artery phase provides anatomic information of the renal artery; this phase should be terminated during renal arterial enhancement before the venous return initiates [11]. The renal artery phase can provide an accurate image of renal artery anatomy and is particularly useful for surgical planning to evaluate renal donors before renal transplantation and to assess the presence of renal artery stenosis or aneurysms [56]. The corticomedullary phase is characterized by a greater degree of cortex enhancement compared to that of the medulla. Previous human studies indicated that parenchymal lesions such as neoplasia and inflammation can be detected more clearly in nephrographic phase imaging than in corticomedullary phase imaging [4715192426]. However, when non-enhanced CT or enhanced corticomedullary phase and nephrographic phase CT imaging are applied, renal lesion identification and characterization are improved, and staging of renal cell carcinomas is characterized more accurately than when only corticomedullary phase or nephrographic phase is solely performed [7]. The nephrographic phase shows uniform renal enhancement prior to urine collection in the renal pelvis [25], and such CT is optimal for visualizing lesions in the renal medulla, particularly small medullary lesions that have poor visibility on corticomedullary phase imaging [313151823].
An optimal scan delay is essential to acquire enhanced CT images at the appropriated phase. Scan delay has been investigated by using a test bolus technique [16]. This method can determine the delay time for each renal phase in an individual animal; however, contrast agent injection and CT scanning need to be repeated for test bolus and multi-phase CT scans. The bolus-tracking technique can monitor contrast enhancement in real time by determining the contrast arrival time to a region of interest (ROI) [22]. This method has advantages, including no need for additional contrast agent administration, thus reducing the effort required and the radiation exposure of the patient. In human medicine, the bolus-tracking technique is widely used for kidney CT studies and optimal scan delays for human kidney based on bolus-tracking have been investigated [10].
The application of CT for kidneys is increasing in dogs and cats as the availability of multi-detector CT has increased in veterinary medicine. Thus, this study investigated the optimal scan delays for renal arterial, corticomedullary, and nephrographic phases in normal dogs by undertaking multi-detector CT of the canine kidney using a bolus-tracking technique.
Materials and Methods
Animals
Six intact male, purpose-bred Beagles participated in this study. The median age of the dogs was 3 years (2–4 years) and the median weight was 9.7 kg (8.7–12.7 kg). All dogs were healthy, based on physical examination, complete blood count, serum biochemistry and electrolytes, urinalysis, abdominal radiography and ultrasonography, and echocardiography. All dogs under anesthesia showed normal blood pressure just before the CT scanning. Dogs were fed commercial dry food and water ad libitum in separate cages. The study protocol was approved by the Institutional Animal Care and Use Committee of Chonnam National University (CNU IACUC-YB-R-2016-28).
Bolus-tracking CT study
In this crossover study design, multi-phase CT scanning was performed three times in each dog with different scan delay periods. Scan delays for the first scan were 5, 20, 35, and 50 sec, the second scan were 10, 25, 40, and 55 sec, and the third scan were 15, 30, 45, and 60 sec. Three CT scans were performed in each dog, each at 5 day intervals.
After fasting for 24 h, general anesthesia was induced by a intramuscular injection of a combination of 0.03 mg/kg medetomidine (Domitor; Orion Corporation, Finland) and 0.75 mg/kg zolazepam/tiletamine (Zoletil; Virbac, France) and was maintained by supplying isoflurane (Terrell; Piramal Critical Care, USA) through an endotracheal tube. Dogs were placed in sternal recumbency and a breath-hold technique was performed by inducing apnea via manual hyperventilation before CT scanning. CT images were acquired by a multi-detector CT scanner (Siemens Emotion 16; Siemens Medical Systems, Germany) with the following settings: 110 kVp; 130 mA; slice thickness, 1 mm; and pitch, 1. A survey CT scan was performed for the entire abdomen from the diaphragmatic level to the coxofemoral joint level to identify the scan range of the multi-phase scans. Contrast-enhanced CT images that included both kidneys were acquired from the cranial pole of the right kidney to the caudal pole of the left kidney in a craniocaudal direction. A dose of 600 mg iodine/kg Iohexol (300 mgI/mL, Omnipaque; GE Healthcare Ireland, Ireland) was administered by using a power injector (Vistron CT Injection System; Medrad, USA) at a rate of 3 mL/sec. After setting the ROI over the aorta at the level of the scan starting position, contrast enhancement of the ROI was monitored by using a bolus-tracking program (CARE Bolus; Siemens Medical Systems). When contrast enhancement of the aorta reached 100 Hounsfield units (HU), multi-phase CT scanning was triggered. Scanning was conducted with the following settings: 110 kVp; 130 mA; slice thickness, 1 mm; and pitch, 1. Acquired CT images were reconstructed using 1 mm slices, 1 mm intervals, and a standard kernel frequency.
CT images evaluation
All CT images were evaluated at a workstation by using a picture archiving and communication system (INFINITT PACS; INFINITT Healthcare, Korea) with a window width of 400 HU and a window level of 40 HU. The mean CT values of the aorta, renal artery and vein, renal cortex, and medulla were assessed on a CT console monitor. Mean aortic enhancement was determined at the level of the scan starting position. The CT values of the renal artery were measured from the right and left proximal branches at the diverging region of the aorta and then averaged to calculate the mean CT value. Mean enhancement of the renal vein was assessed by using the same method as for the renal artery. The CT values of the cortex and medulla were measured from the ventral and dorsal segments in each kidney and then averaged to calculate the mean CT value. Then, the renal cortex-to-medulla contrast difference was calculated by subtracting the CT value of the renal medulla from that of the renal cortex, and the renal artery-to-vein contrast difference was calculated by subtracting the renal vein from the renal artery.
Statistical analyses
All data are expressed as mean ± SD values. Statistical analysis was performed with IBM SPSS Statistics (ver. 20; IBM, USA). The Mann-Whitney U test in SPSS was used to evaluate the mean CT values of the aorta, renal artery, renal vein, renal cortex, and renal medulla at each scan delay. Values were considered statistically significant when p < 0.05.
Results
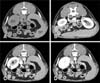
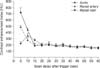
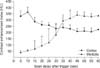
The mean HU of the aorta, renal artery, vein, cortex, and medulla in six beagle dogs were determined (Table 1). CT images of the renal artery, vein, cortex, and medulla taken when using a bolus-tracking technique are shown in Fig. 1. Renal artery results closely paralleled the aortic results. The mean CT value of the renal artery peaked at a scan delay of 5 sec (485 HU) after the trigger and then decreased quickly at scan delays of 10 to 15 sec (Fig. 2). The mean CT value of the renal vein increased gradually at scan delays of 5 to 10 sec and peaked at a scan delay of 10 sec (346 HU). The mean HU of the renal vein was significantly higher at a 10 sec delay than at a 15 sec delay. The mean CT value of the renal cortex reached a peak (365 HU) at a scan delay of 10 sec after the trigger, decreased quickly at scan delays of 10 to 15 sec, and plateaued at scan delays of 20 to 60 sec (Fig. 3). The mean HU of the renal medulla increased quickly at scan delays of 5 to 45 sec and plateaued at scan delays of 45 to 55 sec.
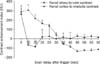
The renal artery-to-vein contrast difference peaked at scan delays of 5 sec after the trigger, decreased quickly at scan delays of 5 to 15 sec, was below zero at a scan delay of 10 sec, and was almost zero at a scan delay of 20 to 60 sec (Fig. 4). The renal cortex-to-medulla contrast difference peaked at a scan delay of 5 to 15 sec, was reduced over time to become zero at scan delays of 30 to 35 sec. The mean HU renal cortex-to-medulla contrast was significantly lower at 30 sec than at 45 sec.
Discussion
A multi-phase CT scan of canine kidney in conjunction with a bolus-tracking technique was effectively performed in this study. The maximum mean attenuation of the renal artery reached a peak at a scan delay of 5 sec and the renal artery-to-vein contrast difference peaked at the same time. Thus, a scan delay of 5 sec after the bolus trigger is optimal to visualize the renal artery and was considered to indicate the renal arterial phase [12].
The renal cortex-to-medulla contrast difference peaked at a scan delay of 10 sec after the bolus trigger and can be considered as the delay time representative of the corticomedullary phase in this study. The corticomedullary phase is a very short period of renal enhancement; therefore, determining the optimal scan delay is essential for maximizing the discrimination between the renal cortex and the medulla [1420]. In the corticomedullary phase, the renal cortex can be discriminated from the renal medulla, and this phase indicates renal perfusion during the first circulatory pass of the CT contrast agent [14]. The renal cortex was markedly enhanced compared with the renal medulla because vascularity of renal cortex is greater than the medulla [820]. Furthermore, in this phase, the contrast agent does not enter the distal part of the renal tubules. During the corticomedullary phase, enhancement of the renal vein is also induced [1024]; thus, corticomedullary phase imaging is optimal for detecting changes in tissue perfusion, vascular malformations, and renal venous thromboses [521]. In addition, this phase is considered optimal for defining the corticomedullary junction and detecting changes in vascular enhancement [56].
The nephrographic phase begins at a time when the renal cortex and medulla have the same degree of contrast enhancement, and the kidney is homogeneously enhanced. This phase is present when the renal cortex-to-medulla contrast difference reaches zero. The nephrographic phase shows that the contrast agent filters and enters Henle's loop and the collecting tubules and distributes within the renal interstitial space [16]. It is important to obtain nephrographic phase renal CT images before the contrast agent is accumulated within the collecting system and generates beam-hardening artifacts to prevent deterioration of the image quality [5]. In the present study, the optimal scan delay for the nephrographic phase was 30 sec after the bolus trigger.
In this study, the scan delays for each phase were similar to those obtained in human study obtained using the bolus-tracking technique; that is, scan delays of 5 to 10 sec for the renal artery and 15 to 25 sec for the corticomedullary phase [10]. However, there was a difference in scan delay for the nephrographic phase, which is 50 to 55 sec in humans. When the injection rate is slow and the contrast agent volume is large, the nephrographic onset time is delayed [316]. Thus, the nephrographic phase in this study started more quickly than in a human study because the volume of contrast agent used in dogs is much lower than that in humans (about 150 mL of contrast agent) [10].
The scan delay for each phase in a kidney study can be determined based on the time-intensity curve obtained after the test bolus CT scan. In a previous study, the scan delay in kidney was assessed using a test bolus technique in beagle dogs after 3 mL/kg iodine contrast injection [16]. In that study, the optimal delays after contrast agent injection were reported as 10 sec in the corticomedullary phase and 44 sec in the nephrographic phase, which are comparable to our results. However, the authors defined the corticomedullary phase as the initial appearance of renal cortex enhancement, which may be related to a long scan time for the acquisition of CT images when using a single channel CT scanner.
In this study, the bolus trigger was set at the aorta and trigger times ranged from 10.5 to 15.9 sec in all dogs. Peak aortic enhancement has been reported to increase as cardiac output decreases [1]. Abnormal kidney function may induce systemic hypertension and lead to decreased systolic function [11722]. Thus, the scan timing for a CT study is highly dependent on each patient's condition. Furthermore, the bolus-tracking technique may be efficient for optimization of scan delay in patients with renal dysfunction.
The present study had some limitations. First, kidneys in all dogs were considered clinically normal based on various clinical examinations; however, this was not confirmed by histopathologic examination. Second, the optimal phase of excretion was not assessed in this study; however, the excretory phase is not a short period, thus there is no need to optimize scan delay by using a bolus tracking program [231021].
In conclusion, for the injection protocol used in this study, optimal scan delays for the renal arterial, corticomedullary, and nephrographic phases in the canine kidney were 5, 10, and 30 sec, respectively, after triggering at 100 HU of aortic enhancement using a bolus-tracking technique. Individualized scanning delays based on the bolus-tracking technique is useful for multi-phase renal CT study as it compensates for different transit times to the kidney between different animals, uses a small dose of contrast media, and requires no additional patient radiation exposure.
 XML Download