

 PDF
PDF ePub
ePub Citation
 Print
Print


Introduction
Several studies have shown the importance of the local endometrial insulin-like growth factor-1 (IGF1) system in the process of decidualization and production of local IGFs for embryonic and foetal growth [151625]. However, less is known about endocrine adaption during the early phase of pregnancy in dairy heifers as it relates to the somatotropic axis. In women, several endocrine adaptations occur during pregnancy. For instance, IGF1 decreases during early pregnancy and increases toward the third trimester of pregnancy [19]. IGF1 is bound to six specific IGF-binding proteins (IGFBPs). These binding proteins are not only important transport proteins, but also control the passage of either IGF1 and/or IGF2 throughout the endothelium towards the target cells (e.g., the endometrium) [1424]. Alterations regarding either the IGFBP blood concentration or hepatic mRNA expression of different IGFBPs have been reported. For example, a recent study revealed increased hepatic IGFBP4 expression in pregnant sheep [6], while a specific IGFBP4 protease (PAPP-A) has been identified in women as an important factor for human implantation that cleaves IGFBP4 to release IGF1 [9]. In beef cattle, the IGF1 concentration during early pregnancy (day 13 and 15) was higher in non-pregnant than in pregnant cattle, and IGFBP2 was lower in the serum of pregnant beef cattle than non-pregnant cattle [12]. Changes in foetal IGFBP concentrations or within the maternal blood circulation can amplify the supply of IGFs to the embryo, and thus be crucial for embryonic growth and development [723]. However, data regarding changes within the maternal system in pregnant dairy heifers during early pregnancy are rare. Therefore, the present study was conducted to test whether endocrine endpoints of the somatotropic axis in maternal circulation were influenced by early pregnancy (day 18) in dairy heifers.
Materials and Methods
Heifers
This study was authorized by the German legislation on animal welfare (Lower Saxony Federal State Office for Consumer Protection 279 and Food Safety, AZ 33.9-42502-04-09/1696). Holstein Friesian heifers (n = 30; Masterrind, Germany) with a mean age of 14.1 ± 1.6 month and a mean body weight of 337.8 ± 23.7 kg at the start of the experiment were used. During a two-week adaption period, the heifers underwent a standardised clinical examination and received a Rumifert bolus (Boehringer Ingelheim Vetmedica, Germany) to ensure adequate mineral supply. The heifers were kept in tie-stalls on straw throughout the experiment. During the experiment, their health status was monitored by daily examination of feed-intake, habitus, locomotion, rumen filling and a gynaecological examination of the uterus and ovaries. Mineral licks (Deutsche Raiffeisen-Warenzentrale, Germany), hay and fresh water were provided ad libitum.
Experimental setup
The heifers received 2 mL prostaglandin F2α intramuscularly (Estrumate; Intervet, Germany), followed by 2 mL GnRH (intramuscular, Receptal; Intervet) 48 h later to induce synchronization of ovulation (OvSynch). Transrectal ultrasound was conducted twice daily during the OvSynch (LOGIQ Book XP and linear transducer probe 10 MHz; General Electric Medical Systems, China) to detect the day of ovulation (day 0). If ovulation did not occur within 48 h of administration of GnRH, the synchronization procedure was repeated.
At first, a synchronized negative control cycle was performed and samples were taken in all 30 heifers. Afterwards, each heifer received two consecutive synchronized cycles with embryo transfer (ET). Out of the 30 heifers, 10 were selected, in which one negative control cycle and two subsequent embryo transfer cycles (one pregnant and one non-pregnant or vice versa) were achieved. The effects of pregnancy on the maternal endocrine endpoints were statistically analysed in three consecutive cycles of one heifer: synchronized negative control cycle, pregnant and non-pregnant.
Before ET, the ovary of the recipient heifer was checked on day 6 by ultrasound for the development of a corpus luteum (CL), and the progesterone (P4) blood concentration was quickly measured by use of the Immulite System (Siemens Healthcare Diagnostics, USA) (data not shown) as previously described [17]. If a CL with a diameter of > 1.5 cm was present and the P4 serum concentration was > 1.0 ng/mL, the utilized male embryos (frozen in glycerol, stored at -196℃; produced and sexed by Masterrind) were thawed under sterile conditions using the Emcare Embryo Thawing System (ICPbio Reproduction, USA) according to the manufacturer's instructions. One embryo was transferred transcervically into the uterus of the recipient heifer using an ET instrument (Transfer Stylet 19240/1000, Transfit Lateral 19240/1005, Sanitary Sheaths 19271/0080; Minitüb, Germany). The ET cycles ended on day 18 by flushing the uterus as previously described [28]. The regained Euroflush ET medium (IMV Technologies, France) was checked for trophoblast tissue, which was subsequently dehydrated through a graded series of ethanol (Carl Roth, Germany) and embedded in paraffin wax. Sections (3 µm) were immobilized on glass object slides and stained with haematoxylin and eosin (Roth) to detect trophoblast giant cells as proof of trophoblast tissue (Fig. 1). Heifers were defined as pregnant if the P4 concentration on day 18 was > 2.0 ng/mL and trophoblast tissue could be verified. The heifers were defined as non-pregnant if the P4 concentration on day 18 was < 1.0 ng/mL, the heifers showed oestrus signs and no conceptus was recovered during the flushing procedure.
Blood samples
Blood samples were obtained from the jugular vein in the morning on day 0, 7, 14, 16 and 18. The samples were collected in 10 mL serum and EDTA tubes (Germany), rested at room temperature (RT) for approximately 2 h and centrifuged for 10 min (1,500 × g, RT). After centrifugation, the serum and plasma samples were transferred to 2 mL Eppendorf tubes and stored at -20℃ until further analysis.
Liver biopsies
Liver biopsies were obtained on day 18 as previously described [17]. Under sterile conditions, two or three liver biopsies, approximately 10 mm long and 3 mm in diameter, were collected into sterile Eppendorf cups, which were immediately frozen in liquid nitrogen and stored at -80℃ until mRNA extraction.
Blood analyses
Progesterone and oestrogen
The serum P4 concentration was determined using a solid-phase radioimmunoassay (TKPG1, Coat-a-count Progesterone; Siemens Diagnostics, USA) according to the manufacturer's instructions. The intra-assay coefficient of variation (CV) was 3.1%, and the inter-assay CV was 5.6%. The lowest detection limit was 0.03 ng/mL.
Serum oestrogen concentrations were measured after 2 h of incubation at 37℃ in sodium acetate buffer (pH 4.8; Sigma Aldrich, USA) with 0.2% β-glucoronidase/acrylsulfatase (Merck, Germany) to release oestrogen from their glucoronidated and sulphated forms. An extraction procedure with ether and a direct enzyme-immunoassay (EIA) followed. The EIA has previously been described [18]. The utilized antiserum was raised against 17-β-estradiol hemisuccinate (Technical University Munich, Germany), while 17-β-estradiol hemisuccinate horseradish peroxidase was used as a steroid enzyme conjugate (Technical University Munich). The recovery was 84.6 to 96.2%, the intra-assay CV was 1.7 to 13.2%, and the inter-assay CV was 8.2 to 19.7%, whereas the minimal detectable concentration was 2.5 pg/mL.
IGF1, IGF2 and growth hormone (GH)
To determine the total serum IGF1 concentration, a commercial radioimmunoassay was used according to the manufacturer's instructions (IGF-1 IRMA A15729; Beckman Coulter, USA) and as previously reported [2217]. The intra- and inter-assay CV results were 5.1 and 9.3%, respectively, while the lowest detection limit was 30 ng/mL. The method was validated for potential matrix effects by analysing the linearity of dilution that could be confirmed and a recovery rate using bovine serum samples with 50 ng/mL IGF-1 as a spike. The recovery rate was 92.6%. The serum concentration of IGF2 was measured using a commercially available IGF2 ELISA (Mediagnost, Germany) according to the manufacturer's instructions. The sandwich ELISA was validated for bovine serum; therefore, the serum samples were diluted in sample buffer to 1:5. The intra- and inter-assay CV were determined by measuring 20 dilutions of one bovine sample within or between 10 test runs. The intraand inter-assay CV were 6.6% and 7.2%, respectively. The lowest detection limit of the ELISA was 0.45 ng/mL.
An ELISA that has been previously described and validated was used to measure bovine GH concentrations [1722]. Briefly, a rabbit antibody targeted against ovine GH (anti-ovine GH-3, 1:20 pre-diluted, AFP-0802210, obtained from the National Hormone and Peptide Program [NHPP], National Institute of Diabetes and Digestive and Kidney Disseases [NIDDK] and Dr. Parlow) was diluted and used at a final dilution of 1:200. The standard curve ranged from 0.78 to 100 ng/mL bovine GH (AFP-9984C, obtained from the NHPP, NIDDK and Dr. Parlow). Therefore, bovine GH was dissolved in assay buffer and added into the microtiter plate. After a washing step the substrate (containing tetramethylbenzidine; Sigma Aldrich, USA) was pipetted and the reaction was stopped by adding sulfuric acid (2 M; Sigma Aldrich). The optical density was obtained at a wavelength of 450 nm, and the concentrations were calculated using the Magellan software with the cubic spline modus (Magellan 3.11; Tecan, Germany). The intra- and inter-assay CV were 9.8 and 12.6%, respectively, and the lowest detection limit for GH was 2.0 ng/mL.
IGFBP2, IGFBP3 and IGFBP4
Quantitative Western ligand blotting of serum IGFBP2, IGFBP3 and IGFBP4 were performed as previously described [13] on samples obtained on day 0, 14 and 18. To perform the Western ligand blot, serum samples were diluted with sample buffer (Lämmli buffer/bromophenol blue, EDTA) and boiled (5 min). Electrophoresis (Twin ExW S Perfect Blue; Peqlab Biotechnologie, Germany) was then performed on 11% SDS polyacrylamide gel. The separated proteins were transferred to a polyvinyl fluoride membrane (Millipore, Germany), and these blots (Semi Dry-Blotter Perfect Blue; Peqlab Biotechnologie) were incubated with blocking buffer and biotin-labelled IGF2 followed by washing steps and incubation with blocking buffer and streptavidin peroxidase-conjugate (IBT, Germany). After incubation with a detection reagent (Luminata Forte; Millipore), chemiluminescence was detected (Kodak Image Station 2000MM; Kodak, USA) and evaluated (GelAnalyzer 2010a by Dr. Istvan Lazar; GraphPad 4.0; GraphPad Software, USA). The intra- and inter-assay CV was 9.9 and 15.5% for IGFBP2, 7.8 and 19.4% for IGFBP3 and 7.7 and 18.1% for IGFBP4, respectively. The lowest detection limit was 0.2 ng/µL for IGFBP2, 1.1 ng/µL for IGFBP3 and 0.3 ng/µL for IGFBP4.
mRNA quantification in the liver biopsies
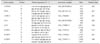
To quantify the relative abundance of mRNA for GHR1A, IGF1, IGF2, IGFBP2, IGFBP3 and IGFBP4 total RNA was extracted using the RNeasy Mini Kit for animal tissue and cells (Qiagen, Netherlands). The assay was performed according to the manufacturer's instructions using an automated system (QIAcube; Qiagen). The quality and quantity of the extracted RNA was assessed using an Agilent 2100 Bioanalyzer (Agilent Technologies, Germany) with the RNA 6000 Nano assay. All samples with a relative integrity number > 7.5 were applied to cDNA synthesis, which was performed by reverse transcription. The relative abundance of mRNA in the liver biopsies was measured using the BioRad Real Time System CFX96, 1000 Touch (Bio-Rad Laboratories, Germany). The PCR reaction mix contained 10 µL of MESA GREEN qPCR MasterMix Plus for SYBR Assay (Eurogentec, Germany) and 0.2 µM of each primer (Eurofins MWG Operon, Germany; Table 1) for the genes of interest. The PCR-cycler was programmed using the following protocol: RNA denaturation at 95℃ for 15 min followed by 43 cycles of 95℃ for 15 sec, 60℃ for 30 sec and 72℃ for 30 sec for amplification. The transcriptions were visualized using SYBR Green, and a subsequent melting curve, initiated at 55℃ and increasing to a final temperature of 95℃ at intervals of 0.5℃ each 10 sec, was used to verify the PCR fragments. The relative abundance to ribosomal protein S9 (RPS9) and glyceraldehyde-3-phosphate dehydrogenase (GAPDH) was calculated using Microsoft Excel 2010 (Microsoft Corporation, USA). If comparing pregnant and non-pregnant heifers, the relative abundance of these two reference genes did not differ.
Statistical analyses
All results are presented as the mean ± standard error (SE). Statistical analyses were performed with SAS ver. 9.3. A p < 0.05 was considered to indicate significance. At first, the data were tested for normality using Shapiro-Wilk's test (PROC Univariate Normal). The P4, oestrogen, IGF1, IGF2, IGFBP2, IGFBP3 and IGFBP4 concentrations were distributed normally. To achieve normal distribution, the GH values were log-transformed to base 10. To determine if the blood hormone concentration during early pregnancy (day 0 to 18) differed from that of the non-pregnant and control cycles, a linear mixed-effect model for repeated measures was performed (PROC MIXED and method REML) with the following fixed effects: group (pregnant, non-pregnant, and negative control cycle), time (day 0, 7, 14, 16, 18) and group × time. Analyses were followed by a Tukey-Kramer test (LSMEANS/ADJUST = TUKEY) for adjusted multiple comparisons between the groups and days, respectively. The F- and p values for the effects time, group and group × time are presented in the tables below Figs. 1, 2, 3, 4. Significant differences between the three groups (pregnant, non-pregnant, and negative control cycle) are indicated by different letters. Significant differences between days are mentioned in the text. Differences in mRNA expression on day 18 between pregnant heifers and respective non-pregnant cycles were identified using a paired Student's t-test (PROC t-test paired).
Results
Blood parameters
Progesterone and oestrogen
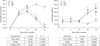
The concentrations and time dependent changes of P4 and oestrogen were as expected. The P4 concentration was higher and the oestrogen was lower in pregnant heifers than non-pregnant heifers and during control cycles on day 16 and 18 (p < 0.05; Fig. 2).
IGF1, IGF2 and GH
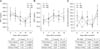
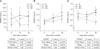
The IGF1 concentrations were comparable between different non-pregnant (negative control cycle and non-pregnant) cycles and the pregnant cycle. However, a significant decrease was observed from day 0 to day 16 (p < 0.0001). This decrease was followed by an increase between day 16 and 18 in the respective negative control cycle (0.00119) (panel A in Fig. 3). During pregnancy, no increase in IGF1 concentrations between day 16 and 18 (p = 0.7053) was observed.
Neither group nor time showed significant differences between the IGF2 and concentration during the pregnant cycle and the respective non-pregnant periods (negative control cycle and non-pregnant) between day 0 and 18 (panel B and C in Fig. 3).
IGFBP2, IGFBP3 and IGFBP4
Comparing the pregnant cycle with the respective negative control and non-pregnant cycles revealed no differences in IGFBP2 concentrations (panel A in Fig. 4). The IGFBP3 serum concentrations were comparable between all tested cycles of the heifers (negative control cycle, pregnant, and non-pregnant). However, IGFBP3 significantly increased (p = 0.0372) between day 0 and day 18 (panel B in Fig. 4). Interestingly, the IGFBP4 concentration was lower on day 18 compared to the respective non-pregnant and negative control cycles (panel C in Fig. 4).
Hepatic gene expression
The hepatic gene expression was comparable during the pregnant and non-pregnant cycles of the heifers (Table 2).
Discussion
The somatotropic axis is crucial for embryonic growth and development at the local uterine level, and a maternal adaption within parameters of the somatotropic axis in the blood circulation of the mother may support embryo development and healthy pregnancy in dairy cows. In contrast to studies in beef cattle [12], no differences in the IGF-1 concentration of pregnant heifers compared to their respective non-pregnant cycles was observed in the present study. It should be mentioned that very early pregnancy was the focus of the present study, and changes within the somatotropic axis due to pregnancy may occur later during pregnancy, as occurs in women [19]. However, a clear effect of the cycle on IGF1 and cycle and pregnancy status on GH was detected in the present study. In all tested cycles (negative control cycle, pregnant and non-pregnant), the IGF1 concentration decreased towards day 16, and GH increased between day 16 and 18 in the negative control cycle and non-pregnant group, but not in pregnant heifers, which is in accordance with the results of previous studies. In blood, IGF1 is lower during diestrus than oestrus, and GH increased during oestrus due to estradiol [1117]. Moreover, endometrial IGF1 gene expression in dairy cattle decreased from day 5 after ovulation to day 13 [428]. Interestingly, in the present study, IGF1 increased between day 16 and 18 in the non-pregnant cycle. In contrast, parallel to the constant GH level, no increase in IGF1 was measured in pregnant heifers. This difference might also have been due to the influence of estradiol. As confirmed in the present study, the oestrogen concentrations were lower during pregnancy on day 16 and 18 when compared to non-pregnant cycles, when the heifers were already in oestrus. As stated above, IGF1 and GH concentrations increase during oestrus in heifers [17], which has been experimentally confirmed by estradiol injections in ovariectomized cows [4]. This increase in IGF1 might be due to elevated GH-concentrations on day 18 [417] and can be assumed from the numerically higher GH-levels on day 18 in non-pregnant cycles in the present study. However, this increase in GH between day 16 and 18 was not statistically significant due to the high standard deviation, which might originate from the pulsatile release of GH from the pituitary. The hepatic IGF1 expression was also comparable between the tested cycles at day 18. One limitation of the study was that day 18 hepatic gene expression was not measured in the control cycles, and only one liver biopsy was taken on day 18 to prevent disturbance of the early pregnancy phase. Therefore, only pregnant and respective non-pregnant cycles on day 18 could be compared, and no time dependent changes within the mRNA expression could be detected.
Geisert et al. [8] also demonstrated higher gene expression of IGF2 mRNA in the endometrium obtained from pregnant cows when compared to endometrium taken during an oestrus cycle on day 15 and 18. However, these changes were not reflected in the maternal blood in the present study during the early phase of pregnancy. The IGF2 concentrations were comparable between all tested cycles (negative control cycle, pregnant and non-pregnant cycles).
On one hand, IGFBPs are important as transport proteins for IGF1 and IGF2, as well as for extension of the half-life, while on the other hand, the binding of IGFs to their respective IGFBPs can modulate transport throughout the endothelium [1024]. The underlying biomechanism for the release of IGFs at the target cells is an enhanced protease activity of enzymes that degrade IGFBPs. During pregnancy, those specific proteases were described in humans. For example, the IGFBP3 concentration decreases during late pregnancy because of proteolytic degradation in humans [2026]. A decrease in IGFBP3 during late pregnancy has been described in cows as well [21]. Nevertheless, in the present study, maternal serum IGFBP3 concentration was not affected by pregnancy status. However, IGFBP3 increased throughout the cycle from day 0 to 18 in all tested groups. This increase is in contrast to the significant decrease of total IGF1 that occurred from the day of ovulation to day 16, which could be a counter regulatory mechanism to increase the total IGF1 concentrations to day 18. IGFBP3, which is the most abundant binding protein, extends the half-life of IGF1 [20]. Therefore, it was hypothesized that IGF1 might have an effect on the hepatic IGFBP3 expression. However, in human pregnancy, IGFBP3 decreases instead of increases throughout pregnancy [9]. Nevertheless, it was unclear if IGF1 and IGFBP3 have a biological link based on the results of the present study, because two important parameters were not addressed; namely, free IGF1 and the acid labile subunit, forming a tertiary complex with IGFBP3 and IGF1. In general, changes within the maternal IGF1 and IGFBP concentrations during the cycle could play a role in preparing the maternal metabolism for a potential pregnancy.
Notably, IGFBP4 concentrations were lower in pregnant heifers on day 18 relative to non-pregnant cycles as well as to the respective control cycle. These findings were surprising, and the most distinct difference between the pregnant and non-pregnant cycles (non-pregnant and negative control cycle). The hepatic mRNA expression of IGFBP4 did not differ between pregnant and non-pregnant cycles on day 18, which might suggest that a decrease in hepatic gene expression is not responsible for the lower serum IGFBP4 concentration. A comparable decrease in IGFBP4 during progressed pregnancy has been observed in women; however, during early pregnancy, IGFBP4 concentrations are higher in pregnant than in non-pregnant women [15]. The decrease in IGFBP4 during late pregnancy is believed to be due to a specific protease, the zinc-dependent metalloproteinase PAPP-A, which is known to specifically cleave IGFBP4 in the serum of pregnant women.
In the present context, it can be speculated that the IGFBP4 serum concentration decreased via elevated protease activity to release IGF molecules for local action, e.g., at the endometrial level. Moreover, it is known that the proteolytic fragments of IGFBP4 cleavage have further specific biological functions [315]. For example, these fragments play a role in the maturation and luteinisation of human ovarian cells, which in turn might be important to support maintenance of the corpus luteum [2327]. Currently, it is not clear which signal stimulates the induction of specific proteolytic enzymes, which mechanisms are responsible for decreasing IGFBP4 and whether bovine PAPP-A is involved in these processes in bovine species. Because PAPP-A has previously been described in bovine granulosa cells and in the context of follicle growth [27], a pivotal role for PAPP-A during bovine placentation is not unlikely; therefore, future studies should address this topic.
In conclusion, the results of the present study show that systemic blood concentrations of the components of the maternal GH/IGF system reflect involvement of the somatotropic axis in the complex processes of metabolic adaption during early pregnancy. Whether IGFBP4 could serve as a potential biomarker for pregnancy on day 18 and of embryonic survival should also be elucidated.


 XML Download