

 PDF
PDF ePub
ePub Citation
 Print
Print


INTRODUCTION
A growing aging population, shifts in disease structure from acute to chronic, and other socioeconomic and medical changes have put a strain on the health care delivery system. The challenge we face is to compensate for and adjust to these changes in light of limited medical resources while satisfying the diverse health care needs and demands of the public. To do so, the government needs to optimize the allocation and application of those resources in line with the public's health care needs [1]. The medical workforce is an essential part of the infrastructure of a health care system. As such, an imbalance in the supply and demand of the health care workforce will adversely affect the quality of care patients receive. Human resources management strategies to address such imbalances in health workforce supply and demand must be formulated to avoid potentially serious long-term effects on the national health care system. Strategies must be formulated to ensure sufficient supply, training, distribution, and efficiency of the health workforce [2]. However, such ideal workforce policies have yet to be realized [34].
The inherent characteristics of the medical market can cause an imbalance in workforce supply and demand, which can lead to serious problems such as an oversupply of specialist physicians. Such an oversupply dissipates limited resources and can escalate health care costs by creating a supply-induced demand [56]. Conversely, a health workforce shortage will deprive the public of quality medical services, particularly to populations with restricted access to health care providers. In part, health workforce shortage is a consequence of the 10-plus years required to produce physicians, a time frame that prevents adequate short-term regulation of the workforce. In this respect, workforce management strategies for each medical specialty are as important as those for the health workforce as a whole because an imbalance in the supply and demand of physicians in a given specialty cannot be compensated for by physicians of another specialty [1]. Indeed, regardless of adequacy in the entire physician workforce, oversupplies in some specialties make it harder for job seekers to get a position, whereas undersupplies in other specialties cause workforce shortages. One major reason for this is that residents who prefer higher medical prices, lower risks, and relatively easier programs apply for specialty positions disproportionately, making some specialties over-competitive and others less [7].
In this respect, a workforce plan for specialists should be reviewed in a scientific and practical manner. Such a plan should also include overall factors to train and utilize an adequate number of human resources for its management [8]. Therefore, it is important to devise a measure that can help to prevent an imbalance in the supply and demand for physicians and specialists before such problems become severe. Observing changes in the medical market, especially phenomena such as a decrease in the birth rate, an increase in the aging population, and changes in the number of elderly with chronic illness, is crucial along with analyzing the supply and demand for specialists by using new and adequate assumptions and projections. Under these circumstances, this article intends to offer basic data that are necessary to establish a future workforce plan for urologic surgeons by projecting supply and demand according to various scenarios.
MATERIALS AND METHODS
1. Research data
The data used to project the supply of urologists were as follows. Statistics on the current numbers of specialists, practicing and nonpracticing specialists, and retired or emigrated specialists were extrapolated from data provided by the Korea Medical Association, the Korean Urological Association, and the health and welfare statistics annual report by the Ministry of Health, Welfare and Family. To assess the increase in number of specialists, data on residency program enrollment quotas and actual numbers accepted were extrapolated from hospital accreditation reports from the Korea Hospital Association, whereas data on medical school enrollment quotas, graduation rates, and licensing examination pass/fail rates were from the health and welfare statistics annual report. Data from records maintained by the Korean Urological Association were used to analyze residency program completion rates and licensing examination pass rates. Attrition of the specialty physician workforce due to death, retirement, and emigration was calculated based on data from the National Statistics Office. Data from the Korean Urological Association on the number of urologists in both clinical and nonclinical sectors were used to project demand. Estimates of future population were tabulated based on data from the National Statistics Office.
2. Projection model
Under the condition that the current manpower training system did not change, 2 projection methods were used: the in-and-out moves method and the demographic method. The in-and-out method predicts fluctuations in the supply of urologic surgeons based on 2 components: inflow and outflow. The demographic method estimates the supply of urologists in the target year by age by using data on the aggregate number of urologists and their age structure and gains and attrition between the base and target years. These estimated supplies were tallied. Thus, the number of specialists each year can be calculated by adding the gains to the number of specialists in the previous years and by then subtracting attrition (Supplementary Table 1).
For demand projection methods, a model used at the Bureau of Health Professions of the Health Resources and Services Administration in the United States was applied (Supplementary Table 2). This model was designed to consider a number of factors including population size, structural changes in population, and changes in health care insurance services. To project urologist requirements, the base year was set to 2012 and the target years to 2015, 2020, 2025, and 2030. Levels of demand projection were divided into 3 stages. In stage 1, the utilization rate of the base year was calculated, and in stage 2, the utilization rates of the target years were calculated. In stage 3, the number of required specialists was projected based on the utilization rates of the target years.
3. Projection assumptions
Assumptions made to project the supply of urologists were as follows. First, the number of future residency program entrants depends on the entrance quota set by the government's reduction policy. Thus, a 10% decrease in the entrance quota from 2004 to 2007 of each medical school led to a decrease in the number of residents and consequently to a reduction in the supply of surgeons. Second, from 2014, the entrance quota for residency programs will be fixed on the total number of first-year residents in 2018, and the reduction in the total number of entrants will be reflected until 2015. Third, for a pass rate, the average of the past 5 years was applied. For residency program completion rates and enrollment rates, averages of the past 3 years were applied. Fourth, the number of students who graduated from international medical schools and those who immigrated had a negligible impact on the supply of specialists and therefore were not included in the calculations. Fifth, the mortality rate for urologists was derived from the National Statistical Office's data on mortality rates by age group. Sixth, the number of emigrated specialist physicians over the past 5 years was included in the calculations. Seventh, urologists over 71 years of age used to be categorized as retirees, but those who still worked were classified as workers at this time.
Assumptions made in the projection of demand were as follows. The total urologic workforce demand is an aggregate of the requirement for clinical urologists based on patients' utilization rates and nonclinical urologic surgeon requirements, such as those in education, administration, or research. First, the nonclinical urologist requirement was projected based on the projected clinical urologic requirement derived from the amount of care provided by specialist physicians staffed at general hospitals, private hospitals, and other medical facilities. Second, revised demographic numbers after the application of weighted age, which reflects the differences in utilization by age, were applied. Data for this were extracted from a report published by the National Statistical Office in 2012. Third, increase and decrease trends in the utilization rate of urology were applied by linear and nonlinear models. For the linear model, simple averages and geometrical means were used. For the nonlinear model, the rates were forecasted by using the autoregressive integrated moving average (ARIMA) method from logit junctions and time series analysis of curve estimation. Productivity of urologists was projected based on the amount of medical treatment/consultation of 2012. Fourth, the conversion index representing the ratio of the number of inpatients to the number of outpatients of a urologist was assumed to be 4.23. A contribution rate of 26.3% was applied as a ratio of medical contribution to the number of specialists. Fifth, the number of working hours of urologists in a week was 53.6, and the number of consultation hours in a week was 33.5. The proportion of nonclinical specialists was 7.7%. Last, the productivity of specialists was assumed to be 100%, 90%, and 80% on a year 2012 basis.
In the case of productivity, there are actual amounts of treatment and optimum amounts of treatment. Using an actual amount of treatment has the advantage of having a more practical basis. However, there is a problem in applying the current amount of medical treatment to the future, as an actual amount of medical treatment is volatile to social economic changes and number of patients. This can be overcome by using an optimum amount of treatment, but there occurs new issues of adopting the standard of “optimum” and doubts on whether urologists would follow such standards or not. There is no perfect standard, but because the supply and demand problem is a more substantive problem, in this article, the productivity value was projected on the basis of the actual medical treatment of urologists.
RESULTS
1. Projections of supply
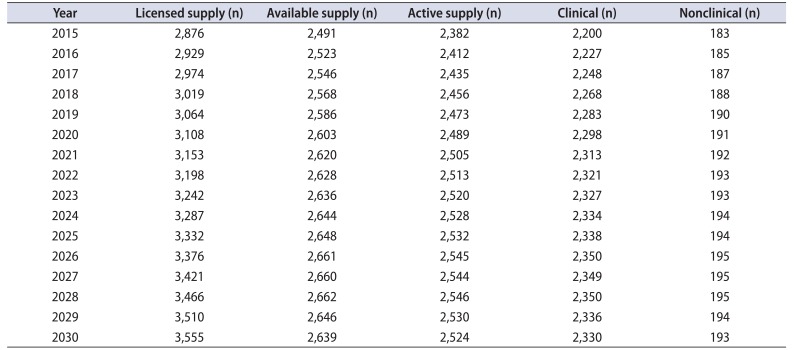
The number of urologists who were issued a license increased more than 3.3 times from 809 in 1991 to 2,724 in 2013. When the 6-year enrollment rate of first-year urologists was analyzed, the results showed that the number decreased from 115 in 2008 to 96 in 2013. The enrollment rate also decreased from 94.8% in 2008 to 44.8% in 2013 (Supplementary Table 3).
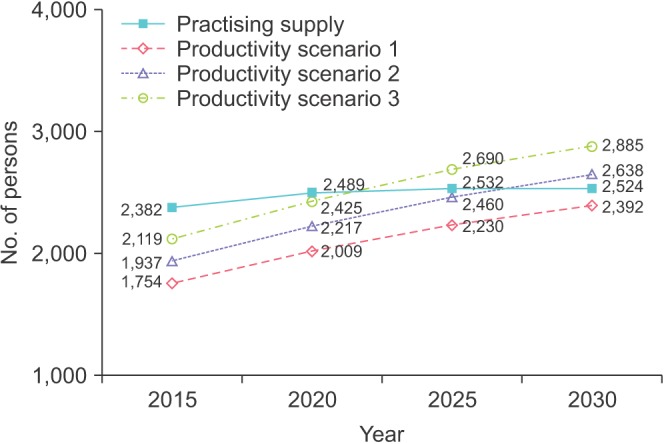
When projecting the supply of urologists, the previous 3-year enrollment rate of urologists, 48.9%, was applied on behalf of the quota of specialists (Supplementary Table 4). Also, from 2018, the number of urologists was fixed to that of the number of first-year specialists in 2014. In July 2003, the Ministry of Welfare proposed that they would gradually reduce by 351 the entrance quota of medical colleges between 2005 and 2007. Thus, the reduced quota was reflected in the quota of specialists for 2015. In the case of the urologists' pass rate for the national examination, an average of the rate from 2009 to 2013 (96.91%) was applied, and the average completion rate from 2011 to 2013 was applied (94.44%). In this study, the available manpower (number of working physicians) was defined as the number of people with licenses, subtracted by lost manpower, such as deceased or retired people. The available manpower was expected to reach 2,491 in 2015, 2,603 in 2020, 2,648 in 2025, and 2,639 in 2030. The number of active specialists, applied by activity ratio on available manpower, was forecasted to increase to 2,382 in 2015, 2,489 in 2020, 2,532 in 2025, and 2,524 in 2030 (Table 1). However, such an increased rate of active manpower was predicted to decrease gradually by 4.5% from 2015 to 2020, by 1.7% from 2020 to 2025, and by 0.3% from 2025 to 2030.
2. Projections of demand
Based on the medical demands of patients, demand for urologists was calculated by aggregating demand for clinical and nonclinical urologists who work in the fields of education, administration, or research. First, demand for clinical urologists who work at general hospitals, hospitals, and clinics was projected. The method of population projection was revised by applying a weighted value of the utilization rate to the future population, which was forecast by the Ministry of Statistics. The weighted value of the utilization rate used was considered by the relative utilization rate for different age groups. Relevant data for urologists were tallied by the Health Insurance Review and Assessment Service. The weight of age group k represents a ratio of the medical utilization rate of the age group relative to that of the whole population. Below is the equation for the weight of medical utilization and its outcomes.
where P is total population and U is utilization (Supplementary Table 5).
1) Results of projection of demand for clinical urologists
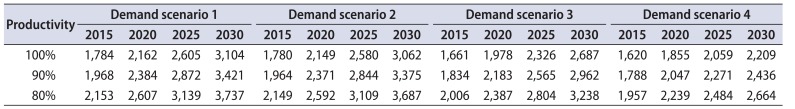
First, the amount of required medical services of clinical urologists by 2025 was projected. The results of the projection of demand according to medical treatment productivity are indicated in Table 2. In the case of scenario 1 (projection method applied by average increasing rate), a minimum of 1,784 to a maximum of 2,153 specialists were projected to be required in 2015. Under the third scenario (projection method applied by a logit model from the curve estimation), a minimum of 1,661 to a maximum of 2,006 specialists was projected to be required in 2015, and 2,687 to 3,238 in 2030. According to the fourth scenario of demand projection (method of projecting increasing rate of medical use: ARIMA model), a minimum of 1,620 to a maximum of 1,957 specialists would be required in 2015 and 2,209 to 2,664 specialists will be needed in 2030.
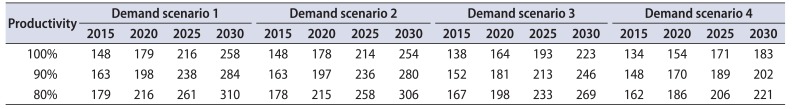
2) Results of projection of demand for nonclinical urologists
Table 3 illustrates the projection of demand for nonclinical urologists such as those working in education, administration, or research. The requirements f or nonclinical urologists were calculated by applying the percentages of nonclinical urologists to the requirement for clinical urologists. In scenario one, the minimum number of nonclinical urologists required in 2015 was a minimum of 148 to maximum of 179. In 2030, the minimum will be 258 and the maximum 310. In scenario 2, the minimum number of nonclinical urologists required was 148 and the maximum 178 in 2015. By 2030, the minimum required will be 254 and the maximum 306. In scenario 3, 138 to 167 nonclinical urologists were projected to be needed in 2015, and 223 to 269 in 2030. In scenario 4, 134 to 162 nonclinical urologists were projected to be required in 2015, and by 2030, 183 to 221 will be needed.
3. Comparison of supply and demand
This article also compares the projection of supply with the projection of demand for each scenario.
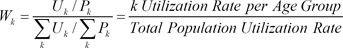
1) Projection of supply and demand: demand scenario 1
Indicated in Fig. 1, the imbalanced supply and demand for urologists under demand scenario 1 (value of demand projection applied by average increasing rate of medical use) varied according to the productivity of the specialists. By 2015, an oversupply of a minimum of 50 to a maximum of 450 specialists was expected to occur. However, this will change from oversupply to undersupply as time goes on: thus, an undersupply of 289 to 868 specialists is projected in 2025 and of 837 to 1,524 specialists by 2030 (Supplementary Table 6).
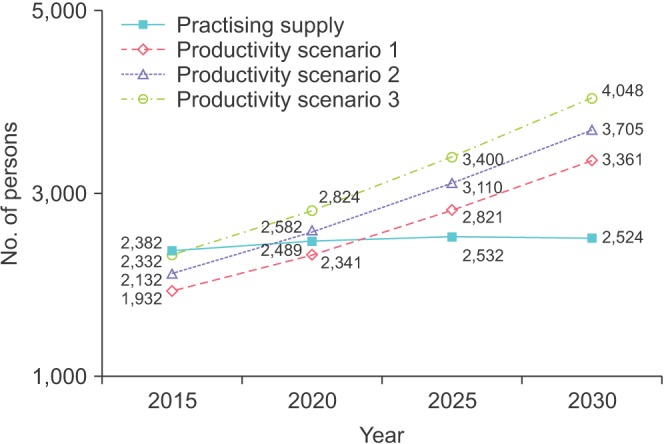
2) Projection of supply and demand: demand scenario 2
The projection of supply and demand under demand scenario 2 exhibited a similar modality. As illustrated in Fig. 2, an oversupply of a minimum of 55 to a maximum of 455 specialists was expected to occur by 2015. The phenomenon of undersupply will be aggravated as time goes, and by 2025, following the productivity scenario, the supply will be caught short by 262 to 835 specialists. In 2030, an undersupply of 792 to 1,469 specialists is expected to occur (Supplementary Table 7).
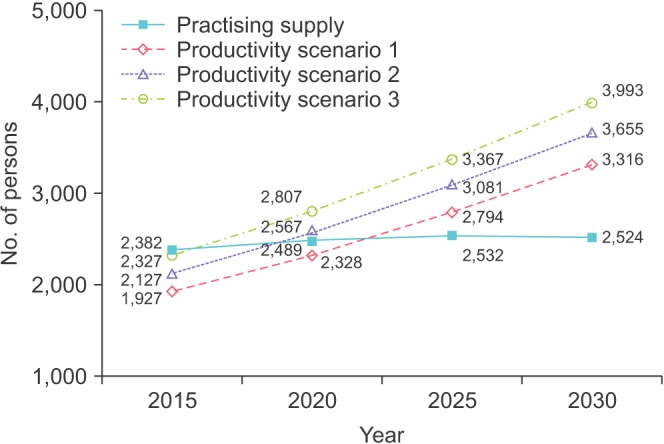
3) Projection of supply and demand: demand scenario 3
Under demand scenario 3 (value of demand projection using increased utilization rate calculated by applying a logit model from the curve estimation), the imbalance in supply and demand varied in relation to the productivity of the specialists. As shown in Fig. 3, an oversupply of a minimum of 209 to a maximum of 583 specialists was expected occur by 2015 depending on productivity scenario. However, there will be a shift from oversupply to undersupply as time goes on. As a result, the supply will be short by a minimum of 386 to a maximum of 983 specialists depending on the productivity scenario applied (Table 4, Supplementary Table 8).
4) Projection of supply and demand: demand scenario 4
Under demand scenario 4 (demand projection using rate of medical use increase applied by the ARIMA model), the demand for urologists was smaller than the demand under scenario 3. In other words, the level of imbalance in supply and demand was alleviated compared with demand scenario 3. As indicated in Fig. 4, an oversupply of a minimum of 263 to a maximum of 628 specialists was expected to occur by 2015. This phenomenon of oversupply will decrease as time goes on. After 2025, oversupply and undersupply will both occur depending on the productivity scenario applied, but according to productivity scenario 1, urologists will experience a supply excess (Table 4, Supplementary Table 9).
DISCUSSION
The in-and-out flow method used in this research can be used to estimate the size of the future workforce by employing past time series data on factors that affect the addition and attribution of the workforce. Since this method is more accurate than other analysis methods, it is the method most commonly used when projecting supply of the medical workforce. The weakness of this method is that the accuracy of estimation is seriously damaged when there are rapid changes in the social environment or medical policies, which significantly affect the addition and attribution of the workforce. It is possible that there might be favorable changes in the entrance quota of medical institutions or the number of positions in urology residency programs, thus expanding the size of the workforce after opening the medical market and reforming medical policies. However, the influence of such changes will not stretch toward the target year, resulting in only minor changes. The next point is that the data used in this research to project the supply of urologists covered all licensed urologists in the nation. Thus, use of these projections is more reliable than the use of data stored by the Korean Urological Association, which were garnered on the basis of surveying the members of the association only. Accuracy in estimating the number of available physicians, including practicing physicians in both the clinical and the nonclinical sector, has increased. Last, it was assumed that physicians who emigrated to other countries or immigrated into Korea would not affect the urologist workforce, because there will not be many international urologists coming in and practicing in Korea despite the opening of the medical market and also not many Korean urologists expected to go abroad.
In general, there are more controversial issues in the process of projecting the requirements than of projecting the supply. There are no exceptions when projecting the requirements for the urologist workforce. First, this research could not factor in differences in productivity between urologists at hospitals and those at clinics. Urologists at hospitals and at clinics face different types and mortality of diseases. However, this research did not distinguish between the productivity of urologists at hospitals and that of urologists at clinics owing to a lack of data. Demand for urologists might change depending on the utilization of hospitals and clinics, but such a factor will cause only a minor effect. Second, the method used to project the requirements could not tell whether the current or future medical utilization rates were adequate or not. Nor does it suggest what will be an adequate level of medical utilization. Therefore, this research cannot confirm that the requirements for urologists, projected by using the medical requirement model, are adequate. Not only that, this research might have over- or underestimated demand for the workforce, because it did not consider the effects of work commission or substitution among different parts of the medical workforce [9]. Finally, this research did not consider the effects of numerous health care policy changes on medical demand, which is the foundation of demand for urologists. Originally, the Health Resources & Services Administration's requirement model was designed to consider various factors such as different medical prices, health insurance coverage, population changes, and other noneconomic factors. However, there were not enough basic studies on the effects of changes in medical prices, the payment and reimbursement system, and other noneconomic factors. Therefore, it was difficult to take them into consideration. However, this research tried to overcome such limitations by applying weighted values by age, the linear model (simple average and geometric average), and the curve model (logit model and ARIMA model) to tendency of people's medical use. Thus, although factors that might have affected demand were not reflected, a model with all the factors such as noneconomic factors was used to alleviate this problem.
This research shows how the degree of imbalance in supply and demand for urologists can change in direction under each scenario of entering urology residency programs. When comparing the results of demand scenarios 3 and 4, which are most relevant under productivity scenario 1 (2012 productivity), the supply of urologists is expected to be in excess by 2025 under the current enrollment rate of specialists (43.5% in 2012). However, the imbalance in the supply and demand for urologic surgeons will not be as severe by 2030 if the current enrollment rate persists. That is, the degree of imbalance will be alleviated with a 43.5% occupancy rate of current urologic residents by 2030. Thus, a comprehensive policy encompassing these factors should be established with appropriate solutions.
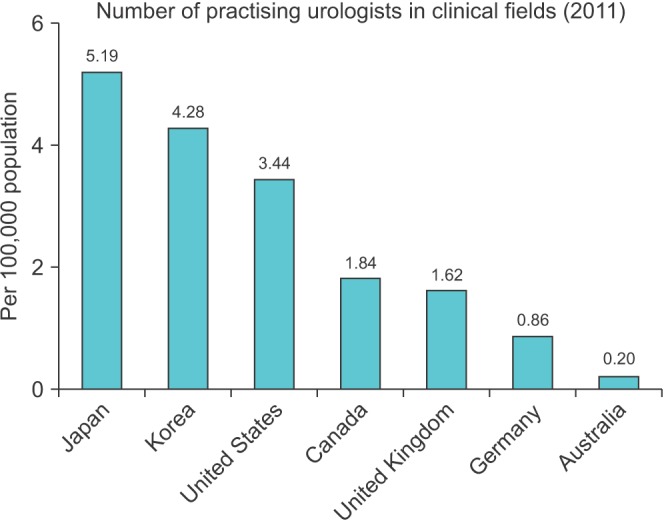
Last, by comparing the quantity of Korean urologists with that of major countries abroad, the adequacy of supply of specialists can be estimated. Because the medical system, treatment patterns, and medical utilization differ by country, doctor, and patient, such information cannot be directly applied to the supply and demand policy of Korean urologists. However, because indirect policy recommendations can be drawn, comparison between Korea and other countries is worthwhile. The most recent foreign resource is for 2011, which is a base year for comparison between Korea and Organization for Economic Co-operation and Development countries. The number of urologists in Korea is 4.28 per 100,000 people. This is lower than in Japan, which recorded 5.19, but 21 times higher than in Australia and 1.24 times higher than in the United States (Fig. 5). Moreover, the tendency was similar when comparing years with similar levels of aging population.
Factors affecting the supply and demand for urologists are complicated. Complex interactions exist between medical fees, medical accidents, and difficulties in training residents. Thus, a comprehensive policy encompassing these factors should be established to develop appropriate solutions. Another important factor in projection is to have clear assumptions for the methods being used in the research. Small differences in assumptions make a distinction in the end results. Thus, reliable human resource projection is required to clarify demand, roles and responsibilities of patients, and tasks of urologic surgeons. To achieve this, consistent discussion and negotiation among not only urologists but also with other nonmedical stockholders such as administrators, patients, and family members is necessary [10]. Human resource issues related to urology are dynamic and can be affected by both external and internal factors.
In this context, research based on projecting the demand for the future workforce of urologists needs to expand the range of research targets. Appropriate projection of the future workforce should factor in not only internal factors like working hours but also external factors such as the aging population and range of patients and diseases entailed by such phenomena. Follow-up research should deal with what was not discussed here.
CONCLUSIONS
This study shows that the number of residents needs to be reduced according to the supply and demand for urologic surgeons. Moreover, a policy should be established to maintain the current occupancy rate of residents. In addition, factors affecting the supply and demand of urologic surgeons are complicated. Thus, a comprehensive policy encompassing these factors should be established with appropriate solutions. Another important factor when making projections is to have clear assumptions for the methods being used in the research. Thus, reliable human resource projection is required to clarify demand, roles and responsibilities of patients, and tasks of urologic surgeons.

 XML Download