

 PDF
PDF Citation
 Print
Print


Introduction
Patient-controlled analgesia (PCA) is the best technique for the management of acute postoperative pain when intravenous (iv) opioid administration is used [12]. Appropriate use of PCA devices is crucial to ensure adequate pain relief. However, some patients do not use these devices correctly, reducing their efficacy. Pain therapy and appropriate PCA usage are difficult to assess objectively.
Studies evaluating PCA therapy usually assess distinct variables including pain scores through subjective scales and opioid consumption [34]. Analgesic demand is an indirect measure of pain. However, side and secondary effects limit analgesic consumption measurements, despite their clinical relevance [5].
The ratio between demanded and delivered PCA boluses in 24 h (the so-called demand/delivery ratio or DD ratio) [6] is a simple, objective method of analgesic assessment. It can be useful for evaluating the ‘correct’ use of a PCA device, but it is rarely considered in the literature.
The Silverman integrated approach (SIA) is a sensitive method for the assessment of overall pain relief and morphine consumption [7]. This approach provides a combined rank-based analysis of pain score and opioid consumption and may be helpful for evaluating correct PCA device use. In addition, the SIA score can be upgraded to include other variables.
In this study, we retrospectively investigated the effects of re-instruction on proper PCA device usage on the first postoperative day visit after colorectal surgery. The analyses were based on single-variable (DD ratio, pain scores, morphine consumption) comparisons between the 24 and 48 h visits in patients needing re instruction. We also compared the data for re-instructed patients with a control group of not re-instructed patients. Additionally, we tested the new comprehensive-SIA score (C-SIA score) based on the integration of subjective measures (at rest and movement pain scores) and objective ones (morphine daily consumption and DD ratio). For this, original SIA and C-SIA score comparisons were performed between groups.
Materials and Methods
Data concerning patients undergoing morphine PCA therapy after open colorectal surgery were analyzed from a previous retrospective study, based on a sample of patients collected between May 2008 and December 2011 [8]. A separate Institutional Review Board authorization was obtained for the current study.
All patients who underwent open colorectal surgery between September 2011 and December 2011 at the Fondazione IRCCS Istituto Nazionale dei Tumori of Milan were reviewed. We selected the last 4 months of the primary study [8] to enroll patients treated as homogeneously as possible. In fact, during that period, the acute pain service was made up of dedicated staff nurse and senior residents. Only complete data for opioid-naïve adult patients treated with morphine iv PCA for at least 2 days were collected. Patients treated with methadone PCA or epidural analgesia or transferred to the intensive care unit postoperatively were not included. The DD ratio, pain scores at rest and movement (verbal numerical scale, VNS, an 11-point scale from 0 = no pain to 10 = insufferable pain), and morphine daily consumption at 24 and 48 h after surgery were reviewed. Data were retrieved from the electronic acute pain service database and collected in a Microsoft Excel spreadsheet. Patients were grouped according to whether they needed re-instruction on the correct use of the PCA pump device at the 24 h visit. Physicians in the acute pain service provided re-instruction according to their own clinical evaluation of subjects at the first postoperative visit (24 h after surgery). Generally, high pain scores (VNS at rest > 3 and movement > 6), low morphine consumption (< 20–30 mg during the first 24 h after surgery) [179], and DD ratios > 1 indicated patients needing re-instruction.
PCA pumps were programmed as previously suggested [101112]: a demand morphine dose of 1 mg, a lock-out interval of 6 min, no hourly bolus limit, and no continuous basal infusion. Patients who received different PCA treatment protocols were excluded from the analysis. In addition to PCA treatment, all patients received ketorolac 30 mg iv 30 min before skin closure and every 8 h after intervention. No loco-regional anesthetic technique was used.
To assess the re-instruction intervention, the primary end-point was the DD-ratio change between the 24 h postoperative visit and the 48 h visit (after the re-instruction intervention) in re-instructed patients. The same comparison was performed according to pain scores at rest and movement, and morphine consumption, as commonly reported in the literature. Then same data were compared between re-instructed and not re-instructed patients at equal time points. Secondarily, the two groups were compared according to the SIA and the C-SIA scores to show agreement with the standard analytical approach. The C-SIA score was calculated extending the SIA approach of Silverman et al. [6], which integrates the pain score and morphine consumption. The C-SIA score was obtained integrating VNS at rest and movement, morphine consumption, and the DD ratio. The computation of SIA and C-SIA scores was performed as follows. First, patients were ranked and the mean rank (MR) was calculated: MR = (N + 1) / 2 (where N is the total number of subjects). Then pain scores at rest and movement, morphine consumption, and DD ratio were ranked from lowest to highest. Next, the percentage difference (X*n) of each variable from the mean rank on a per-subject basis (n) was computed as follows:
where the variable ranks are represented as Xn(i) (i stands for VNSr for VNS at rest, VNSm for VNS in movement, MC for morphine consumption, and DD for DD ratio). Finally, SIA and C-SIA scores were calculated as a summed percentage difference for each variable, as follows:
and
The Kolmogorov-Smirnov test showed a skewed distribution of continuous variables, so, non-parametric tests were used to analyze these data. Intra-group variability between 24 and 48 h after surgery was analyzed using the Wilcoxon signed-rank test. The Mann-Whitney U-test was used for inter-group comparisons for both single variables and SIA and C-SIA scores. Discrete variables were compared to Fischer's exact test. The correlations between pain scores, morphine consumption, DD ratio, C-SIA score, and SIA score were assessed using Spearman's rank coefficient. To detect multicollinearity between C-SIA score factors, step-wise linear regression analyses with multicollinearity tests were performed using variance inflation factors (VIF) analysis. A VIF > 4 warranted further investigations while a VIF > 10 was considered a sign of serious multicollinearity. Finally, a Bland Altman analysis and linear regression were used to assess the agreement between the C-SIA and SIA scores.
Data are reported as medians (25th–75th percentiles). A P value of < 0.05 was considered to indicate statistical significance for paired comparisons. Statistical analyses were performed with SPSS software (ver. 19.0; IBM Corp., Armonk, NY, USA) and Prism (ver. 5.0; GraphPad Software, La Jolla, CA, USA). Two-tailed post hoc power analyses were performed with G*Power (ver. 3.1; http://www.gpower.hhu.de) [13]. Graphs were drawn with Prism.
Results
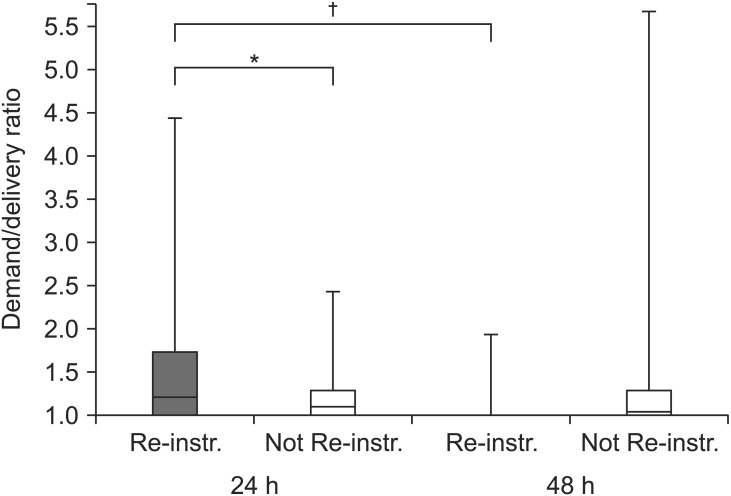
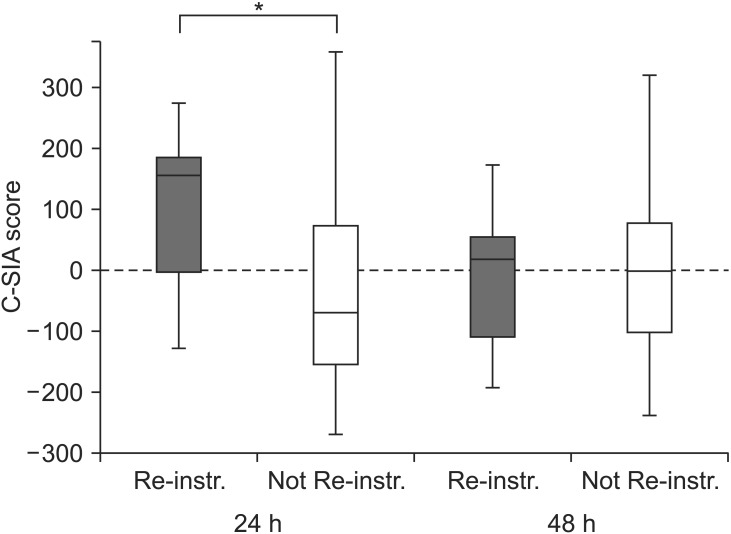
From September 1 to December 31, 2011, 91 patients underwent elective open colorectal surgery for cancer at the Fondazione IRCCS Istituto Nazionale dei Tumori of Milan, Italy. Of these, 41 were excluded from the study because of postoperative intensive care unit recovery (5), epidural analgesia treatment (15), methadone PCA (10), and incomplete records (11). Thus, data from 50 patients (16 re-instructed vs. 34 not re-instructed) were extracted from the acute pain service electronic database (Table 1). Table 2 summarizes data collected regarding DD ratios, pain scores, morphine consumption, and SIA and C-SIA scores. The DD ratio decreased significantly from the 24 h to the 48 h visit in re-instructed patients (P = 0.011; mean difference [95% CI] = −0.9 [−1.571 to −0.245]; Fig. 1). Conversely, it did not change in not re-instructed patients (P = 0.427; mean difference [95% CI] = 0.14 [−0.222 to 0.513]). The DD ratio was higher for re-instructed patients than not re-instructed patients 24 h after intervention (P = 0.018), and equal in both groups at 48 h (P = 0.154). Morphine consumption was higher for re-instructed patients at 24 h (P = 0.011) and equal for both groups in the subsequent 24 h (P = 0.511). VNS at rest and movement were higher for re-instructed patients 24 h after surgery (P = 0.024 and P = 0.012, respectively) but not after 48 h (P = 0.173 and P = 0.185). Both SIA and C-SIA scores decreased significantly after re-instruction intervention (P = 0.034 and P = 0.006, respectively). The SIA and C-SIA scores were each significantly different between study groups only at 24 h after intervention (Table 2, Fig. 2). In addition, 25% (4/16) of re-instructed patients and 61.8% (13/34) of not re-instructed patients had a negative C-SIA score (P = 0.032).
The DD ratio showed a moderate correlation with VNS at rest at 24 h (r = 0.485, P < 0.001) and a strong correlation with morphine consumption at 24 h (r = 0.583, P < 0.001). At the 48 h time point, a moderate correlation was observed between DD ratio and morphine consumption (r = 0.328, P = 0.020). VNS at rest and morphine consumption at 24 h showed a weak correlation (r = 0.292, P = 0.039). A strong correlation was found between VNS at rest and in movement 48 h after surgery (r = 0.692, P < 0.001).
The C-SIA score showed a higher coefficient of correlation with the DD ratio (r = 0.815, P < 0.001) than the SIA score (r = 0.663, P < 0.001). A strong correlation was also observed between the C-SIA and SIA scores (r = 0.863, P < 0.001). The independent factors of the C-SIA score (VNS scores, morphine consumption and DD ratio) were not affected by multicollinearity (all VIF values < 2.5).
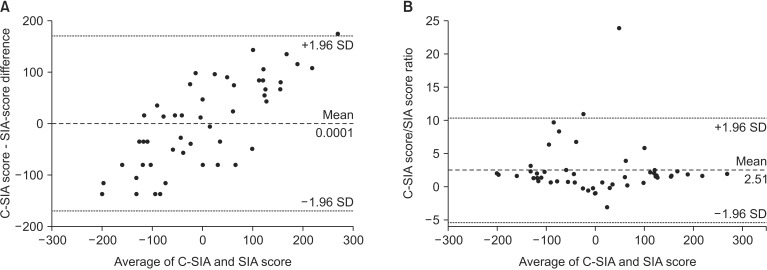
The Bland-Altman analysis showed an almost null mean difference between C-SIA score and SIA-score with a wide agreement range (−170.3, 170.3) and a proportional difference variability across the range of the average (Fig. 3A). The correlation coefficient between the C-SIA and SIA difference and their mean was 0.779 (P < 0.001) and the resulting regression equation was y = 0.581x (intercept = 0, slope [95% CI] = 0.581 [0.445–0.716]; P < 0.001). The Bland-Altman was rearranged, and the ratio between C-SIA and SIA-score was plotted against their average [14]. This gave a constant mean ratio of 2.51 between the two scores through their mean (Fig. 3B).
Finally, post hoc power analyses were performed, adopting a two-tailed test and setting the alpha error to 0.05. A group sample size of 16 achieved 80% power to reject a difference in 0.9 (SD = 1.2) among DD-ratio means (the primary outcome) between the 24 h and 48 h postoperative visits in re-instructed patients.
Discussion
This study demonstrated the efficacy of re-instruction intervention 24 h after surgery for patients who did not use the PCA device properly. We compared DD ratios in patients needing re-instruction before and after the re-instruction. As expected, re-instructed patients showed a decrease in median DD ratio at the 48 h visit (P = 0.011), suggesting the efficacy of the re-education. Furthermore, to better evaluate the intervention, we compared re-instructed patients with a not re-instructed sample of patients, as a control group. Re-instructed patients showed higher median DD ratios 24 h after the operation than not re-instructed patients (P = 0.018) but this difference was not observed 24 h later (P = 0.154). Similarly, VNS scores at rest and movement were higher in re-instructed patients 24 h after surgery. These data indicate that re-instructed patients failed to self-administer the necessary amount of morphine to achieve adequate pain relief. Furthermore, the median DD ratio of re-instructed patients (1.26) was close to 1.35, the cut-off value previously proposed to re-instruct patients or adjust PCA therapy plans [7].
Differences in VNS scores at rest between groups were statistically, but not clinically, different. That is, there was no clear clinical difference between the groups despite the need for re-instruction in some patients. Pain scores were not different between study groups at 48 h after intervention. Thus, a standard analytical approach did not seem to completely justify re-education. In fact, the postoperative visit was based on VNS scores, drug consumption, and DD ratio assessment, but not on the verification of a correct understanding of PCA device use. Seeking to increase the overall assessment of patients for descriptive purposes, we proposed an approach that expands the original SIA score, presenting a comprehensive score, named C-SIA. The C-SIA score, useful for the evaluation of iv PCA therapies, is based on the integration of four main variables: static and dynamic pain scores, morphine consumption, and the DD ratio. This overall score gives a modern global quantitative summary of variables that can be used for the comparisons of different treatments in clinical research.
SIA and C-SIA scores were each significantly higher in re-instructed patients at 24 h, indicating the worst pain relief, unfavorable morphine consumption, and poor DD ratios. Thus, both the SIA and C-SIA scores reflected the sum of differences among the single variables. Similarly, the two scores correctly revealed overall equality between the study groups at 48 h after surgery.
As mentioned, the C-SIA score reflected the overall differences or equalities between the study groups, confirming its reliability as a summary score. This score depends strictly on the variables, giving an overview of PCA therapy. Being the sum of the ranked values of those variables, the C-SIA score directly reflects their overall trends. In our study, at 24 h after surgery, all variables were significantly different between the two groups. C-SIA scores were consistently different in similar ways and, moreover, showed a statistical significance comparable to the original SIA score (Table 2) [15].
C-SIA score consistency was confirmed by the absence of multicollinearity between underlying factors. High VNS scores at rest were not linked directly to high VNS in movement or high DD ratios. Similarly, morphine consumption did not necessarily correlate with DD ratios. This finding highlights the complexity of the efficacy analysis of PCA protocols.
Using a Bland-Altman analysis, first, the difference between the C-SIA score and SIA-score was plotted versus the mean of the two measures. This revealed an almost null mean difference between C-SIA score and SIA-score and a wide agreement range. After seeing the variability in proportional difference across the range of the average difference between the two scores highlighted by the classic Bland-Altman analysis, we also plotted the ratio between the C-SIA and SIA scores versus the mean of the two scores. This analysis revealed a constant ratio between the two scores: in particular, the C-SIA score was, on average, 2.5 times the SIA score. This is consistent with the high correlation and linear regression relationship found between the difference and the mean of the two scores. These data highlight the existence of a constant proportional bias between the two scores. Indeed, the absolute value of the C-SIA score, being based on more variables, always tended to be higher than the SIA score.
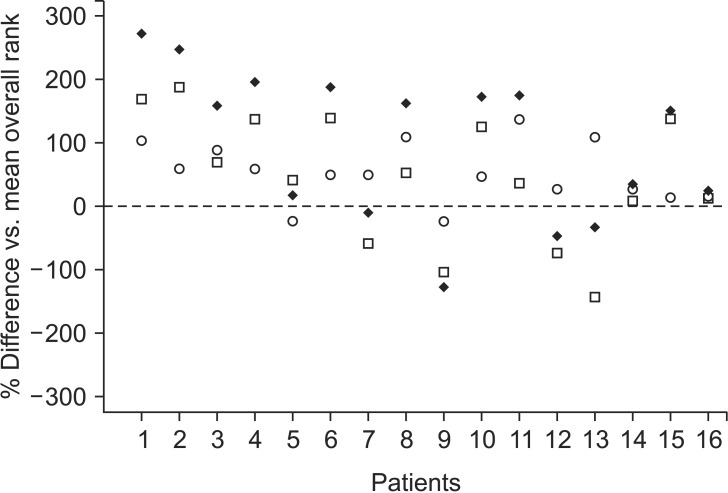
It is important to understand the relationship between variables and the derived C-SIA score. The difference between ranked variable values and median rank results was negative for low original values (i.e., low pain scores, low morphine consumption, low DD ratio) and positive for high ones. As Silverman et al. [6] proposed for the SIA score, the enhanced C-SIA score is a summary of these clinical variables and can be plotted on a graph reporting the overall score and individual data on VNS at rest and movement (subjective variables) and data on morphine consumption plus DD ratio (objective variables) to characterize a sample of patients (Fig. 4). A negative C-SIA score indicates patients with lower pain scores and DD ratios that require less morphine consumption. By contrast, higher pain scores, DD ratios, and morphine consumption will give a higher C-SIA score.
If the DD ratio is high, this means that the patient has re-quested more opioid doses than those permitted or used by most patients. This suggests incorrect use of the PCA device or an inadequate analgesia protocol (i.e., too low bolus dose or a too long lock-out period). The C-SIA score includes such data together with pain scores and morphine consumption. Thus, it enables an overall evaluation of the pain therapy. A high C-SIA value means inadequate pain relief, high morphine consumption, and a high DD ratio. However, while the DD ratio can be used at bedside to evaluate pain therapy, the C-SIA is not intended as a diagnostic tool but rather as a descriptive variable useful for characterizing groups of patients.
Our work had some limitations. First, this study was retrospective. Second, re-instruction was performed according to our daily practice, without a specific protocol. However, our criteria to identify patients needing re-instruction were well defined (i.e., high DD ratio and a high pain score with concurrent low morphine consumption) and were applied to all patients in the study. Third, the C-SIA score, similar to the SIA score, weights pain scores, morphine consumption, and the DD ratio equally. Other weighting methods might be more appropriate.
In conclusion, re-instruction is a primary and effective aim to optimize PCA therapy. The proposed C-SIA score is a simple and complete instrument to summarize several assessment variables in PCA therapy. This score correctly distinguishes between re-instructed and not re-instructed patients for the correct use of the PCA device. The calculation of this score using common statistical software is simple and its performance is comparable to the SIA score. Research study designs on pain management usually focus on a specific end-point, such as pain scores or morphine consumption. The C-SIA score allows the setting of a global end-point (as a composite outcome), based on both pain scores and PCA data. Thus, researchers can enrich their analyses and merge subjective (pain scores) and objective (morphine consumption and the DD ratio) data in an overall score that can substitute for the original SIA score.
 XML Download