

 PDF
PDF ePub
ePub Citation
 Print
Print


INTRODUCTION
The incidence of diabetes in Korea is on the rise. According to the Korean National Health and Nutrition Examination Survey (KNHNES) in 2007, the rate of diabetes reached 9.7% in adults older than 30 years; impaired fasting glucose reached 16.1%. Additionally, osteoporosis, and consequent fractures, are on the rise. In the KNHNES in 2008, the incidence of osteoporosis in postmenopausal women and males older than 50 years has been reported to be high as 19.3% [1]. Osteoporosis refers to the reduction of bone strength and causes an increased risk of fracture. The World Health Organization (WHO) defines osteoporosis as a bone mineral density (BMD) that falls 2.5 standard deviations below the mean for young healthy adults of the same gender, also referred to as a T-score of -2.5 [2].
Several studies have reported on the effects of insulin and diabetes on bone metabolism. A meta-analysis of the studies found that BMD was decreased in type 1 diabetes, but that type 2 diabetes either did not significantly affect the BMD or was associated with a slightly increased BMD [3]. The mechanisms for these findings have not yet been elucidated. It is thought that insulin mediates anabolic effects on bone metabolism and that insulin may exert synergistic effects together with other anabolic agents, such as insulin-like growth factor (IGF)-I and parathyroid hormone [4]. Therefore, bone metabolism may be altered in patients with impaired fasting glucose (IFG) or impaired glucose tolerance (IGT). However, studies of bone metabolism in prediabetic patients have not yet been conducted. Therefore, the current study examined the changes in BMD in patients with IFG or IGT.
METHODS
Participants
Among the 1,993 individuals who participated in the Korean Rural Genome Cohort Study from January 2005 to December 2006, 802 males were selected as the study subjects. Among these, we excluded 124 subjects who were diagnosed as diabetic. The Korean Rural Genome Cohort Study was conducted on individuals between the ages of 40 to 70 years and who resided in Wonju-si, Pyeongchang-gun, and Gangneung-si in Gangwon-do, Geumsan-gun in Chungcheong-do, and Naju-si in Jeolla-do. The subjects of this study were recruited randomly from Geumsan-gun.
Based on the definition of the American Diabetes Association in 2004, subjects with either an IFG or an IGT were classified as prediabetic. Cases with fasting blood glucose between 100 mg/dL and 126 mg/dL were diagnosed as IFG. Cases with blood glucose was between 140 mg/dL and 200 mg/dL at 2 hours after a 75 g oral glucose loading were diagnosed as IGT [5].
Methods
Physical measurements
Height and weight were measured by a single individual. The waist and hip circumference were measured with the subject standing straight. For obtaining the waist circumference, according to the method recommended by the WHO, the patients stood with legs 25-30 cm apart and, while distributing weight evenly, the middle area between the lowest rib and the pelvic iliac crest was measured during the end-expiration phase. The body mass index (BMI) was calculated by the formula: weight (kg)/height (m2).
Body fat measurement
The fat mass (kg), percent body fat (%), visceral fat (kg), and percent visceral fat (%) were measured by a body composition analyzer (InBody 4.0; Biospace Co., Seoul, Korea).
Evaluation of glucose metabolism
For all subjects, the glycosylated hemoglobin was measured and the blood glucose, as well as insulin, were measured after fasting (minimum 12 hours) and 120 minutes after the oral administration of 75 g of glucose. Insulin was measured by a radioimmune assay (Biosource, Fleurus, Belgium). The intra-assay coefficient of variation was 2.41% and the inter-assay coefficient of variation was 2.93%.
Blood chemistries
In all subject groups, after fasting for more than 12 hours, the blood urea nitrogen, serum creatine, serum cholesterol, triglyceride, low density lipoprotein cholesterol (LDL-C), high density lipoprotein cholesterol, aspartate aminotransferase, and alanine transaminase were measured.
BMD
In all subjects, the BMD was measured in the calcaneus using an ultrasonographic bone densitometer (ACHILLES Express; GE, Madison, WI, USA). Additionally, the T-score was divided into three groups according to the classification of the WHO as normal when greater than -1.0, osteopenia when it was between -2.5 and -1.0, and osteoporosis when it was less than -2.5.
Statistical analysis
All statistical procedures were carried out with SPSS for windows version 17.0 (SPSS Inc., Chicago, IL, USA). All values are presented as the mean ± standard deviation. Student's t-test and the chi-square test were performed to compare the clinical characteristic of the two groups classified as the normal and prediabetic group. One-way ANOVA was applied for comparative analysis of the BMD. The Pearson's correlation method was applied for analysis of the correlation of BMD with the various clinical characteristics. To determine the factors having the greatest effects on BMD, multiple regression analysis was performed and confirmed by correlation analysis; P values less than 0.05 were considered statistically significant.
RESULTS
Comparison of clinical characteristics and BMD
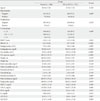
Among the 678 study patients, 406 were classified as normal and 272 were classified as prediabetic. Compared with the normal group, the prediabetic group had significantly higher values for fasting blood glucose concentration and blood glucose concentration 2 hours after a 75 g oral glucose load, serum insulin concentration 2 hours after a 75 g oral glucose load, and glycosylated hemoglobin (100.78 ± 11.03 mg/dL vs. 89.49 ± 6.47 mg/dL, 147.22 ± 31.17 mg/dL vs. 102.12 ± 23.74 mg/dL, 32.71 ± 27.28 mU/L vs. 23.91 ± 22.28 mU/L, and 5.57 ± 0.45 mg/dL vs. 5.41 ± 0.36 mg/dL, respectively, P < 0.001). However, the fasting serum insulin concentration was not significantly different between these groups (7.63 ± 3.60 mU/L vs. 7.31 ± 4.05 mU/L, respectively, P = 0.295). There was no significant difference in age, BMI, percent body fat, and waist circumference between the two groups. The mean BMD T-score of the normal group was -1.34 ± 1.42 while the BMD T-score of the prediabetic group was -1.33 ± 1.30; this difference was not significant (P = 0.924). On chi-square testing following classification of the BMD T-score according to WHO standards, no significant difference was found between the two groups (P = 0.688, Table 1).
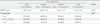
Among the 272 prediabetic patients, excluding 9 patients who did not undergo the 75 g oral glucose tolerance test, a total of 263 patients were divided to the three groups: cases with IFG only, cases with IGT only, and cases with both IFG and IGT. The BMD T-score of each of these groups was compared with the normal group; no significant difference was observed (Table 2).
Relationship of blood glucose and insulin with BMD
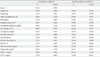
No significant difference in the BMD between the normal group, the prediabetic group, and the diabetic group was observed (Table 3). All subjects were divided into quartiles based on the fasting insulin and insulin levels 2 hours after a 75 g oral glucose load, and the BMD of each group was compared. As the concentration of fasting insulin increased, the mean BMD T-score also increased (P = 0.004). Additionally, on chi-square testing following classification of the BMD according to WHO standards, the subjects with high concentrations of fasting insulin belonged to the groups with higher BMD T-scores (P < 0.001, Table 4). When comparing these groups based on the insulin levels 2 hours after oral administration of 75 g glucose, no significant difference in the mean BMD T-score was found. Nonetheless, on chi-square testing performed after classifying the BMD T-score according to WHO standards, patients with higher insulin concentrations belonged to the group with higher T-scores (P = 0.017, Table 5).
Correlation of BMD with clinical characteristics in the prediabetic group
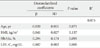
In the prediabetic group, the BMD demonstrated a statistically significant inverse correlation with age (r = -0.124, P = 0.041) and positive correlations with weight (r = 0.134, P = 0.027), BMI (r = 0.154, P = 0.011), percent body fat (r = 0.191, P = 0.002), percent visceral fat (r = 0.151, P = 0.013), total cholesterol (r = 0.185, P = 0.002), and the LDL-C (r = 0.196, P = 0.001). However, the correlation coefficients for these associations were between 0.1 and 0.3, and thus, the correlations were not very strong. No relationship was observed between the BMD and fasting insulin levels, fasting blood glucose, and the insulin and blood glucose levels 2 hours after oral administration of 75 g of glucose. The BMD also demonstrated a positive correlation with glycosylated hemoglobin; again, the correlation was not strong (r = 0.133, P = 0.028). Adjustment for age did not alter the results (Table 6). As age, BMI, glycosylated hemoglobin, and LDL-C all demonstrated a correlation with BMD in the prediabetic group, a multiple regression analysis with these variables was performed. Only the LDL-C was found to be a significant variable (β = 0.007, P = 0.005) (Table 7). However, on a step-wise multiple regression model, age (β = -0.026, P < 0.001), BMI (β = 0.079, P < 0.001), and LDL-C (β = 0.004, P = 0.016) were found to be significant variables (Table 8).
DISCUSSION
It is well known that insulin plays a critical role in glucose metabolism. Upon recognition that it also exerts anabolic effects on bone metabolism, diabetes has become a subject of interest in bone metabolism studies. The direct effect of insulin on bone metabolism has not yet been determined, but a high level of expression of insulin receptors on osteoblasts has been reported [6]. It was observed that the binding of insulin to insulin receptors accelerated cell proliferation, collagen synthesis, production of alkaline phosphatase, and glucose intake [7-10]. In addition to the direct effects of insulin on osteoblasts, insulin has been found to render osteoblasts more sensitive to IGF by the suppression of IGFBP-1; this induces a synergistic effect with the actions of parathyroid hormone and induces indirect synergistic effects with other substances that mediate anabolic effects on bone metabolism [11,12].
The anabolic effects of insulin on bone metabolism can be confirmed in animals with experimentally induced diabetes. Maor et al. [13] observed that IGF-1, IGF-1 receptor, and insulin receptor were reduced in the skeletal growth centers of diabetic rats. Insulin receptor transduces intracellular signals through insulin receptor substrate (IRS), and IRS-1 and IRS-2 have been revealed to play an important role in bone turnover and bone formation, respectively [14]. With the observations that the insulin receptor was also detected in osteoclasts and that insulin suppresses osteoclast activity, the effects of insulin on reducing bone resorption could be predicted and studied [15]. Additionally, non-osmotic hypercalciuria was observed in diabetic rats, and has been reported to induce the effects of calcium deficiency [16]. It has also been reported that when hyperglycemia is persistent, advanced glycation end-products accumulate and result in the reduction of bone formation by osteoblasts and an increase in bone resorption by osteoclasts [17].
Several studies focusing on changes in BMD and risks for bone fracture have been conducted in diabetic patients. Prior studies have found that BMD was decreased in type 1 diabetes though it was unchanged or increased in type 2 diabetes. In type 2 diabetes, adjustment for BMI did not alter these results. Insulin secretion is decreased in type 1 diabetes, but increased in type 2 diabetes. Therefore, the anabolic effects of insulin could be confirmed. However, in both type 1 and type 2 diabetes, the relative risk for hip fracture was increased by 6.3-6.9 times and 1.4-1.7 times, respectively. In type 2 diabetes, the BMD was increased as did the risk for fracture. A possible explanation for this may be an increased number of falls due to deterioration of visual acuity or proprioception caused by diabetes [18].
We conducted comparative studies on the changes in BMD in the normal and prediabetic groups using an ultrasonographic bone densitometer. We noted no significant difference in BMD between these groups. The BMD demonstrated significant correlations with age, BMI, percent of body fat, percent visceral fat, and cholesterol. The subjects were divided into quartiles according to the concentration of insulin in the normal, prediabetic, and diabetic groups. The BMD T-scores were divided to three groups according to the WHO standards. Chi-square analysis was performed between the insulin groups and the BMD T-score groups. Interestingly, as the concentration of insulin increased, more patients were assigned to the groups with higher BMD T-scores. Therefore, it was confirmed that insulin exerts anabolic effects on bone metabolism. However, there was no significant difference in BMD between the prediabetic and normal group. There have been conflicting reports in the previous studies of type 2 diabetic; in some studies, the BMD was reduced while in others it was increased or unchanged [19]. This is thought to be secondary to numerous factors, other than insulin, affecting BMD [3]. Additionally, in a study that examined the differences in BMD between males and females with type 2 diabetes patients, the BMD was found to be increased in females, while the BMD of males was not significantly changed; this result is consistent with the current study which included only males [20].
In the Rotterdam study, the BMD and risk of fracture were examined in 792 male and female diabetic patients older than 55 years. They compared subjects with type 2 diabetes with the subjects without diabetes. Subset analyses were performed, dividing the subjects on the basis of the glucose tolerance test, into already treated diabetes, newly diagnosed diabetes, IGT, and normal glucose tolerance groups. Even after adjustment for age and gender, the femur neck BMD of the diabetic and IGT groups was significantly increased [21], yet in the IGT group, the change in the lumbar spine BMD was not statistically significant. Similarly, the change in femur BMD was not significant after adjustment for BMI, impairment of the lower extremities, smoking, and the use of diuretics, in addition to adjustments for age and gender. That study included both males and females and researchers used a dual energy X-ray absorptiometry (DXA) for assessing the BMD. Strotmeyer et al. [22] examined BMD and fracture risk in 2,797 males and females between 70 and 79 years of age using DXA. These investigators found that in both males and females, the BMD of the hip joint was statistically increased in the IFG group.
Korean studies on the correlation of diabetes with osteoporosis are rare. Kim et al. [23] examined the correlation of non-insulin dependent diabetes with osteoporosis in 63 postmenopausal women using DXA. These authors found that the lumbar spine and femur BMD of the diabetic group was significantly higher than that of the normal group. Even after adjustment for BMI and postmenopausal status, the BMD differences remained significant. Park et al. [24] measured the BMD of 30 male and 30 female diabetic patients suspected as having diabetic foot disease as well 30 male and 30 female normal individuals using DXA. They found that the forefoot BMD of the diabetic group was significantly lower than that of the control group. Yet, in this study, the foot BMD of the patients suspected as having diabetic foot disease was evaluated, and so the study may have limitations in assessing the association of diabetes with osteoporosis.
Although it is well known that age and weight are factors that mediate effects on BMD, there are no studies that have analyzed the factors mediating effects on BMD in prediabetics. In the current study, correlation analysis performed in the prediabetic group found that age, BMI, glycosylated hemoglobin, and LDL-C are factors that mediate effects on BMD. In a multiple regression analysis, only the LDL-C levels were found to be a significantly correlated factor. In a step-wise multiple regression model, age and weight were found to be significantly associated factors with BMD. It is anticipated that if an increased number of subjects are included in future studies, age may also be found to be a significant factor.
Depending on the particular study, cholesterol has been reported as having a positive, inverse, or no correlation with BMD [25-27]. It has recently been reported that 3-hydroxy-3-methylglutaryl (HMG)-CoA reductase inhibitors increase BMD and aid in fracture healing; this has been demonstrated to be independent of lipid reductions and rather due to enhancing the expression of osteoblasts through bone morphogenetic protein-2. Additionally, HMG-CoA reductase inhibitor suppresses osteoclast activity and may act as an anti-bone resorption agent [28]. As cholesterol increases, it may be a marker for relatively good nutrition and so may be a factor that increases the BMI. Hence, the effects of cholesterol on BMD need to be considered. The positive correlation of cholesterol with BMD observed in our study warrants further investigation.
The current study has several limitations. This is a cross-sectional study. Ultrasonography was used to determine BMD instead of DXA. Additionally, bone turnover markers and androgen concentrations were not measured. Finally, the major risk factors for male osteoporosis (drinking, smoking, and physical activity) were not analyzed.
Our study is important as it is the first Korean study that has examined the changes in BMD in prediabetic patients. Further studies are required to elucidate the associations between the risk level of actual fracture and changes in BMD during the progression from a prediabetic state to frank diabetes.


 XML Download