

 PDF
PDF ePub
ePub Citation
 Print
Print


INTRODUCTION
Many studies have been performed about the two adipocytokines, leptin and adiponectin, among various adipocyte-derived cytokines thought to be involved in the regulation of metabolic homeostasis [1-3]. Plasma adiponectin concentration has been reported to decrease as the body mass index (BMI) increases and to correlate negatively with insulin resistance [4,5]. Leptin, identified from the genetic animal model of obesity, ob/ob mouse, shows positive correlations with adiposity and insulin resistance, and leptin has been suggested as a sensitive chemical marker for the diagnosis of obesity and obesity-related disease [6,7]. A recent study showed a negative correlation of serum adiponectin level and a positive correlation of serum leptin level with visceral fat area in Korean adults, and these correlations were more significant compared with those of BMI [8]. More recently, the evaluation of the leptin:adiponectin ratio has been suggested as a useful parameter for assessing insulin resistance in patients with and without diabetes [9-12]. Inoue et al. [9,10] reported that the adiponectin/leptin (A/L) ratio was more effective as a parameter of insulin resistance than was adiponectin or leptin alone and was a more sensitive and reliable marker of insulin resistance than was homeostasis model assessment (HOMA)-insulin resistance (IR) in subjects without hyperglycemia, as well as in type 2 diabetes patients. Recently published studies support the previous results on the association of A/L ratio with insulin resistance [11,12]. Furthermore, recent work by Norata et al. [13] reported that leptin:adiponectin ratio is a powerful independent predictor of intima-media thickness and other cardiometabolic parameters in healthy males.
Metabolic syndrome (MS) is a cluster of risk factors for atherosclerotic cardiovascular disease caused by abdominal obesity, such as hyperglycemia, hypertension, dyslipidemia, and insulin resistance [14,15]. Several studies have reported the association of adipokines, especially A/L ratio, with the presence of metabolic syndrome in Chinese and Korean individuals, and they all support the significant role of A/L ratio in the prediction of insulin resistance in subjects with or without metabolic syndrome and diabetes [16,17].
In this study, we investigated the relationships of A/L ratio with cardiovascular risk factors, HOMA-IR, and the presence of metabolic syndrome in apparently healthy Korean male adults. We also analyzed whether A/L ratio would have a more predictable role in the assessment of insulin resistance than did HOMA-IR.
METHODS
Subjects and measurements
Sixty-eight males were enrolled among the participants in the annual health check-up program in MizMedi Hospital, Seoul, Korea from January to December 2002. Among the total 561 male participants during the period, those with diabetes mellitus, hyperthyroidism, pituitary disease, hypogonadism, chronic liver disease, or chronic renal disease were excluded. The study protocol conformed to the ethical guidelines of the 1975 Declaration of Helsinki, as reflected in a priori approval by the institution's human research committee.
Height, weight, waist circumference, and systolic and diastolic blood pressures were measured in duplicate, and the results were averaged. Weight and height were measured in kg and cm, respectively, down to two decimal points. The BMI was calculated by dividing the weight (kg) with the square of the height (m2). Percent body fat (PBF, %) was measured using a bioelectric impedance analyzer (InBody 3.0; Biospace Co. Ltd., Seoul, Korea).
Blood samples were taken after overnight fasting; serum was separated, stored at -80℃, and were analyzed at a later time. Fasting blood glucose (FBG), total cholesterol (TC), triglyceride (TG), high density lipoprotein cholesterol (HDL-C), and low density lipoprotein cholesterol (LDL-C) were measured. The hexokinase method was used to measure blood glucose levels, and an enzymatic colorimetric test was used to measure the TC and TG levels. The selective inhibition method was used to measure the level of HDL-C, and the homogeneous enzymatic colorimetric test was used to measure the level of LDL-C (ADVIA 1650; Bayer Health Care, Tarrytown, NY, USA). Serum leptin level was measured using radioimmunoassay (LINCO Research, St Charles, MO, USA), and adiponectin level was measured using an enzyme-linked immunosorbent assay (B-Bridge International, Tokyo, Japan). The intra-assay coefficient of variation (CV) of leptin was 3.4 to 8.3%, and the inter-assay CV was 3.0 to 6.2%. The intra-assay CV of was 4.6 to 5.8%, and the inter-assay CV was 3.2 to 7.3%.
Statistical analysis
Statistical analysis was performed using SPSS for Windows version 12.0 (SPSS Inc., Chicago, IL, USA). All results were presented as the mean±standard deviation (SD). Spearman's correlation analyses were used to analyze the relationships between variables and HOMA-IR, leptin, adiponectin, and A/L ratio. Multiple regression analyses were conducted to determine the predictor for A/L ratio and HOMA-IR after adjusting for the confounding variables. A Mann-Whitney test was used to analyze differences in the mean adipokine levels and A/L ratio according to the absence or presence of MS. A P-value less than 0.05 was considered statistically significant.
RESULTS
The general characteristics of the participants
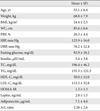
The general characteristics of the study participants are presented in Table 1. The mean age of the participants was 55.1 ± 6.4 years, and the mean BMI of the participants was 24.4 ± 2.5 kg/m2.
Bivariate correlation analyses between HOMA-IR, adiponectin, leptin or A/L ratio, and various parameters
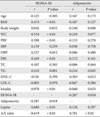
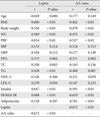
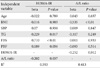
Serum adiponectin level showed significant negative correlations with body weight, TG, and HOMA-IR (r = -0.240, P = 0.048; r = -0.244, P = 0.045; r = -0.287, P = 0.018, respectively) (Table 2). Serum leptin level showed significant positive correlations with BMI (r = 0.606, P < 0.01), body weight (r = 0.536, P < 0.01), waist circumference (r = 0.589, P < 0.01), PBF (r = 0.814, P < 0.01), FBG (r = 0.373, P = 0.002), TC (r = 0.350, P = 0.003), TG (r = 0.428, P < 0.01), insulin (r = 0.647, P < 0.01), and HOMA-IR (r = 0.688, P < 0.01) (Table 3). The A/L ratio was significantly correlated with the same parameters as was leptin, with the exception of TC (Table 3). Regarding HDL-C, significant correlation was shown with serum adiponectin level but not with serum leptin level or A/L ratio. In the case of TC, significant correlations were shown with serum leptin level but not with adiponectin level or A/L ratio.
HOMA-IR level correlated significantly with BMI (r = 0.474, P < 0.01), waist circumference (r = 0.534, P < 0.01), PBF (r = 0.598, P < 0.01), FBG (r = 0.429, P < 0.01), TG (r = 0.410, P = 0.001), and insulin (r = 0.970, P < 0.01).
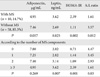
The comparison of mean adipokine level and A/L ratio according to the presence and the number of MS components
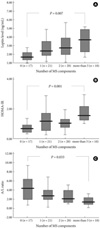
The mean levels of leptin and HOMA-IR in subjects with MS were significantly higher than in those without MS (Table 4). In addition, subjects with MS (n = 10) showed a significantly lower A/L ratio compared with that of subjects without MS (1.61 vs. 3.57, P = 0.012). The mean levels of adiponectin were lower in subjects with MS compared with the subjects without MS, but there were no statistically significant differences (4.95 µg/mL vs. 7.46 µg/mL, P = 0.057) (Table 4).
The participants were divided into four groups according to the number of MS components (Table 4, Fig. 1). With an increasing number of MS components, the mean levels of leptin and HOMA-IR increased (P = 0.007, P = 0.001) (Fig. 1A and B) and the A/L ratio decreased significantly (P = 0.033) (Fig. 1C). However, the level of adiponectin showed a tendency to decrease as the number of MS components increased, although this tendency was not statistically significant (P = 0.269).
Multiple regression analyses with HOMA-IR or A/L ratio as the dependent variable
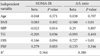
Multiple linear regression models with HOMA-IR or A/L ratio as the dependent in separate models, are presented in Table 5. TG and PBF were significant determinants for HOMA-IR (R2 = 0.564), and BMI and FBS were the significant determinants for A/L ratio (R2 = 0.380) (Table 5). Also, we carried out multiple linear regression analyses with HOMA-IR or A/L ratio as the dependent variable, including each variable in the opposite model (Table 6). When the analysis was performed with HOMA-IR as the dependent variable, TG, FBS, and A/L ratio were the significant determinants, with a correlation coefficient for A/L ratio of -0.202 (R2 = 0.593) (Table 6). When the analysis was performed with A/L ratio as the dependent variable, BMI and HOMA-IR were the significant determinants, with a correlation coefficient for HOMA-IR of -0.252 (R2 = 0.413) (Table 6).
DISCUSSION
The result of the present study showed that A/L ratio showed negatively significant correlations with PBF, lipid profiles, and HOMA-IR. Mean leptin and HOMA-IR levels were significantly higher and A/L ratio was significantly lower in participants with MS. In multiple regression analysis, HOMA-IR and A/L ratio affected each other and were significant predictors for each other, suggesting that A/L ratio might be used as an insulin resistance marker in healthy males. However, as expected, models including HOMA-IR as the dependent variable showed significantly higher correlations with other metabolic parameters compared with model with A/L ratio as the dependent variable, suggesting that HOMA-IR is the stronger marker for insulin resistance than is the A/L ratio.
Inoue et al. [9,10], suggested that the A/L ratio might be more useful than HOMA-IR to accurately assess insulin resistance in participants with type 2 diabetes and also in those without hyperglycemia. A few previous studies have suggested that A/L ratio was significantly associated with clamp-derived insulin sensitivity index [12,20], as well as that A/L ratio is an even stronger predictor for insulin sensitivity than are other insulin sensitivity indices, such as HOMA and QUICKI [12]. However, in our study, HOMA-IR showed better correlation with other parameters related to insulin resistance, such as PBF or lipid profile, compared with A/L ratio, in opposition with other previous studies [11,12]. The reason that our results did not show the clear superiority of A/L ratio over HOMA-IR is not clear, but there are a few possible explanations. First, the numbers of participants enrolled in our study was too small to detect slight differences in inferiority or superiority. In fact, the numbers of the participants enrolled in most published studies were in the range of 100 to 220, compared with the 68 in our study. Second, participants in the previous studies included both females and males, while our study included only males. Furthermore, previous studies were mainly performed with Caucasians, while our study focused on Asians. Adipokine levels are known to be different according to gender and ethnicity [13,21]. Therefore, the discrepancy of our study result with the previous studies suggests caution at applying single study result to various ethnic groups.
In this study, A/L ratio was significantly higher in those with MS compared with that in participants without MS. A few studies performed in Asian participants have reported similar findings [16,17]. In a study performed with 2,046 Chinese adults, leptin/adiponectin (L/A) ratio showed a higher odds ratio in patients with MS and a higher area under the curve in patients with MS compared with those of adiponectin or leptin alone, suggesting the possibility of L/A ratio as the better diagnostic marker for MS compared with individual adipokine levels [16]. In a study performed in 60 Korean adults with type 2 diabetes, participants with MS showed a lower A/L ratio compared to that of those without MS [17]. Our study results are in line with the previous studies in that the presence of MS lead to decreased A/L ratio and include more supportive data on the correlation of A/L ratio with MS in that A/L ratio showed significantly decreased mean values according to increase in the number of MS components.
Our study has several limitations. First, as mentioned above, the number of participants enrolled in this study was small and only included males. If the study was performed in larger number with both male and female participants, the study result would have more impact in support of the role of A/L ratio on the prediction of MS and insulin resistance. However, our result is meaningful in that this was the second study in Korean adults for the evaluation of A/L ratio with MS and insulin resistance, and in that we showed that the A/L ratio varied according to the number of MS components. So these data support the association of this novel ratio as the prediction marker for MS in Korean people.
In conclusion, A/L ratio correlated well with lipid profiles, several anthropometric parameters, and HOMA-IR in Korean male participants, although HOMA-IR showed stronger correlation with metabolic parameters. Furthermore, these data suggest that A/L ratio decreased in subjects with MS and gradually decreased according to the number of MS components, suggesting A/L ratio as the predictive marker for MS in the Korean population. Further research is needed on the confirmation of A/L ratio as the marker for insulin resistance index and MS in various ethnic groups before application to clinical practice.
 XML Download