

 PDF
PDF ePub
ePub Citation
 Print
Print


INTRODUCTION
Skeletal muscle accounts for 35 to 40% of body weight and plays one of the most important roles in glucose metabolism [1]. Resistance training has been reported to decrease insulin resistance by increasing muscle mass [2], improve blood lipid profiles in obese patients with both diabetes and cardiovascular disease [3,4], and to be especially effective at decreasing visceral fat [5]. In their study on the correlation between the ratio of visceral fat to skeletal muscle and insulin resistance, Cha et al. [6] reported that to have an impact on the development of diabetes, skeletal muscle mass should be maintained or increased with a decrease in visceral fat.
Although aerobic exercise reduces visceral fat and decreases insulin resistance [7], it does not affect muscle mass [8]. In particular, as maximum muscle strength tends to decline at a greater rate with reduced muscle mass in older patients [9] and obese females [10], exercise to enhance muscle strength is necessary. Moreover, the American Diabetes Association (ADA) recommends performing three sets of eight to ten repetitions of resistance exercises, three times a week, at an intensity equal to about 75 to 85% of the one repetition maximum (1RM), in addition to aerobic exercise, as exercise therapy for patients with type 2 diabetes [11].
According to previous studies, resistance training decreases glycosylated hemoglobin (HbA1c) and total fat mass [12,13], reduces abdominal fat mass, and improves insulin resistance [5]. In current research, subjects generally partake in an intensive exercise program using free weights (dumbbells) or weight machines. However, a dynamic resistance training program that utilizes a certain weight or resistance, such as free weights, may place excessive stress on skeletal muscle; beginners or the elderly should be careful in adopting such a program and need to consider the higher possibility of injury that may result from inappropriate use. Resistance band training can control strength according to personal physical condition and can provide the proper, individualized load by increasing band resistance gradually as muscle strength increases. In addition, it has been proven to be an effective exercise modality for enhancing muscle and physical strength without placing excessive stress on each joint or muscle [14,15]. An et al. [16] used resistance band training for non-obese females with type 2 diabetes and reported an increase in patient motor ability. However, there have been only a few studies on low-intensity resistance training involving obese Koreans with type 2 diabetes.
Therefore, this study aims to investigate the effects of low-intensity resistance training using resistance bands on muscle and fat masses, cardiovascular capacity, insulin resistance, and muscle strength in obese patients with type 2 diabetes who have no experience with resistance training.
METHODS
Subjects
This study recruited type 2 diabetes patients who were visiting Eulji Hospital between August and December, 2008. The subjects were females, 45 to 65 years old and overweight, with a body mass index (BMI) greater than 23 kg/m2. Due to difficulties following up on the male patients, we only included female subjects in our study. Subjects at low risk for hypoglycemia were being treated with metformin monotherapy, and patients taking antihypertensive medications maintained their dosages during our study. To exclude the potential influence of drug therapy, only patients who had taken over 1,000 mg/day metformin for at least three months prior to the beginning of this study and who showed less than 9% HbA1c were selected for the study. Their dosages also were maintained during our study. Patients with type 1 diabetes, congestive heart failure, malignant tumors, secondary diabetes, and those receiving dialysis were excluded. We also excluded those who had difficulties in following up, who refused to participate, or whose medication dosages were changed during the study. Eighteen patients were randomly assigned to the resistance training or control groups; ultimately, 13 and 15 patients were analyzed in the resistance training and control groups, respectively. Use of antihypertensive medication was similar between the two groups (resistance training group: seven, control group: seven).
Measurements and methods
Physical measurements and biochemical tests
The height, body weight, and waist circumferenc of the subjects were measured at the beginning of the study and again following the 12-week program. Height and body weight measurements were taken in light clothing (no outerwear), and BMI was calculated by dividing body weight (kg) by the square of the height (m2). The narrowest part of the body between the inferior ribs and the iliac crest was taken as the waist circumference, which was measured with a tapeline after a subject had exhaled naturally. Blood pressure was measured in a seated position using a hemomanometer (Yamasu, Tokyo, Japan) after the subject had rested for ten minutes.
For biochemical testing, venous blood was collected following a minimum ten-hour fast, and the serum was isolated through centrifugation at 3,000 rpm for 15 minutes. The serum samples were stored at -70℃ and were later used for analysis. Fasting blood glucose and HbA1c were examined using the glucose oxidation method and high-performance liquid chromatography using cation exchange resin, respectively. Cholesterol, triglyceride, high density lipoprotein cholesterol (HDL-C) and low density lipoprotein cholesterol (LDL-C) levels were analyzed with an automatic chemistry analyzer (Hitachi 7170; Hitachi, Tokyo, Japan) and kits measuring enzymatic response. Free fatty acids were also examined with an automatic chemistry analyzer (Hitachi 7170) based on the colorimetry method (ACS-ACOD) and using a NEEA HR kit (Wako, Osaka, Japan).
Insulin resistance was measured as a rate constant for plasma glucose disappearance (KITT) [17]. To investigate KITT, a 20-gauge (G) catheter was inserted into the vein of one hand following each subject's minimum ten-hour fast. A 20-G catheter was placed in the cephalic vein on the patient's other side to measure intravenous glucose following insulin injection and testing. In a stable condition, previously diluted insulin (Humulin R; Eli Lilly, Indianapolis, IN, USA) was injected into the cephalic vein. Dosage was calculated as 0.1 U per 1 kg body weight, and blood was collected at 0, 3, 6, 9, 12, and 15 minutes following injection. To prevent hypoglycemia, 100 mL of a 20% glucose solution was intravenously injected following the 15-minute blood collection, and glucose concentrations were measured after immediate centrifugation. The measured glucose concentrations over time were input into a computer program, and the data was converted to natural logarithms. The slope of the regression line was calculated using the concentrations at 3 to 15 minutes, and the half life was obtained by dividing basal blood sugar in half (t½). The KITT was calculated as an index of insulin resistance with the following formula:
KITT = 0.693/ t½ × 100 (%/min)
Exercise therapy
The resistance training group was educated on the use of the resistance bands (Thera-band; Hygenic Co., Akron, OH, USA). The resistance of the band was measured with the band fully extended. Strength was measured based on the percent increase in band length from that of the initial length. When the band was expanded by 50, 75, and 100%, the corresponding increases in strength using the red, green and blue bands were 1.2/ 1.5/ 1.8 kg, 1.5/ 1.9/ 2.3 kg, and 2.1/ 2.7/ 3.2 kg, respectively.
Patients increased band resistance gradually to allow for adequate connective tissue adaptation. They used minimal resistance for the first two weeks, then gradually increased the resistance to 40 to 50% of the 1RM by the end of the 12-week program. They visited the hospital three times per week and performed three sets of 10 to15 repetitions of each exercise as a group. The exercise sessions consisted of a ten-minute warm-up, a 40-minute resistance training session, and a ten-minute cool-down.
Based on a method by Dean et al. [18], the exercise program used in this study included bicep curls, triceps extensions, up-right rows, shoulder presses, chest presses, and seated rows to work the upper body. Lower body exercises included leg presses, hip flexion, leg flexion, and leg extensions. The trunk was strengthened using side bends. The control group did not exercise during the 12-week study period.
Investigations of physical activity and dietary intake
Personal activity levels were investigated using a multi-record accelerometer (Lifecorder; Suzuken Co., Nagoya, Japan). After inputting a subject's age, gender, height, and weight, and entering the date and time to begin the measurements, the subject was instructed to carry the accelerometer everywhere, except when sleeping or bathing, for ten days. The collected data was then used to assess personal activity levels. Basal metabolic rate, total energy consumption per body weight, average energy consumption, and average number of steps were analyzed over time using the collected data. Body weight was measured and input every two weeks.
To examine dietary intake, both groups were asked to keep a three-day diet record (two weekdays and one weekend day) and to visit the hospital every four weeks to have their dietary record reviewed. The subjects were educated about the diet record before they began recording data and were asked to personally record both the type and amount of all foods consumed during meals and snacks, including nutritional supplements. To increase the accuracy of the records, nutritionists reviewed the contents of the sheets with the participants using realistic food models (Korea Mirage Replica Inc., Incheon, Korea), measuring cups, measuring spoons, and eye measurement of foods assisted with pictures (The Korean Dietetic Association, 1999). The data from the sheets were analyzed using CAN-Pro (Computer-Aided Nutritional Analysis Program, version 2.0; Korean Nutrition Society, Seoul, Korea) and were converted into nutrient intake.
Dual-energy X-ray absorptiometry
Fat mass and muscle mass were measured using dual-energy X-ray absorptiometry (GE LUNAR Prodigy; GE Lunar, Madison, WI, USA). The body weights of the subjects in thin clothes were measured, and they were scanned from head to toe while lying in a relaxed position on the test bed. The scan took ten to 20 minutes. Body composition was calculated, and fat mass and muscle mass were defined. Fat and muscle masses were then calculated for the total body, arms, legs, and the trunk.
Computed tomography
An abdominal fat computed tomography scan (GE, Milwaukee, WI, USA) was conducted by scanning within 10 mm from an imaginary line drawn from lumbar vertebrae 4 and 5 to the bellybutton. The results were reconstituted as a range of fat density of -150 to -50 Hounsfield units (HU). In other words, the area of total abdominal fat in the abdominal cavity was calculated with a computer, and the area of visceral fat was obtained by measuring the inside area of the peritoneum. The area of subcutaneous fat was determined by subtracting the visceral fat area from the total abdominal fat area [19].
1RM
Upper body strength was measured by evaluating the strengths of the deltoids, triceps, and muscles by having the subjects perform a chest press; lower body strength was measured by assessing the strengths of the gluteals, hamstrings, and quadriceps muscles by having them perform a leg press (Keiser, Fresno, CA, USA). Prior to assessment, the subjects warmed up by performing eight to ten repetitions of an exercise at 50% of the expected 1RM (half of the body weight for the chest press and equal to the body weight for the leg press). After three-minutes of light stretching, the subjects then rested for one minute. The subjects then performed one set of three to five repetitions of the exercise at about 75% of the expected 1RM. After resting for one minute, the subjects then increased the weight by 1.25 to 4.5 kg to eventually reach 1RM. This process was repeated to failure (when the subject could not perform one repetition with a given weight), and the heaviest weight that the subject had succeeded in lifting was determined as the 1RM. The 1RM was commonly found on the third to the fifth trial [20].
Graded exercise test
The aerobic exercise capacity was assessed using oxygen consumption rate at anaerobic threshold (VO2-AT) during the graded exercise test. For the graded exercise test, a bicycle (ER900, D-72475 Bits; JAGER, Wuerzburg, Germany) was used. Work load was increased by 20 watts every 2 minutes until the patient could not continue to exercise anymore. AT was defined as ventilator threshold which was the point at which the relationship between ventilation and oxygen consumption deviate from linearity. The heart beat per minute, oxygen consumption rate, activity rate, and respiration number were automatically recorded and stored as numbers and graphed every 15 seconds during exercise and the recovery period. Blood pressure was measured every 2 minutes using an automated blood pressure manometer [21].
Statistical analysis
For statistical analysis, means and standard deviation of each item were obtained with a statistical program, SPSS for Windows, version 15.0 (SPSS Inc., Chicago, IL, USA). The variations had a normal distribution. Differences in physical characteristics, biochemical test results, muscle mass, fat mass, cardiovascular capacity, insulin resistance, and 1RM during the 12-week study period in the resistance training group and the control group and the differences between the two groups were analyzed with a paired t-test and linear mixed models, respectively. A P value of less than 0.05 was considered statistically significant.
RESULTS
Clinical characteristics of the subjects
Among all patients, 28 patients (resistance training group: 13, control group: 15) were included in this study. Average age, duration of diabetes, and BMI for the subjects were 56.4 ± 7.1 years, 5.9 ± 5.5 years, and 27.4 ± 2.5 kg/m2, respectively. There was no significant differences in age, duration of disease, or BMI between the two groups; HbA1c and cholesterol levels also were similar. Calorie consumption prior to education on exercise and total calorie consumption were not significantly different between the groups (Table 1).
Changes in physical measurements, caloric intake, and exercise
While the body weight of the resistance training group decreased significantly (1.1 ± 1.3 kg; P = 0.009), that of control group did not show any statistically significant change. However, when changes in body weight for the two groups were compared, they were similar (P = 0.415). Waist circumferences in the resistance training group declined significantly; (2.4 ± 2.8 cm; P = 0.009), but that of control group reduced by only 0.5 ± 14.2 cm (P = 0.901). However, there were no significant differences in the change in waist circumference between the two groups (P = 0.485).
HbA1c was unchanged after the 12-week program in both groups.
Caloric intake decreased significantly in both groups (P < 0.001, P = 0.002, respectively), and there were no significant differences between the groups with regard to intake (P = 0.150). In both groups, activity energy consumption and total energy consumption did not change significantly over the course of the exercise program (Table 2).
Changes in muscle mass
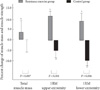
In the resistance training group, upper body, trunk, and total body muscle masses increased significantly; no significant change was found in lower body muscle mass. However, in the control group there was no significant change (Table 3). A 3.0% increase in muscle mass was seen in the resistance training group, but no increase was noted in the control group (Fig. 1).
Changes in total fat mass and abdominal fat mass
In the resistance training group, fat masses of arms, legs, trunk, and the total body decreased significantly. In the control group, fat masses of unknot arms and legs were not changed, while those of the trunk and total body decreased significantly (Table 3).
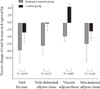
Although total abdominal fat and subcutaneous fat decreased significantly in the resistance training group after the 12-week exercise program (P = 0.008, P = 0.005), no significant change in visceral fat was observed. In the control group, subcutaneous fat was reduced significantly; however, no changes were observed in total abdominal fat or subcutaneous fat. In comparing the two groups, total fat mass and total abdominal fat were significantly lower in the resistance training group (P = 0.039, P = 0.017), respectively but the difference in visceral fat and subcutaneous fat between the two groups was small (P = 0.087, P = 0.119), respectively (Table 3). While total fat mass, total abdominal fat, visceral fat, and subcutaneous fat in the resistance training group were reduced by 7.8, 6.5, 3.9, and 6.0%, respectively, total fat mass, total abdominal fat, and subcutaneous fat in the control group decreased by 2.6, 0.2, and 2.4%, respectively. Notably, visceral fat in the control group increased by 4.4% (Fig. 2).
Changes in 1RM, cardiovascular capacity, and insulin resistance
In the resistance training group, the 1RM for the upper and lower body of arms and legs of resistance training group was increased significantly (by 2.0 ± 4.3 kg and 10.1 ± 15.7 kg, respectively) (P = 0.004, P = 0.040), while 1RM of the control group decreased significantly (P = 0.021, P = 0.043). In comparing the two groups, muscle strengths of arms and legs of resistance training group changed significantly compared to those of the control group (P < 0.001, P = 0.006, respectively) (Table 3). In the resistance training group, the 1RM of arms and legs increased by 13.2 and 17.3%, respectively, whereas the 1RM values fell 6.4 and 10.7%, respectively, in the control group (Fig. 1).
Cardiovascular capacity appeared unchanged following the 12-week exercise program in both the resistance training and control groups (P = 0.400, P = 0.282), and the difference between the two groups was not significant (P = 0.809) (Table 3).
Insulin resistance in both the resistance training and control groups did not change significantly following the 12-week exercise program (Table 2).
DISCUSSION
Resistance training is typically performed using low weight and high repetitions (e.g., lifting 20 to 30% of 1RM for 20 repetitions) or using high weight and low repetitions (e.g., lifting 60 to 80% of 1RM for six to ten repetitions [22]). Although low-intensity and high-intensity exercise increase muscular endurance and 1RM, respectively [23], low-intensity resistance training is more appropriate for diabetes patients due to an inherently higher risk for cardiovascular complications [20].
Even healthy seniors experience a decrease in muscle mass of 40 to 50% in their 80s compared to that in their 20s, which contributes to loss of motor cells and contraction of muscle cells [24]. Therefore, diabetes patients need resistance training more to improve muscle mass as they get older. Jung and Joo [25] conducted a study in which senior females performed resistance training using low-intensity yellow and red resistance bands and found a significant increase in muscle contraction strength and brachial muscular endurance. In their study, Kim [26] prescribed low-intensity yellow and red resistance band exercises for obese females with type 2 diabetes and reported that fat free mass and muscle strength increased, although the increase was not significant. This study had similar results to our study with respect to total muscle mass. Our study observed a 3.0% increase in total muscle mass following a 12-week exercise program using resistance bands to perform resistance exercises at 40 to 50% of the individual 1RM. Specifically, muscle mass of and trunk arms and trunk increased by 5.3 and 4.2%, respectively; and that legs tended to improve. The difference in changes to the muscle masses between arms and legs may be because the subjects were educated to use a band of the same intensity for both arm and leg exercises; stimulus to the legs would therefore be less than that to the arms (in terms of 1RM). In addition, although no dietary advice was given to either group, monitoring the daily food diaries appears to have significantly reduced dietary intakes, as compared to dietary intakes at the beginning of this study. This may have lead to the decrease in muscle mass in the control group.
Obesity can bring on metabolic disorders, and visceral fat in particular promotes secretion of free fatty acids due to its high metabolic activity [27]. Moreover, central obesity is reported to increase the occurrence of hyperinsulinism, impaired glucose tolerance, cardiovascular diseases, and type 2 diabetes [28]. Aerobic exercise is generally prescribed as a measure to reduce obesity and abdominal fat mass; however, many diabetes patients are unable to perform aerobic training because they suffer from severe arthritis or their motor ability is too low. Ibanez et al. [5] conducted training at 50 to 80% of the 1RM (three sets of ten to 15 repetitions, two times per week) with type 2 diabetes males in their 60s and showed that their visceral fat and subcutaneous fat declined by 10.3 and 11.2%, respectively. According to a study by Kwon et al. [29] performing resistance training at 60 to 70% of 1RM (three sets of ten to 12 repetitions, five times per week) with obese females aged 40 to 45 years for 24 weeks, led to a significant decrease in total abdominal fat, visceral fat, and subcutaneous fat. Total abdominal fat, visceral fat, and subcutaneous fat decreased by 18.1, 46.3, and 9.2%, respectively, in these subjects. Lee and Kim [30] instructed type 2 diabetic females in their 60s on resistance training with low intensity yellow and red resistance bands (three sets of ten repetitions, three to four times per week for 65 minutes) and found a significant decline in percent body fat. In our study, using the resistance band at a level corresponding to 40 to 50% of 1RM for 12 weeks resulted in decreases in total abdominal fat, visceral fat, and subcutaneous fat of 6.5, 3.9, and 6.1%, respectively. Although the decrease in visceral fat was not statistically significant, it did tend to decrease, and total abdominal fat and subcutaneous fat were reduced significantly. We infer that resistance training is an appropriate and effective exercise for reducing abdominal fat.
Muscle strength and cardiovascular capacity are critical in maintaining independence in activities of daily living, and an improvement in cardiovascular capacity through regular exercise is reported to decrease risk factors of cardiovascular disease [31]. So et al. [32] conducted a study that involved resistance band training by dividing obese middle-aged females into two groups: a high-load/low-frequency group (blue bands, 14 repetitions) and a low-load/high-frequency group (red bands, 25 repetitions). They found that muscular endurance was significantly enhanced in both groups; however, cardiovascular endurance increased significantly only in the low-load/high-frequency group. They stated that the exercises in the low-load/high frequency group were adapted to aerobic exercise rather than resistance training. In a study by An et al. [16], non-obese patients with type 2 diabetes performed a 12-week resistance training program using resistance bands and 15 to 20 repetitions per exercise. They found that muscle contraction strength and physical performance improved significantly, but cardiovascular capacity at anaerobic threshold was unchanged. Our study observed similar results to the findings of those of An et al. in that 1RM of arms and legs increased significantly (by 13.2 and 10.2%, respectively), whereas there was no significant change in cardiovascular capacity. The American College of Sports Medicine does not recommend resistance training as an means of improving cardiovascular endurance [22].
Results of studies investigating changes in insulin resistance caused by resistance training in diabetes patients are inconsistent. Improvements to insulin resistance were assumed to follow an increase in GLUT4 expressed in the cellular membrane by activating an intracellular signal transduction pathway [33,34] after muscle contraction caused by resistance training rather than through changes in muscle mass and physical composition. When healthy subjects performed resistance training, their insulin resistance clearly improved; however, its effects on diabetes patients were repeated differently [35]. Gordon et al. [36] reviewed 12 studies on resistance training performed with type 2 diabetes patients and found that most of the studies showed an improvement in insulin resistance. However, some studies observed no effect. Studies by Castaneda et al. [13], Brooks et al. [37], and Gordon et al. [38] reported that subjects who performed middle- and high-intensity exercise, or 60 to 80% of 1RM, using a weight machine for 16 weeks, had a decrease in fasting blood insulin levels and improved insulin resistance. In contrast, subjects in a study done by Colberg et al. [39] performed medium-intensity resistance training, or 50 to 70% of 1RM, for eight weeks and showed no change in insulin resistance. Baldi and Snowling [40] also reported that although ten-weeks of resistance training reduced insulin levels, insulin resistance was unchanged. This shows that the effectiveness of resistance training on improving insulin resistance in diabetes patients appears to differ according to the intensity, frequency, and duration of training. Therefore, it is recommended that in the early stages of resistance training, low-intensity exercises be performed daily and then maintained by performing them three days per week [11]. However, there is no consensus on the minimum intensity, frequency, and duration needed to improve insulin resistance. These should be determined in future studies. This study also found that a 12-week, low-intensity resistance training program using resistance bands did not improve insulin resistance significantly. A future study to establish appropriate intensity, frequency, and duration to improve insulin resistance in Koreans with diabetes is needed.
This study showed that low-intensity resistance training using resistance bands significantly increased muscle mass and 1RM strength and significantly decreased total fat mass in obese females with type 2 diabetes. However, this form of exercise did not result in significant changes to insulin resistance, visceral fat, or cardiovascular capacity. Further research into more effective forms of resistance training and combining resistance training and aerobic exercise are needed. A limitation of this study was that the subjects were all female, so the effect of resistance training on males with diabetes could not be observed.

 XML Download