

 PDF
PDF ePub
ePub Citation
 Print
Print


INTRODUCTION
The nucleotide-binding domain, leucine-rich-repeat-containing receptor (NLR), pyrin-domain-containing 3 (NLRP3) inflammasomes are multi-protein complexes that regulate immune response by the activation of caspase-1, and the maturation and secretion of pro-inflammatory cytokines, such as interleukin 1β (IL-1β) and IL-18 [123]. NLRP3 is one of the critical components of the NLRP3 inflammasome. NLRP3 interacts with the adaptor apoptosis-associated speck-like protein containing a caspase recruitment domain (ASC), which recruits pro-caspase-1 [4]. Among the known NLR-containing inflammasomes, NLRP3 inflammasome activation is linked to chronic inflammation in human metabolic diseases, such as type 2 diabetes mellitus (T2DM) [567]. We have previously reported that cellular metabolic pathways and metabolic enzymes are associated with NLRP3 inflammasome activation in macrophages under pro-inflammatory conditions [89].
IL-1β, one of the major pro-inflammatory cytokines produced by NLRP3 inflammasome activation [1], is implicated in chronic inflammation during T2DM [510]. IL-1β promotes β-cell destruction and insulin resistance by inhibiting insulin signaling pathway in insulin-sensitive cells [11121314]. The free fatty acids, which are elevated in the plasma of patients with T2DM [15], are one of the important factors of NLRP3 inflammasome-dependent IL-1β production [6]. Previous study has shown that the elevated fatty acids, such as palmitate, induce NLRP3 inflammasome activation in macrophages [6].
PF-04620110, a potent and selective diacylglycerol acyltransferase-1 (DGAT1) inhibitor, is a potent anti-diabetic agent that was developed by Pfizer Global Research and Development (New York, NY, USA) [16]. Previous studies have shown that PF-04620110 suppresses triglyceride (TG) synthesis and TG levels in plasma through the inhibition of DGAT1 activity [1617]. Also, PF-04620110 leads to the reduction of blood glucose levels in patients with T2DM [18]. Currently, the role of PF-04620110 in regulating fatty acid-induced chronic inflammation during T2DM remains incompletely understood.
In this paper, we demonstrate that PF-04620110 suppressed fatty acid-induced NLRP3 inflammasome activation in macrophages. PF-04620110 inhibited NLRP3 inflammasome complex formation, which is required for NLRP3 inflammasome activation. Moreover, PF-04620110 reduced high-fat diet (HFD)-induced IL-1β and IL-18 production in the plasma of mice. Furthermore, the genetic inhibition of DGAT1 by Dgat1 guide RNA (gRNA) suppressed NLRP3 inflammasome activation. Taken together, our results suggest that PF-04620110 could be a pharmacological target of chronic inflammation by fatty acid-induced NLRP3 inflammasome activation.
METHODS
Mice
C57BL/6 mice (male and female, 6 weeks or 2 months old) were from Orient Bio laboratory. All mouse experimental protocols were approved by the Institutional Animal Care and Use Committee of Soonchunhyang University (protocol #: SCH17-0025, SCH18-0032; Soonchunhyang University, Cheonan, Korea).
Reagents and antibodies
Lipopolysaccharide (LPS) (Escherichia coli; tlrl-pelps) and flagellin (Salmonella typhimurium; tlrl-stfla) were from Invivogen (San Diego, CA, USA). Adenosine triphosphate (ATP) (A2383), while nigericin (N7143), poly(dA:dT) (P0883), and PF-04620110 (PZ0207) were from Sigma-Aldrich (St. Louis, MO, USA). The following antibodies were used: polyclonal rabbit anti-caspase-1 for mouse caspase-1 (1:1,000) (SC-514; Santa Cruz Biotechnology, Dallas, TX, USA), polyclonal goat anti-IL-1β for mouse IL-1β (1:1,000) (AF-401-NA; R&D Systems, Minneapolis, MN, USA), polyclonal rabbit anti-ASC for mouse ASC (1:1,000) (ADI-905-173-100; Enzo Lifesciences, Farmingdale, NY, USA), polyclonal rabbit anti-DGAT1 for mouse DGAT1 (1:1,000) (ab54037; Abcam, Cambridge, MA, USA), and monoclonal mouse anti-β-actin (1:5,000) (A5316; Sigma-Aldrich).
Cell culture
Bone marrow-derived macrophages (BMDMs) were prepared as previously described [12]. Bone marrow collected from wild-type (WT) mouse (male and female, 8 to 10 weeks old) femurs and tibias was plated on sterile Petri dishes, and incubated for 7 days in Dulbecco's modified Eagle's medium (DMEM) (Invitrogen, Waltham, MA, USA) containing 10% (v/v) heat-inactivated fetal bovine serum, 100 units/mL penicillin, 100 mg/mL streptomycin and 25% (v/v) conditioned medium from mouse L929 fibroblasts (CCL-1, ATCC). For NLRP3 inflammasome activation, WT BMDMs (5×10⁶ cells in 100 mm cell culture dish) were incubated with LPS (500 ng/mL, 4 hours), and were then treated with NLRP3 inflammasome activator as described palmitate-bovine serum albumin (PA-BSA; 500 µM, 3 hours), ATP (2 mM, 0.5 hour), or nigericin (6.7 µM, 1 hour). For absent in melanoma 2 (AIM2) inflammasome activation, LPS-primed WT BMDMs were transfected with poly(dA:dT) (1 mg/mL, 3 hours) (Sigma-Aldrich) using Lipofectamine with Plus reagent (15338-100; Invitrogen), according to the manufacturer's instructions. For the NLR family, CARD-domain-containing 4 (NLRC4) inflammasome activation, LPS-primed WT BMDMs were transfected with flagellin (5 µg/mL, 6 hours) (Invivogen) using Lipofectamine with Plus reagent (15338-100; Invitrogen), according to the manufacturer's instructions. The cell supernatants and cell lysates were collected and analyzed for the levels of IL-1β, IL-18, and tumor necrosis factor α (TNF-α) by enzyme-linked immunosorbent assay.
Transduction of DGAT1 gRNA/Cas9 plasmid
For stable knockdown of mouse DGAT1, two independent DGAT1-targeting gRNAs (sgRNA: ATTTCAGATTGAGAAGCGCC and sgRNA2: CCTGCCCCATGCGTGATTAT; GeneScript, Piscataway, NJ, USA) were used. We used CRISPR ribonucleoprotein (RNP) system (GeneScript). To prepare RNA oligo, 10 µL of sgRNA Oligo (100 µM) was incubated at 95℃ for 5 minutes with anneal components (Nuclease-Free Water [22 µL] and Annealing Buffer 5X [8 µL]). Then, it was put into 60℃ water, and left to cool to room temperature (RT). To prepare and transduce RNP complex, WT BMDMs (2×10⁵ cells in 6-well cell culture plates) were seeded and transfected with RNP complex (Cas9 Nuclease [Z03386; GeneScript] 15 pmol and sgRNA oligos annealed 30 pmol) using Lipofectamine™ CRISPRMAX™ Cas9 Transfection Reagent (CMAX00003; Invitrogen), according to the manufacturer's instructions. BMDMs were incubated for 48 hours, and stimulated LPS and PA-BSA as described.
Preparation of bovine serum albumin-conjugated palmitate
Sodium palmitate (P9767; Sigma-Aldrich) was conjugated with fatty acid-free BSA (03117405001; Sigma-Aldrich) at a 6:1 molar ratio, according to the manufacturer's instructions (Agilent Technologies, Santa Clara, CA, USA). BMDMs were treated with PA-BSA (500 µM, 2 hours) or BSA as control, after LPS incubation.
Immunoblot analysis
WT BMDMs were harvested and lysed in NP40 Cell Lysis Buffer (FNN0021; Invitrogen) or Tissue Extraction Reagent I (FNN0071; Invitrogen). Lysates were centrifuged at 15,300 ×g for 10 minutes at 4℃, and the supernatants were obtained. The protein concentrations of the supernatants were determined by Bradford assay (500-0006; Bio-Rad Laboratories, Hercules, CA, USA). Proteins were electrophoresed on NuPAGE (4% to 12%) Bis-Tris gels (Invitrogen), and transferred to Protran nitrocellulose membranes (10600001; GE Healthcare Life Science, Pittsburgh, PA, USA). Membranes were blocked in 5% (w/v) BSA (9048-46-8; Santa Cruz Biotechnology) in TBS-T (TBS [170-6435; Bio-Rad Laboratories]) and 1% (v/v) Tween-20 (170-6531; Bio-Rad Laboratories) for 30 minutes at RT (25℃). Membranes were incubated with primary antibody diluted in 1% (w/v) BSA in TBS-T at 4℃, and then with the horseradish peroxidase (HRP)-conjugated secondary antibody (goat anti-rabbit IgG-HRP [SC-2357; 1:2,500], goat anti-mouse IgG-HRP [SC-516102; 1:2,500], and mouse anti-goat IgG-HRP [SC-2354; 1:2,500] from Santa Cruz Biotechnology) diluted in TBS-T for 30 minutes at RT. The immunoreactive bands were detected by SuperSignal West Pico Chemiluminescent Substrate (34078; Thermo Fisher Scientific, Waltham, MA, USA).
Quantification of triglyceride levels
TG levels from WT BMDMs were measured by Triglyceride Quantification Colorimetric/Fluorometric Kit (K622; BioVision Inc., Milpitas, CA, USA), according to the manufacturer's instructions.
Intracellular Ca2+ flux assays
WT BMDMs (2×10⁴ cells/well in 96-well cell culture dish) were incubated with LPS (500 ng/mL, 4 hous), and were then treated with PA-BSA (500 µM, 2 hours). Intracellular Ca2+ levels were measured by Fluo-8 Calcium Flux Assay Kit-No Wash (Abcam, ab112129). Cells were incubated with Fluo-8 for 0.5 hour at 37℃ and 0.5 hour at RT in calcium-free Hanks' balanced salt solution, according to the manufacturer's instructions. Fluorescence intensity was measured at Ex/Em=(490/525) nm.
Cytokine analysis
Supernatants from BMDMs were measured for mouse IL-1β (MLB00C; R&D Systems), mouse IL-18 (7625; R&D systems), and mouse TNF-α (MTA00B; R&D Systems), according to the manufacturer's instructions.
ASC oligomerization and ASC speck formation
WT BMDMs (5×10⁶ cells in 100 mm cell culture dish) were harvested and lysed in 500 µL of lysis buffer (20 mM 4-(2-hy-droxyethyl)-1-piperazineethanesulfonic acid-potassium hydroxide [HEPES-KOH], pH 7.5, 150 mM KCl, 1% NP-40). Lysates were centrifuged at 330 g for 10 minutes at 4℃. The pellets were washed in 1 mL of PBS, and resuspended in 500 µL of PBS. The 2 mM disuccinimydyl suberate (21555; ThermoFisher Scientific) was added to the resuspended pellets, which were incubated for 30 minutes with rotation at RT. Samples were then centrifuged at 330 g for 10 minutes at 4℃. The supernatant was removed, and the cross-linked pellets were resuspended in 50 µL of Laemmli sample buffer. Samples were analyzed by immunoblot analysis using polyclonal ASC antibody (ADI-905-173-100; Enzo Lifesciences). WT BMDMs were seeded on chamber slides. After stimulation, cells were fixed with 4% paraformaldehyde, and then incubated with polyclonal ASC antibody (ADI-905-173-100; Enzo Lifesciences) for 16 hours, followed by DAPI (P36962; ThermoFisher Scientific) staining, as previously described [91920]. ASC specks were analyzed by Zeiss LSM880 laser-scanning confocal microscope, and quantified using ImageJ software 1.52a (Bethesda, MD, USA). The graph represents the quantification of percent of ASC speck positive cells for each mouse.
PF-04620110 treatment in mice fed with high-fat diet
C57BL/6J mice (male, 6 weeks old) with similar plasma glucose levels and body weights were used. For generation of HFD-induced diabetic mice, C57BL/6J mice were fed HFD with 0.15% cholesterol (HFD, 21% crude fat, 0.15% cholesterol, and 19.5% casein; Altromin, Germany) or regular diet (RD), for 12 weeks. For treatment of PF-04620110, PF-04620110 or vehicle control (dimethyl sulfoxide [DMSO]) were fed once a day at the dose of 3 mg/kg for another 4 weeks.
Blood glucose assay
Glucose levels in blood collected from the tail vein were determined using a One Touch® Ultra® Blood Glucose Test System Kit (Lifespan Co., Providence, RI, USA).
Statistical analysis
All data are mean±standard deviation, combined from three independent experiments. All statistical tests were analyzed by Student's two-tailed t-test for comparison of two groups, and analysis of variance (ANOVA) (with post hoc comparisons using Dunnett's test), using a statistical software package (GraphPad Prism version 4.0; GraphPad Software Inc., San Diego, CA, USA) for comparison of multiple groups. P values of less than 0.05 were considered statistically significant.
RESULTS
PF-04620110 suppressed fatty acid-induced NLRP3 inflammasome activation
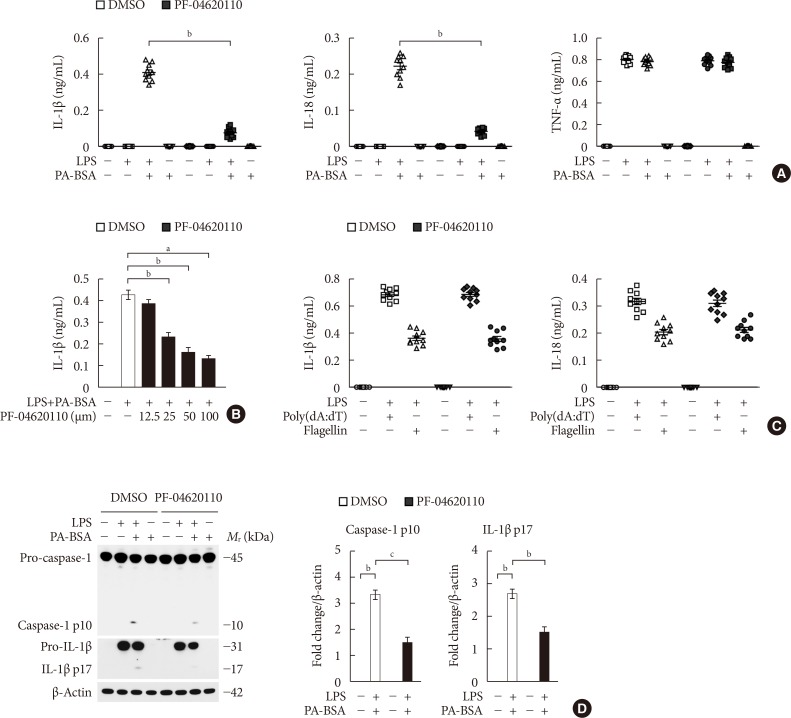
To investigate the function of PF-04620110 on fatty acid-induced NLRP3 inflammasome activation, we examined whether PF-04620110 could suppress the secretion of IL-1β and IL-18 in LPS-primed BMDMs in response to palmitate conjugated with fatty acid-free BSA (PA-BSA), a specific NLRP3 inflammasome activator. PF-04620110 treatment significantly reduced IL-1β and IL-18 secretion in response to PA-BSA compared to vehicle control (Fig. 1A), whereas the secretion of TNF-α, which is an indicator of toll-like receptor 4 (TLR4) signaling [2122], was unchanged (Fig. 1A). Moreover, PF-04620110 treatment suppressed IL-1β secretion in a dose-dependent manner, in response to PA-BSA relative to vehicle control (Fig. 1B). Similarly, PF-04620110 treatment significantly decreased IL-1β and IL-18 secretion in response to nigericin or ATP, which are other specific activators of NLRP3 inflammasome, compared to vehicle control, whereas the secretion of TNF-α was unchanged (Supplementary Fig. 1). Moreover, the levels of DGAT1 expression were elevated by PA-BSA, nigericin, or ATP stimulation in LPS-primed BMDMs, whereas LPS-only treatment did not affect DGAT1 expression. In contrast, poly(dA:dT), an AIM2 inflammasome activator, or flagellin, a NLRC4 inflammasome activator did not change the expression of DGAT1 in LPS-primed BMDMs (Supplementary Fig. 2). Consistently, PF-04620110 treatment did not change the secretion of IL-1β and IL-18 in response to poly(dA:dT), an AIM2 inflammasome activator, or flagellin, a NLRC4 inflammasome activator compared to vehicle control (Fig. 1C). Consistent with IL-1β and IL-18 secretion, PF-04620110 treatment suppressed the expression of cleaved caspase-1 and cleaved IL-1β in response to LPS and PA-BSA stimulation compared to vehicle control, whereas the expression of pro-caspase-1 and pro-IL-1β expression was unchanged (Fig. 1D). These results suggest that PF-04620110 suppressed fatty acid-induced NLRP3 inflammasome activation.
PF-04620110 inhibits K+ efflux and the formation of ASC specks for NLRP3 inflammasome activation
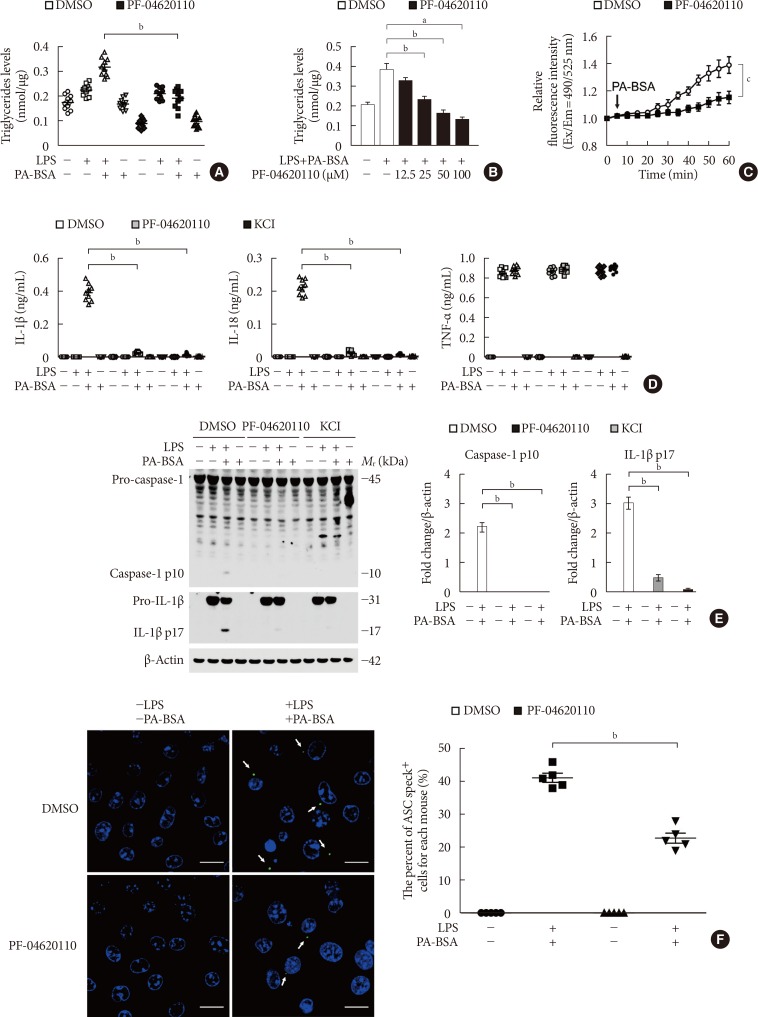
We next investigated the underlying molecular mechanism by which PF-04620110 regulates NLRP3 inflammasome activation. We examined whether the inhibition of TG synthesis by PF-04620110 could suppress K+ efflux, which is an important mechanism for fatty acid-induced NLRP3 inflammasome activation [623]. First, we analyzed the effect of PF-04620110 on the TG synthesis during NLRP3 inflammasome activation. We measured the TG levels in LPS-primed WT BMDMs pre-treated with PF-04620110 before PA-BSA stimulation. PF-04620110 treatment significantly reduced the levels of TG in response to LPS and PA-BSA, compared to vehicle control (Fig. 2A). Moreover, PF-04620110 treatment reduced TG synthesis in a dose-dependent manner in response to PA-BSA, relative to vehicle control (Fig. 2B). Notably, PF-04620110 treatment significantly suppressed Ca2+ influx by K+ efflux in response to LPS and PA-BSA stimulation, compared to vehicle control (Fig. 2C). Moreover, PF-04620110 showed the similar inhibition effects to the presence of high extracellular K+ concentrations on the expression of cleaved caspase-1 and cleaved IL-1β (Fig. 2D) and the production of IL-1β (Fig. 2E) during NLRP3 inflammasome activation. Furthermore, we examined whether PF-04620110 could suppress the formation of ASC specks, which is required for NLRP3-dependent caspase-1 activation [9]. The formation of ASC specks by NLRP3 inflammasome complex in each cell was analyzed by fluorescent protein tagged ASC. PF-04620110 treatment inhibited the formation of ASC specks in response to LPS and PA-BSA, compared to vehicle control (Fig. 2F). These results suggest that PF-04620110 treatment suppressed K+ efflux and the formation of ASC specks during NLRP3 inflammasome activation.
Genetic inhibition of DGAT1 suppresses fatty acid-induced NLRP3 inflammasome activation
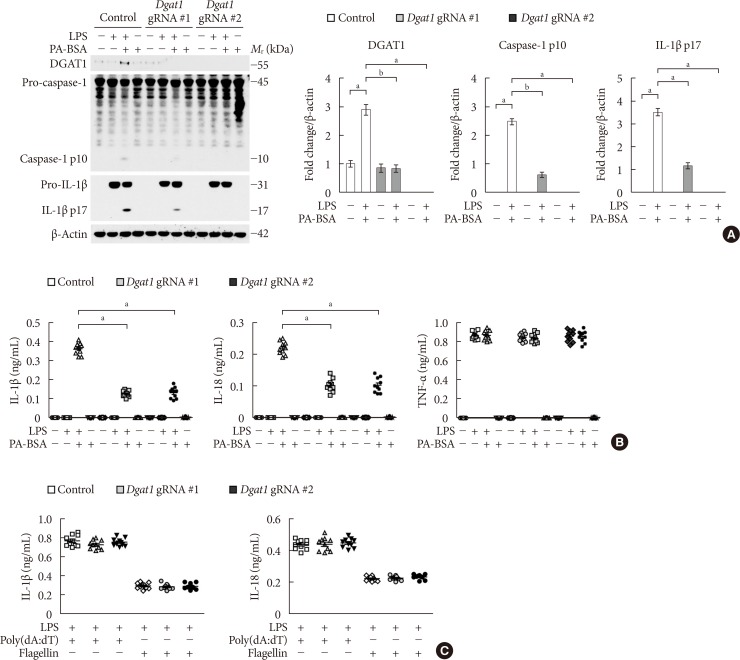
Since DGAT1 is the selective target of PF-04620110 [1617], we investigated whether the genetic inhibition of DGAT1 could suppress NLRP3 inflammasome activation. We used two independent DGAT1-targeted gRNAs to delete mouse DGAT1 in WT BMDMs via CRISPR RNP system. The genetic inhibition of DGAT1 by Dgat1 gRNAs (Dgat1 gRNA#1 and Dgat1 gRNA#2) significantly suppressed DGAT1 protein expression, relative to control (Control) (Supplementary Fig. 3). Notably, genetic inhibition of DGAT1 by Dgat1 gRNAs (Dgat1 gRNA#1 and Dgat1 gRNA#2) suppressed the expression of DGAT1, cleaved caspase-1 p10, and cleaved IL-1β p17 in response to LPS and PA-BSA stimulation, compared to control (Control), although pro-IL-1β expression was unchanged (Fig. 3A). Consistently, the genetic inhibition of DGAT1 by Dgat1 gRNAs (Dgat1 gRNA#1 and Dgat1 gRNA#2) significantly reduced IL-1β and IL-18 secretion in response to PA-BSA, compared to control (Control) (Fig. 3B), whereas, the secretion of TNF-α was unchanged (Fig. 3B). Moreover, the genetic inhibition of DGAT1 by Dgat1 gRNAs (Dgat1 gRNA#1 and Dgat1 gRNA#2) suppressed the expression of DGAT1, cleaved caspase-1 p10, and cleaved IL-1β p17 in response to LPS and nigericin stimulation, compared to control (Control), although pro-IL-1β expression was unchanged (Supplementary Fig. 4A). Furthermore, the genetic inhibition of DGAT1 by Dgat1 gRNAs (Dgat1 gRNA#1 and Dgat1 gRNA#2) significantly decreased IL-1β and IL-18 secretion in response to nigericin or ATP, compared to control, whereas the secretion of TNF-α was unchanged (Supplementary Fig. 4B). In contrast, genetic inhibition of DGAT1 by Dgat1 gRNAs (Dgat1 gRNA#1 and Dgat1 gRNA#2) did not affect the secretion of IL-1β and IL-18 in response to poly(dA:dT), an AIM2 inflammasome activator, or flagellin, a NLRC4 inflammasome activator, relative to control (Control) (Fig. 3C). These results suggest that the genetic inhibition of DGAT1 suppressed NLRP3 inflammasome activation.
Genetic inhibition of DGAT1 suppresses K+ efflux and the formation of ASC specks for NLRP3 inflammasome activation
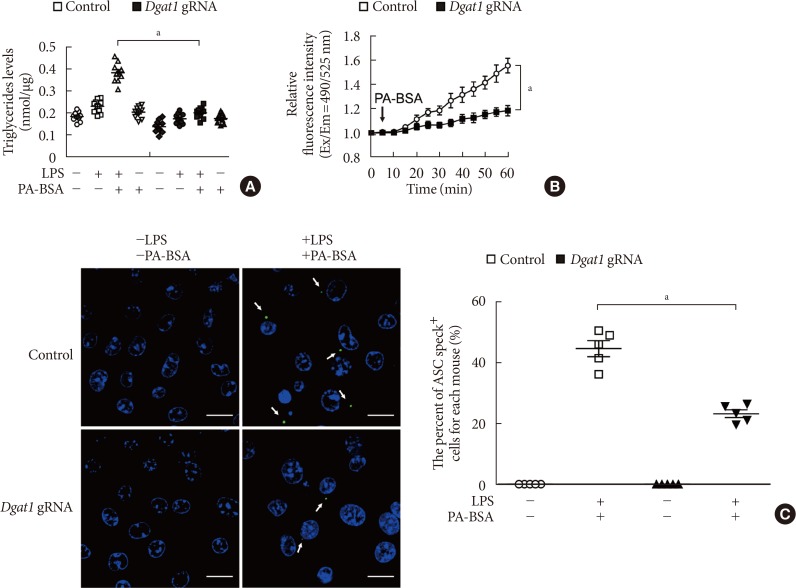
Next, we investigated whether genetic inhibition of DGAT1 could suppress K+ efflux and the formation of ASC specks in NLRP3 inflammasome activation. First, we analyzed the effect of DGAT1 genetic inhibition on TG synthesis during NLRP3 inflammasome activation.
Genetic inhibition of DGAT1 by Dgat1 gRNA (Dgat1 gRNA) significantly reduced the levels of TG in response to LPS and PA-BSA stimulation, compared to control (Control) (Fig. 4A). Notably, the genetic inhibition of DGAT1 by Dgat1 gRNA significantly suppressed Ca2+ influx by K+ efflux in response to LPS and PA-BSA stimulation, compared to vehicle control (Fig. 4B). Next, we measured the formation of ASC specks by NLRP3 inflammasome complex in each cell, which was analyzed by fluorescent protein tagged ASC. The genetic inhibition of DGAT1 by Dgat1 gRNA showed significantly lower formation of specks that were induced by LPS and PA-BSA stimulation, compared to control (Fig. 4C). These results suggest that the genetic inhibition of DGAT1 suppressed K+ efflux and the formation of ASC specks for NLRP3 inflammasome activation.
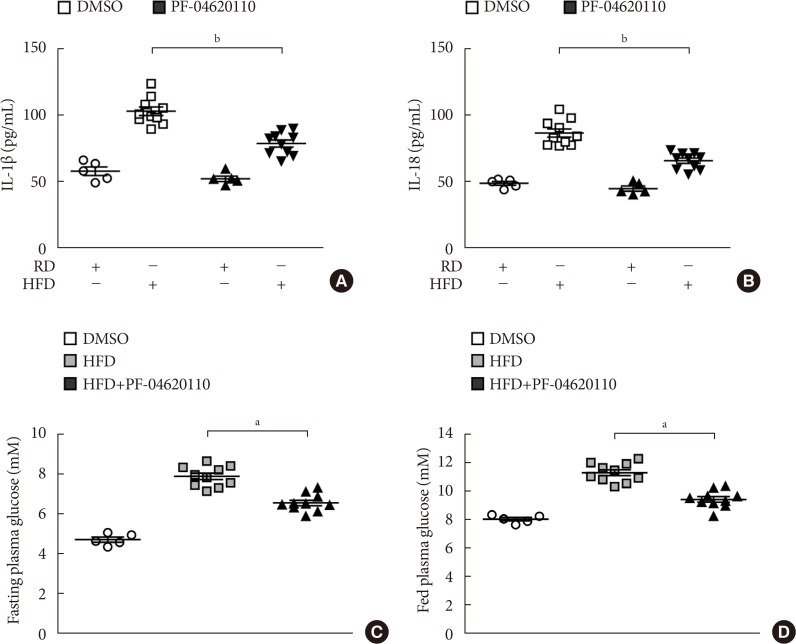
PF-04620110 suppressed HFD-induced IL-1β and IL-18 production in mice
We next investigated the effects of PF-04620110 treatment in HFD-induced diabetic mice. We first measured the levels of IL-1β and IL-18 in plasma from WT mice fed with HFD for 12 weeks, and then treated with PF-04620110 or vehicle control (DMSO) once a day at the dose of 3 mg/kg for another 4 weeks. The levels of IL-1β and IL-18 in plasma were increased in plasma from WT mice fed with HFD relative to mice fed with RD (Fig. 5A and B). PF-04620110 treatment resulted in lower plasma levels of IL-1β and IL-18 in WT mice fed with HFD, compared to vehicle-treated control mice (Fig. 5A and B). Moreover, PF-04620110 treatment reduced the levels of fasting or basal blood glucose in WT mice fed with HFD, relative to vehicle control (Fig. 5C and D). These results suggest that PF-04620110 suppressed HFD-induced IL-1β and IL-18 production in mice.
DISCUSSION
Here we demonstrate that PF-04620110 suppresses fatty acid-induced NLRP3 inflammasome activation. We show that PF-04620110 inhibits TG synthesis and the formation of ASC specks for NLRP3 inflammasome activation in macrophages. Moreover, we demonstrate that PF-04620110 reduces HFD-derived IL-1β and IL-18 production in the plasma from mice. Furthermore, we show that the genetic inhibition of DGAT1 suppresses NLRP3 inflammasome activation in macrophages.
The NLRP3 inflammasome activation is implicated in the progression of T2DM as an important component of chronic inflammation [567]. Among the various activators of NLRP3 inflammasome, elevated fatty acid is one of the major activators of NLRP3 inflammasome in patients with T2DM [6]. Therefore, the inhibition of fatty acid-induced NLRP3 inflammasome activation could be a potential pharmacologic target of chronic inflammation in T2DM. Our results showed that PF-04620110 suppresses fatty acid-induced NLRP3 inflammasome activation in macrophages. Moreover, we showed that PF-04620110 treatment suppresses HFD-derived IL-1β and IL-18 production and blood glucose levels in mice. Although the development of PF-04620110 was reported as a potent anti-diabetic agent [16], the function of PF-04620110 in the regulation of NLRP3 inflammasome-dependent chronic inflammation is not well understood. Our results suggest that PF-04620110 could be a potential pharmacologic inhibitor for fatty acid-induced chronic inflammation in T2DM.
Recent studies reported that potential drug or chemical candidates have been identified as the NLRP3 inflammasome inhibitor [242526272829]. The potential NLRP3 inflammasome inhibitors, such as MCC950, CY-09, OLT1177, Tranilast, and Oridonin, were validated in vitro, and in a mouse model including Parkinson's disease, acute arthritis, or HFD-induced diabetes [242526272829]. Each potential NLRP3 inflammasome inhibitor reduced NLRP3 inflammasome activation via the regulation of upstream signaling events of NLRP3 inflammasome activation, such as potassium efflux and mitochondrial damage [242526272829]. In our study, we found that the inhibition of TG synthesis by PF-04620110 treatment or DGAT1 deficiency suppresses K+ efflux and the formation of ASC specks, which is required for NLRP3 inflammasome activation. Since K+ efflux is an important mechanism for fatty acid-induced NLRP3 inflammasome activation [23], our results suggest that PF-04620110 could be a specific inhibitor for fatty acid-induced NLRP3 inflammasome activation by regulating K+ efflux. Recent studies have shown that the inhibition of DGAT1 promotes weight loss, reduction of TGs, and improved insulin sensitivity [163031]. In contrast, a previous paper suggests that the over-expression of DGAT1 contributes to the reduction of M1 inflammatory gene expression, such as IL-6 or TNF-α, in aP2-Dgat1 BMDMs treated with palmitate for 24 hours [32]. Since long-term exposure to fatty acids can affect cellular function [33], DGAT1-induced lipid droplets might be a negative regulator in their system. However, our results showed that DGAT1 inhibition did not change TNF-α in response to short-term stimulation with PA-BSA for 3 hours in LPS-primed BMDMs in our system. Consistent with recent studies [163031], our results suggest that the inhibition of DGAT1 can regulate improved insulin sensitivity by the inhibition of fatty acid-induced NLRP3 inflammasome activation. Given the previous findings, the regulation of DGAT1-mediated lipid droplets in NLRP3 inflammasome activation needs to be considered by further studies. Although the effects of DGAT1 inhibition in the changes of metabolic phenotype were reported [1631], the function of DGAT1 in the regulation of NLRP3 inflammasome-dependent chronic inflammation is not well understood. Our results suggest that the DGAT1-dependent TG synthesis pathway is critical for fatty acid-induced NLRP3 inflammasome activation via K+ efflux and NLRP3 inflammasome complex formation.
In conclusion, our current findings demonstrate that the inhibition of NLRP3 inflammasome by PF-04620110 could be a potential therapeutic target of fatty acid-induced chronic inflammation in T2DM.
 XML Download