

 PDF
PDF ePub
ePub Citation
 Print
Print


INTRODUCTION
Gestational diabetes mellitus (GDM) is mainly caused by impaired insulin action and β-cell dysfunction [12]. A number of studies have shown that hyperglycemia in pregnancy increases the risk for complications in offspring such as macrosomia or neonatal hypoglycemia [3]. Moreover, females with a history of GDM have an increased risk of developing aggravated insulin resistance later in life, which is closely related to a high prevalence of type 2 diabetes mellitus [45]. Despite serious complications, the diagnosis of GDM is not performed until the late second or early third trimester [67], allowing only a shorter duration for interventions [8]. However, an earlier identification of the risk group might be beneficial to reduce morbidities (such as large for gestational age offspring) through lifestyle modification, as previously shown in obese patients [9]. This might be achieved by measuring biochemical predictors such as fasting plasma glucose (FPG) and glycosylated hemoglobin (HbA1c), or other laboratory parameters of glycemic condition like fasting insulin (FI) or fasting C-peptide (FCP) [10]. Another approach for an early risk assessment is to evaluate the extent of metabolic alterations by analyzing the amount of insulin sensitivity and secretion. This might be done using the hyperinsulinemic-euglycemic clamp [11], frequently-sampled intravenous glucose tolerance test [12], or dynamic indices based on oral glucose tolerance test (OGTT) measurements [13]. Although these examinations could provide detailed insights on the pathophysiological processes besides an altered glucose metabolism, they are rather time consuming and expensive.
In contrast, there are some simple mathematical approaches to assess the insulin sensitivity and insulin secretion based on fasting measurements of glucose, insulin, and C-peptide. One such example is the homeostatic model assessment of insulin resistance (HOMA-IR), which might be better applicable for stratifying the risk group in clinical settings [14]. However, the accuracy of these approaches for GDM prediction in early gestation has not been assessed so far.
Therefore, this study aimed to quantify and compare the values of HbA1c, glucose, insulin, and C-peptide as well as simple indices of glucose disposal at early pregnancy to predict the development of GDM at later stage. Moreover, the relationship of these parameters with the plasma glucose levels during OGTT, as well as the importance of them in predicting the need for glucose-lowering medications was also examined.
METHODS
Study design and participants
In this prospective cohort study, we included a total of 574 females. Of them, 471 showed a normal glucose tolerance (NGT) until the delivery and 103 developed GDM. Study participants were consecutively recruited from the pregnant females attending the pregnancy outpatient clinic (Division of Obstetrics and Feto-maternal Medicine, Department of Obstetrics and Gynecology, Medical University of Vienna) between January 2016 and July 2017. Female with preexisting diabetes were excluded. A broad risk evaluation was performed at the first or early second trimester (median, 12.0 weeks of gestation [interquartile range (IQR), 12 to 13]), including the assessment of pregestational (based on the self-reported, pregestational weight) and current body mass index (BMI), age, parity, and obstetric history. In addition, a metabolic characterization was performed at the first visit by measuring HbA1c, plasma glucose, insulin, and C-peptide. All parameters were measured after at least 8-hour of fasting. Thereafter, the participants were followed up until the delivery to assess the status of GDM using a 75 g 2-hour OGTT, which was performed until the late second or early third trimester, according to the International Association of Diabetes in Pregnancy Study Groups (IADPSG) recommendations [6]. In cases where fasting glucose was ≥92 mg/dL before 24 weeks of gestation, the presence of GDM was verified by the early OGTT (n=6) or self-monitored blood glucose level (n=14). Pharmacotherapy (insulin and/or metformin) was started when the glycemic targets were not achieved by the intensive lifestyle interventions according to the international guidelines (i.e., if fasting and postprandial glucose levels exceed 95 and 140 mg/dL, respectively) [15]. Six females with negative OGTT results received glucose-lowering medication during the follow-up due to macrosomia in combination with hyperglycemia, and therefore, were classified as GDM patient.
All laboratory parameters were measured according to the standard laboratory methods at our certified Department of Medical and Chemical Laboratory Diagnostics (http://www.kimcl.at). Briefly, the plasma glucose level was measured by the hexokinase method with a coefficient of variation (CV) of 1.3%. The levels of insulin and C-peptide were measured by chemiluminescence immune assays with CVs of 4% to 7% and 3% to 4%, respectively. HbA1c was assessed by high performance liquid chromatography (International Federation of Clinical Chemistry and Laboratory Medicine standardized and Diabetes Control and Complications Trial aligned, CV=1.8%).
The study was approved by the Ethics Committee of the Medical University of Vienna (approval number: 1937/2015) and performed in accordance with the Declaration of Helsinki. All participants gave the written informed consent.
Calculations
Glucose homeostasis at the early gestation was assessed using the following formula: HOMA-IR (dimensionless)=FPG (mg/dL)×FI (µU/mL)/405 and homeostatic model assessment of beta-cell function (HOMA-B) (dimensionless)=20×FI (µU/mL)/[FPG (mmol/L)−3.5]. This was performed to evaluate the amount of insulin resistance and secretion at fasting condition [16]. Moreover, we used modified insulinogenic index from insulin (IGIi, µU/mg)=FI (µU/mL)/[FPG (mg/dL)×0.01] and insulinogenic index from C-peptide (IGIc, ng/mg)=FCP (ng/mL)/[FPG (mg/dL)×0.01] as an alternative method to estimate the amount of insulin secretion [17]. Insulin action was further assessed by the quantitative insulin sensitivity check index from insulin (QUICKIi, dimensonless)=1/[log10(FPG [mg/dL])+log10(FI [µU/mL])] and quantitative insulin sensitivity check index from C-peptide (QUICKIc, dimensionless)=1/[log10(FPG [mg/dL])+log10(FCP [ng/mL])]. The latter provided an estimation of insulin sensitivity from prehepatic measurements [18].
Statistical analysis
Continuous variables were summarized by mean±SD as well as median and IQR and compared by Student's t-test or the Wilcoxon rank sum test, respectively. Categorical variables were summarized by counts and percentages and compared by the Pearson's chi-square test. Binary logistic regression was used to evaluate the association between baseline parameters (e.g., FPG, HbA1c, and parameters of glucose metabolism) and dichotomous outcomes (e.g., GDM manifestation or GDM with a need of pharmacotherapy). Thereafter, the predictive accuracy of these parameters was assessed by the area under the receiver operating characteristics curves (ROC-AUC). The proportional odds cumulative logit model was used as a supporting approach to assess the association with ordered outcomes (e.g., NGT, GDM without pharmacotherapy, and GDM with pharmacotherapy). Adjusted odds ratios (AOR) were assessed by multiple binary and ordinal logistic regression models after the adjustment for covariates (such as age and BMI). The associations between continuous variables were examined by the Spearman's rank correlation. Statistical analysis was performed with R (version 3.5.0) and contributing packages [19]. A two-sided P value of ≤0.05 was considered statistically significant. Due to the explorative character of this observational study, we used no further adjustment for multiple statistical testing.
Novelty statement
This study aimed to assess the biochemical predictors of glucose metabolism, in addition to fasting indices of glucose disposal, in order to predict the development of GDM and/or GDM with a need of glucose-lowering medications at later stage of pregnancy. It was observed that the fasting measurements of glucose, C-peptide, and surrogate indices of glycemic condition (such as QUICKI from C-peptide) could be used for risk stratification at the beginning of pregnancy, with the advantage of having cheap, less time consuming and simple experimental procedures.
RESULTS
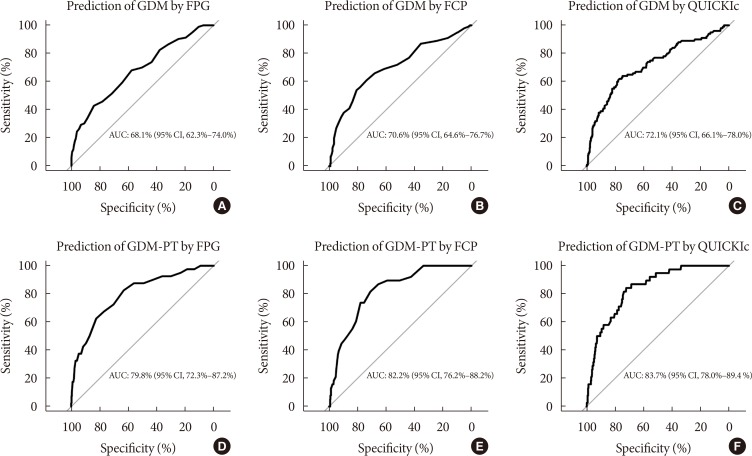
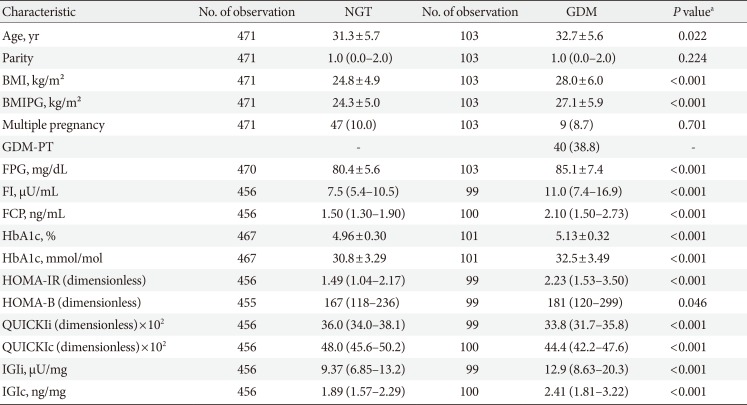
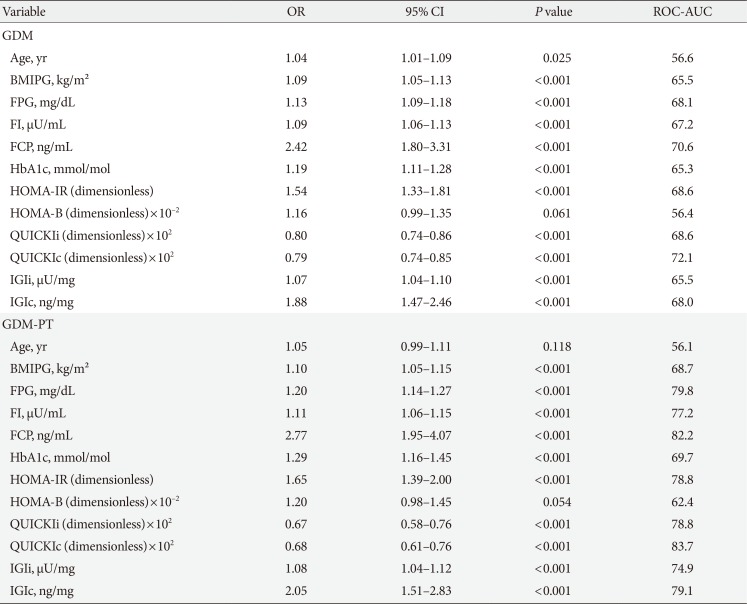
The baseline characteristics are reported in Table 1. Females with NGT had lower levels of FPG, FI, FCP, as well as HbA1c at the early gestation, and therefore, showed significantly improved insulin action as compared to that in females who developed GDM. Hence, the fasting laboratory assessment of glucose, insulin, and C-peptide as along with other parameters of glucose metabolism showed a moderate to fair accuracy to predict the development of GDM at later stage (in terms of ROC-AUC) (Table 2). Moreover, the predictive accuracy of these parameters was even better to distinguish the patients who required glucose-lowering medications (GDM with pharmacotherapy [GDM-PT]) (Table 2). As compared to FPG and FCP (Fig. 1), the predictive value of HbA1c was inferior (HbA1c vs. FPG, P=0.019; and HbA1c vs. FCP, P=0.005 for the prediction of GDM-PT, respectively). The accuracy of FPG and FCP to predict GDM-PT was superior to other traditional risk factors, such as age (FPG, P<0.001; FCP, P<0.001) and pre-gestational BMI (FPG, P=0.020; FCP, P<0.001). ROC-AUC values were not significantly different between FPG and FCP. However, the multiple binary logistic regression indicated that the association of FPG and FCP with the development of GDM (FPG [mg/dL]: AOR, 1.10; 95% confidence interval [CI], 1.06 to 1.14; P<0.001) (FCP [ng/mL]: AOR, 1.85; 95% CI, 1.37 to 2.55; P<0.001) or GDM-PT (FPG [mg/dL]: AOR, 1.15; 95% CI 1.09 to 1.22; P<0.001) (FCP [ng/mL]: AOR, 2.05; 95% CI, 1.39 to 3.02; P<0.001) was independent of each other; comparable results were observed when maternal age and pre-gestational BMI were additionally included into the model. Comparable results were observed when ordinal logistic regression (including FPG, FCP, age and pre-gestational BMI as independent variables) was used as a supporting approach (FPG [mg/dL]: AOR, 1.10; 95% CI, 1.06 to 1.14; P<0.001) (FCP [ng/mL]: AOR, 1.84; 95% CI, 1.33 to 2.55; P<0.001). As compared to other parameters of glucose homeostasis, QUICKIc (representing an insulin sensitivity index from FPG and FCP) showed the best differentiation with highest ROC-AUC values (Table 2, Fig. 1). Moreover, QUICKIc and IGIc showed significantly higher ROC-AUC values as compared to other traditional indices based on insulin for predicting GDM (QUICKIc vs. HOMA-IR, P=0.010; QUICKIc vs. QUICKIi, P=0.011; IGIc vs. HOMA-B, P<0.001) or GDM-PT (QUICKIc vs. HOMA-IR, P=0.005; QUICKIc vs. QUICKIi, P=0.004; IGIc vs. HOMA-B, P<0.001) (Table 2). These conclusions remained valid in sensitivity analyses after excluding the patients with multiple pregnancies or those with preterm delivery (before 37 weeks of gestation).
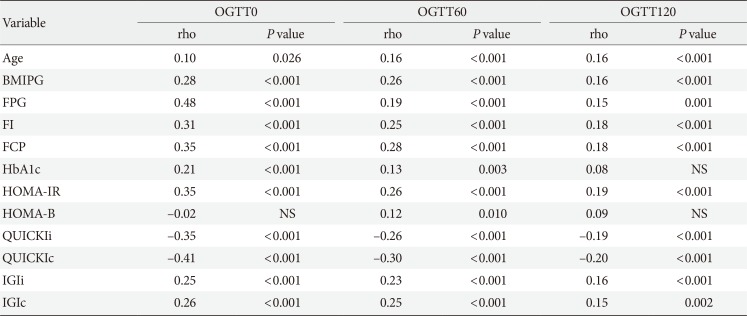
The association between fasting laboratory parameters at baseline and glucose values during OGTT in later pregnancy was examined and presented in Table 3. The highest correlation was observed between OGTT 0-minute and FPG (ρ [rho]=0.48; 95% CI, 0.41 to 0.55) and QUICKIc (ρ [rho]=−0.41; 95% CI, −0.49 to −0.33); however, their association with postprandial glucose concentrations (OGTT 60-minute and OGTT 120-minute) was lower (Table 3).
DISCUSSION
This study aimed to evaluate the accuracy of fasting laboratory assessments as well as simple quantification of glucose metabolism, including parameters of insulin secretion and sensitivity, at early pregnancy to predict the development of GDM at later stage. We found that fasting levels of glucose, insulin, and C-peptide together with HbA1c showed a moderate to fair difference between the female with later GDM manifestation and healthy pregnancies. However, the prognostic value of some parameters was markedly higher in predicting GDM patients who ultimately required glucose-lowering medications. Overall, FPG, FCP, and QUICKIc showed good performance and were superior to HbA1c.
One of the major advantages is both FPG and HbA1c could be used for detecting diabetes already at the first antenatal visit (i.e., if FPG exceeds 125 mg/dL [6.9 mmol/L] and HbA1c exceeds 6.4% [47 mmol/mol]) [672021]. However, it is an ongoing matter of debate if the concentration below these thresholds could be used for diagnosing GDM (which could be regarded as a transient “prediabetic” state of altered glucose metabolism) before 24 weeks of gestation as well [722]. Although this approach is currently not supported by healthcare organizations due to lack of evidence, most authors agree that the predictive value of laboratory assessments needs further evaluation to allow an accurate risk stratification at the beginning of pregnancy. Previous studies have assessed the association between first trimester FPG and GDM manifestation in 24 and 28 weeks of pregnancy using the IADPSG definition and observed concordance measures (i.e., ROC-AUC values) between 61.4% [23] and 65.4% [24], which is comparable to those observed in our study. In addition, we found that measures of concordance were markedly increased (up to 79.8% for FPG) if the need for glucose-lowering medication in later stage was predicted. This suggests that the early pregnancy assessment of FPG might be useful to differentiate between less and more severe disease progression even at the first antenatal visit. This, however, was not the same for HbA1c, which showed a predictive value significantly inferior to that observed for FPG. There are some possible reasons explaining the lower prognostic value of HbA1c. Firstly, HbA1c is associated with pregnancy specific changes including iron deficiency and anemia, as reviewed in detail by [25]. Secondly, in contrast to FPG, HbA1c is a weak surrogate of insulin resistance or secretion, as observed in females with GDM in one of our previous studies [26]. However, it is worth mentioning that, to the best of our knowledge, the association between HbA1c and impaired insulin action and/or β-cell dysfunction at early pregnancy has not been assessed by any other study so far. In addition, some studies have indicated that the first trimester HbA1c level in a prediabetic range (i.e., above 5.7% or 5.9%) is highly predictive for the development of GDM [2728]. However, results are conflicting [29] and we conclude that further investigations are necessary to clarify this topic.
In addition to FPG, C-peptide was identified as another predictor with a ROC-AUC of 82.2% for GDM, especially GDM with a need of pharmacotherapy. This effect was independent of FPG, BMI, and age. Moreover, the measures of concordance tended to be higher than those observed for FI (either for the prediction of GDM or GDM-PT). Indeed, C-peptide has several advantages [30]: In contrast to insulin, it has negligible hepatic first-pass extraction and more constant peripheral clearance with longer half-life, and therefore, has higher and more stable blood concentration as compared to insulin. Unlike HbA1c, FCP provides a more robust description of insulin secretion (at fasting state); but, it is also an indicator of impaired insulin action particularly if the FCP levels are increased together with the plasma glucose concentrations. The interaction between glucose and C-peptide can be easily described by QUICKIc and IGIc, providing a simple assessment of insulin action and insulin secretion, respectively. We found that both indices had higher predictive values, and thus, became superior to other traditional indices based on the mathematical combination of glucose and insulin, such as HOMA-IR and HOMA-B. Particularly, QUICKIc showed the highest ROC-AUC value for predicting GDM or GDM with a need of pharmacotherapy. Accordingly, we [31] and others [32] found impaired insulin sensitivity in patients with hyperglycemia at early gestation.
The observations of our study are of clinical importance, as we effectively predicted the occurrence of GDM by less expensive laboratory measurements and simple assessment of glucose metabolism derived from fasting condition. However, the advantage of easy and simple measurement procedure might be also considered as a possible limitation of these parameters. The correlation analysis revealed that early gestational FPG and QUICKIc were associated with the results of OGTT during the second and third trimester. The strongest associations were observed with OGTT fasting glucose, whereas the correlation considerably decreased for glucose concentrations at 60 and 120 minutes after oral glucose load. This can be explained by different pathophysiological mechanisms [3334]: an impaired fasting glucose reflects hepatic insulin resistance and early-phase insulin response, whereas hyperglycemia during later OGTT periods reflects insulin resistance in the muscle and impaired early- and late-phase insulin secretion. Thus, it might be difficult to get a complete picture of glucose metabolism by exclusively using fasting samples. However, dynamic tests are time consuming and expensive. In this context, fasting laboratory measures and indices might provide an alternative approach with acceptable predictive accuracy, as suggested by the results of this study.
In summary, we found that FPG and FCP together with indices of insulin action or secretion might be used for risk stratification at the beginning of pregnancy. The main advantages include cheap, less time consuming, and simple experimental procedures. The accuracy of these measures and indices should be evaluated using clinical prediction models for an early classification of pregnant females who are particularly at high risk for developing GDM or GDM with a need for glucose-lowering medications.
 XML Download