

 PDF
PDF ePub
ePub Citation
 Print
Print


INTRODUCTION
The population of diabetic kidney disease (DKD) continues to rise around the world. DKD leads to excess morbidity and premature mortality and is a great socioeconomic burden in patients with diabetes [1]. Traditionally, microalbuminuria has been known as an early predictor of the onset of DKD. However, recent studies have demonstrated that a substantial number of patients with type 2 diabetes mellitus (T2DM) with chronic kidney disease (CKD) exhibited no albuminuria, challenging the traditional concept of the natural history of DKD that is closely linked to the progression of albuminuria [23].
A decline in glomerular filtration rate (GFR) was initially considered to occur only in patients with albuminuria [4]. However, recent studies in type 1 diabetes mellitus explored trajectories of estimated glomerular filtration rate (eGFR) decline and found that there is a subset of patients with early progressive rapid renal function decline which occurs while patients have preserved renal function and continues to progress until they reach end stage renal disease (ESRD) [56]. Interestingly, this rapid renal function decline may sometimes precede the onset of albuminuria [237]. It is also suggested that rapid renal function decline is another strong predictor of progression to ESRD [78]. Many observational studies have investigated potential clinical risk factors contributing to rapid renal function decline in diabetes. However, the results have been somewhat inconsistent due to various definitions of rapid renal function decline and heterogeneous patient populations [2578910]. Furthermore, literature relevant to rapid renal function decline in T2DM and preserved kidney function is limited [8910]. Measurements of urine albumin-creatinine ratio (UACR) and eGFR have been current standard of care to diagnose diabetic nephropathy. However, they have limited utility distinguishing early renal function decliners from non-decliners. Currently, there is a lack of effective prognostic markers that can identify decliners in T2DM. As early implementation of intensive therapy in those patients at risk of developing rapid renal function decline would result in better outcomes than treating them late during the course [11], identification of diagnostic markers of rapid renal function decline is crucial.
Carotid intima-media thickness (CIMT) and carotid plaque (CP) are non-invasive measurement of carotid atherosclerosis and are reliable markers of early systemic atherosclerosis and cardiovascular risk [12]. Kidney dysfunction even in the earliest stage is closely linked to cardiovascular diseases (CVDs) [13]. DKD and CVD also share many risk factors [9]. Previous studies have shown that increased CIMT was associated with low eGFR [14] and progression to CKD in T2DM [15]. However, these studies were relatively small in size and the association between early rapid renal function decline and CP was not assessed. Therefore, in the present study, we aimed to investigate the association between carotid atherosclerosis including CP and early rapid renal function decline in a prospective observational cohort study of patients with T2DM and preserved renal function.
METHODS
Study population
The study protocol was approved by the Institutional Review Board of each institution (IRB 2006-67) and all participants provided written informed consent prior to participation. Subjects were participants in the Korean National Diabetes Program (KNDP), a prospective, observational, multicenter cohort study of patients with T2DM who were recruited to understand the characteristics of Koreans with T2DM. ClinicalTrials. gov identifier was NCT01212198. The details of the KNDP cohort have been described previously [16]. Briefly, subjects were eligible to participate in the study if the patient was diagnosed with T2DM according to the American Diabetes Association criteria and/or was being treated with oral hypoglycemic agents or insulin for known T2DM [17].
A total of 4,324 patients with T2DM were enrolled from 12 academic medical centers of Korea during the period from May 2006 to July 2009 and then followed up until March 2014. Of these subjects, patients with diabetes duration <1 year, those with an eGFR <60 mL/min/1.73 m2 and those who had <6 annual GFR measurements during the follow-up were excluded. Finally, 967 patients with preserved renal function met the inclusion criteria and were included in the current analysis.
Demographic, physical, and laboratory measurements
Information on medical history was obtained from all patients during interviews by trained personnel. Height and weight were measured to the nearest 0.1 cm and 0.1 kg, respectively. Body mass index was defined as weight (kg) divided by height (m) squared. Waist circumference was measured at the midpoint between the lower borders of the rib cage and the iliac crest. Blood pressure was measured after the subject had rested for at least 10 minutes in a sitting position. Diabetic retinopathy was diagnosed based on fundoscopic examinations [18]. Hypertension was defined as blood pressure ≥140/90 mm Hg or any antihypertensive drug treatment. CVD was defined as presence of ischemic heart diseases including stable angina, acute coronary syndrome and myocardial infarction with ST segment elevation.
Blood samples were collected after an overnight fast of at least 10 hours and stored at −70℃ for subsequent assays. Serum triglycerides and high density lipoprotein cholesterol levels were determined enzymatically using a chemistry analyzer (Hitachi 747; Hitachi, Tokyo, Japan). Low density lipoprotein cholesterol levels were calculated using the Friedewald formula [19]. A glucose oxidase method was employed to measure plasma glucose, and an electro-chemiluminescence immunoassay (Roche Diagnostics, Indianapolis, IN, USA) was used to measure insulin levels. Homeostasis model assessment of insulin resistance levels were calculated by dividing the product of fasting insulin (IU/mL) and fasting glucose (mmol/L) concentrations by 22.5 [20]. Glycosylated hemoglobin (HbA1c) was measured using high performance liquid chromatography (Bio-Rad Variant II; Bio-Rad, Hercules, CA, USA). A random urine sample was obtained for albumin creatinine ratio (ACR) measurements. Urinary creatinine and albumin were measured using a turbidimetric assay (Cobas Integra; Roche Diagnostics, Mannheim, Germany). Normoalbuminuria was defined as a spot UACR <30 µg/mg Cr, microalbuminuria as UACR ≥30 and <299 µg/mg Cr, and macroalbuminuria as UACR ≥300 µg/mg Cr [21].
Renal function measurement
The eGFR values were calculated using the Chronic Kidney Disease Epidemiology Collaboration (CKD-EPI) creatinine equation [22]: it was calculated as eGFR=141×min(Scr/κ,1)α×max(Scr/κ, 1)−1.209×0.993Age×1.018 (if female) (where Scr is serum creatinine in mg/dL; κ is 0.7 for females and 0.9 for males; α is −0.329 for females and −0.411 for males; min is the minimum of Scr/κ or 1; and max is the maximum of Scr/κ or 1). Annual eGFR decline was calculated as follows. For each patient, a linear regression model of time on eGFR (least-squares method) was created, and the slope of the regression line was used to estimate the patient's changes in eGFR over time. The eGFR slope was expressed as percentage per year by dividing the slope by the baseline eGFR value [10]. Rapid renal function decline was defined as eGFR decline >3.3%/year, which is in accordance with previous studies [78].
CIMT and CP assessment
CIMT and presence of CP were measured in the right and left common carotid arteries (CCAs) by high resolution B-mode ultrasonography as previously described [23]. Sonographers that were unaware of subjects' characteristics scanned bilateral CCAs, the carotid bulb, and the proximal portions of the internal and external carotid arteries in two planes (anterior oblique and lateral), and then focused on the interfaces required to measure intima-media thickness (IMT) and on any areas of focal plaque. CP was defined as a focal structure encroaching into the arterial lumen with a thickness >1.2 mm [24]. Measurements from the left and right CCAs were made at the far walls of the 20-mm segment distal to the carotid bulbs. Reading and analysis of images were done by a single well-trained physician who was blinded to the identity of the patient. The mean value of left and right CCAs IMT was used as the mean CIMT. Computer-assisted acquisition, processing, storage of B-mode images, and CIMT calculations were performed using Intima Scope software (MediaCross, Tokyo, Japan). To measure reader reproducibility, IMT for the first 122 subjects were measured repeatedly, and the results indicated that there was a 0.00±0.03 difference in the mean IMT. To minimize inter-measurer errors, workshops were conducted for ultrasound measurers from all participating institutions before study initiation and then annually during the study, and inter-measurer reproducibility was measured for the reference. During the entire period, intra-class correlation for ultrasound measurers was 0.97 to 0.99 for the mean IMT.
Statistical analysis
Data are presented as mean±standard deviation and frequencies. Skewed variables were logarithmically transformed to improve normality before analysis (ACR, mean CIMT). The t-test (for continuous variables) and the chi-square test (for categorical variables) were used to analyze the differences among the baseline characteristics of participants stratified by presence or absence of rapid renal function decline or CP. Univariable and multivariable logistic regression models were performed to examine the associations between variables at baseline and the development of rapid renal function decline. Area under the curve (AUC) from receiver operating characteristics analysis was estimated to evaluate the discriminatory performance for the multivariable logistic regression model on the rapid renal function decline adjusting for clinical risk factors and CP. The difference between AUC estimates between the models with (i=1) and without CP (i=2) was tested using the Wald statistic:
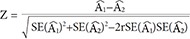
for an estimated AUC  in the model i and correlation coefficient r between two , which asymptotically follows a standard normal distribution [25]. These clinical risk factors were chosen on the basis of their significance in multivariable logistic analysis or on the basis of their biologic plausibility. All analyses were done with 95% confidence intervals (CI) and the level of significance was determined at P<0.05. Statistical analysis was performed with SPSS version 19.0 statistical package software (IBM Co., Armonk, NY, USA).
in the model i and correlation coefficient r between two , which asymptotically follows a standard normal distribution [25]. These clinical risk factors were chosen on the basis of their significance in multivariable logistic analysis or on the basis of their biologic plausibility. All analyses were done with 95% confidence intervals (CI) and the level of significance was determined at P<0.05. Statistical analysis was performed with SPSS version 19.0 statistical package software (IBM Co., Armonk, NY, USA).RESULTS
A total of 967 patients with T2DM (mean age 53.7±9.4 years; 57.4% men) were included in the present study. Mean duration of diabetes was 5.4±5.8 years and mean HbA1c was 7.7%±1.8%. Baseline eGFR was 95.6±14.6 mL/min/1.73 m2. Six hundred and fifty-five patients (67.7%) had normoalbuminuria, 191 (19.8%) had microalbuminuria, and 23 (2.4%) had macroalbuminuria. Four hundred and forty-three (45.8%) had hypertension, 107 (1.1%) had previous history of CVD, and 315 (32.6%) had CP.
All patients had at least six annual measurements of eGFR with a median follow-up duration of 6 years (range, 5 to 6 years). Annual eGFR decline (%) of the whole cohort was −1.1%±2.6%/year. The decline was more rapid in female (−2.1%±2.5%/year) than male (−0.4%±2.4%/year; P<0.001) (Supplementary Table 1). During the follow-up period, 158 patients (16.3%) showed rapid decline of eGFR, as defined as >3.3%/year. Mean annual eGFR decline was −5.2%±1.9%/year in rapid decliners and −0.4%±1.9%/year in non-decliners (P<0.001). One patient developed ESRD at the end of follow-up. In a sub-analysis of females, the proportion of rapid decliners was marginally higher in postmenopausal women compared to premenopausal women (19.9% vs. 28.8% in premenopausal women and postmenopausal women respectively, P=0.051) (Supplementary Table 2).
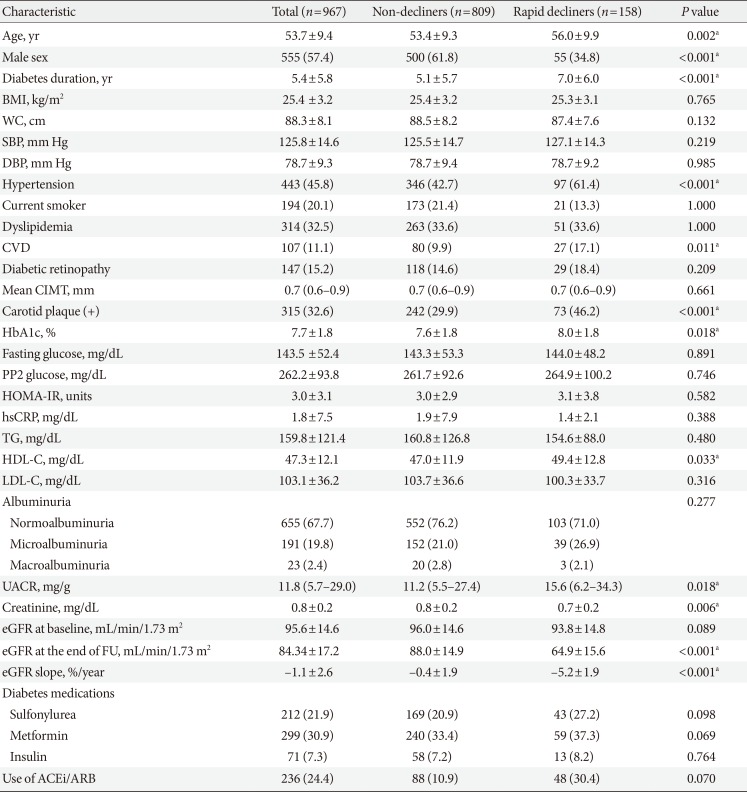
Baseline characteristics of rapid decliners and non-decliners are summarized in Table 1. Rapid decliners were significantly older, tended to be females, and exhibited a longer duration of diabetes. They also had a higher prevalence of hypertension, CVD and CP but there was no significant difference in CIMT between groups. Patients with rapid renal function decline had higher level of HbA1c and UACR at baseline. However, the majority of the rapid decliners showed normoalbuminuria at baseline (71.0%), which was comparable to 76.2% of non-decliners. The presence of diabetic retinopathy did not differ between two groups.
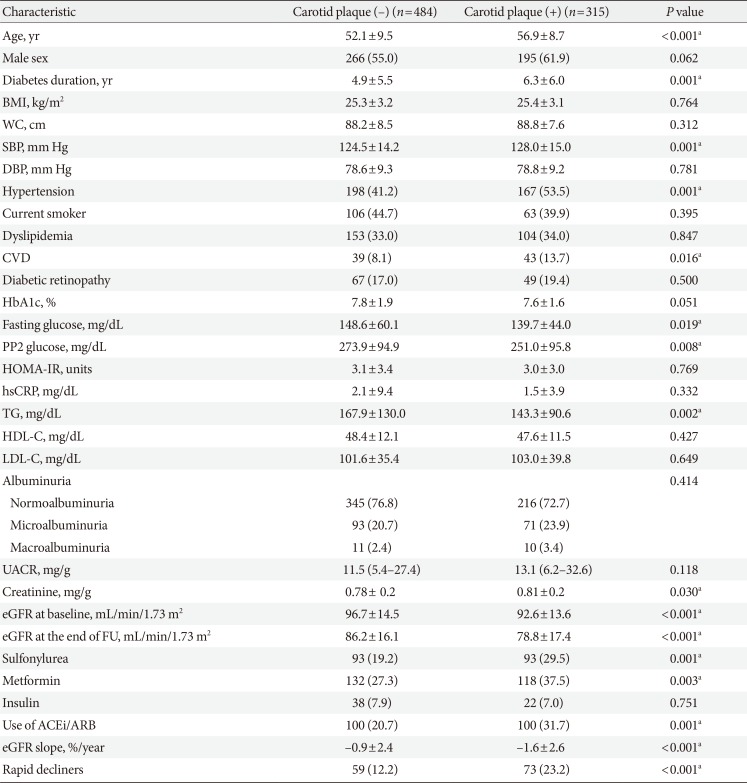
When stratified by the presence of CP (Table 2), patients with CP were significantly older, exhibited longer duration of diabetes, higher SBP, and lower baseline eGFR. They also had a higher prevalence of hypertension and CVD, and were treated more frequently with metformin, sulfonylurea, and angiotensin-converting-enzyme inhibitors (ACEi)/angiotensin II-receptor blockers (ARB). They had a higher proportion of patients with rapid renal function decline and showed greater annual mean eGFR decline (%). UACR was not different between groups and 72.7% of patients with CP had normoalbuminuria at baseline.
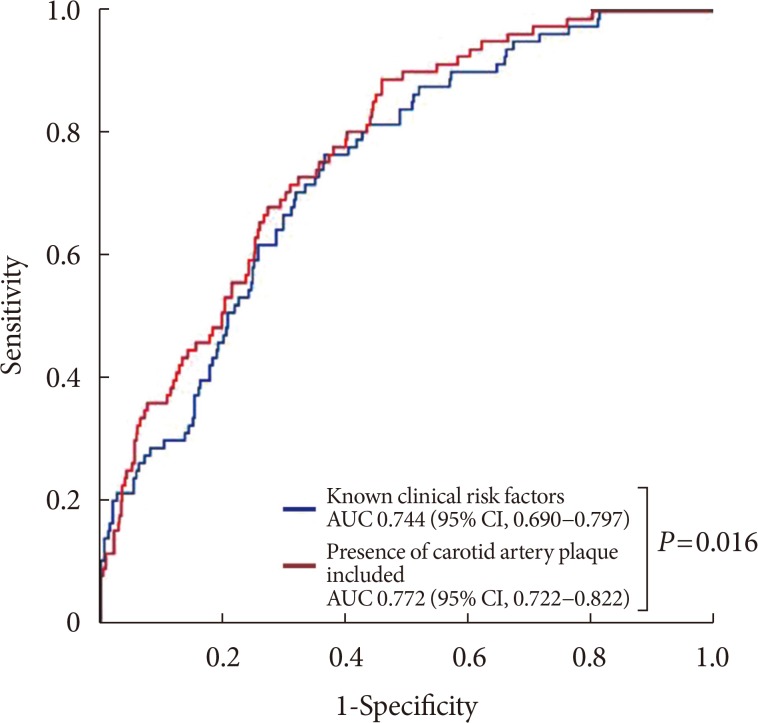
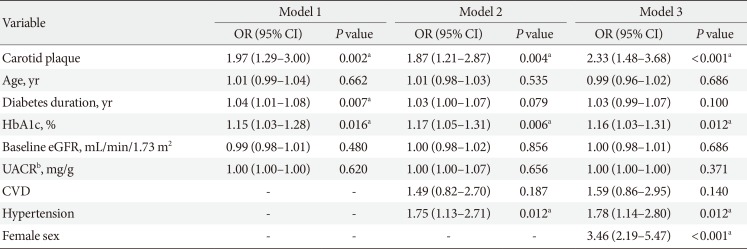
The presence of CP was associated with rapid renal function decline after adjustment for potential confounders including age, sex, duration of diabetes, HbA1c, baseline eGFR, UACR, previous history of CVD and hypertension (Table 3). The adjusted odds ratio (OR) for rapid renal function decline with the presence of CP was 2.33 (95% CI, 1.48 to 3.68; P<0.0001). Other significant predictors of rapid renal function decline were female sex (OR, 3.46; 95% CI, 2.19 to 5.47; P<0.0001), hypertension (OR, 1.78; 95% CI, 1.14 to 2.80; P=0.012), and higher HbA1c (OR, 1.16; 95% CI, 1.03 to 1.31; P<0.012) at baseline. In a sub-analysis of females, stratified by menopause status, the presence of CP was an independent risk factor for postmenopausal women (OR, 2.12; 95% CI, 1.06 to 4.25; P=0.034) while no association was found in premenopausal women (Supplementary Table 3). The discriminatory ability of the model with CP on rapid renal function decline was compared by the AUC estimates (Fig. 1). For the model with clinical risk factors only (age, sex, duration of diabetes, hypertension, CVD, diabetic retinopathy, use of ACEi/ARB, baseline eGFR, HbA1c, and UACR) of rapid renal function decline, the estimated AUC to discriminate rapid renal function decline was 0.744 (95% CI, 0.690 to 0.797; P<0.001). After the addition of CP in the model, the discriminatory performance was significantly improved for rapid renal function decline (0.772; 95% CI, 0.722 to 0.822; P<0.001). The P value for the comparison in AUCs for the models with and without CP was 0.016.
DISCUSSION
In this prospective, multicenter observational cohort followed over 6 years, we observed for the first time that the presence of CP was an independent predictor of early progressive rapid renal function decline in patients with T2DM and preserved renal function. Rapid renal function decline occurred in 16.3% (n=158) of patients over 6 years in our cohort and the presence of CP was one of the powerful risk factors for rapid renal function decline, even after adjusting for established clinical risk factors and confounders. Other independent clinical predictors for rapid renal function decline were female sex, hypertension, and higher HbA1c at baseline.
Non-invasive measurement of carotid atherosclerosis, including measurement of CIMT and CP allows monitoring of the presence and progression of atherosclerosis [2426]. In the current study, CP was associated with rapid renal function decline in patients with T2DM, while CIMT did not show any significant association. This may be due to the fact that CIMT and CP represent different stages of the atherosclerotic process. CIMT likely reflects earlier stages of atherogenesis, mainly a hypertrophic response of arterial intimal and medial cells to lipid infiltration or hypertension. In contrast, CP may represent a later stage of atherogenesis related to inflammation, oxidation, endothelial dysfunction, and smooth muscle cell proliferation [2728].
There have been various studies examining the association between carotid atherosclerosis and renal function decline. In a multi-center study with non-diabetic population, kidney function was measured using cystatin C, which was significantly associated with both CIMT thickening and CP. However, another prospective study with healthy individuals showed that there was no independent relationship between ageing-related decline in kidney function and CIMT [29]. Takenouchi et al. [15] investigated the association between CKD and CIMT in a prospective study with T2DM and found that maximum CIMT was one of the significant predictors of CKD deterioration (hazard ratio, 4.0; 95% CI, 1.1 to 14,226.7; P=0.03) independent of other clinical risk factors including age. However, they included those patients with CKD at baseline and their sample size was rather small. We believe that inconsistent results are most likely due to differences in the study population and and the definition of the primary end point. As the early rapid renal function decline is the process that occurs during the preserved renal function, it may occur in those patients with higher vascular burden/risk, in this case, those with CP.
The present study suggests that subclinical atherosclerosis is strongly associated with rapid renal function decline independent of other clinical risk factors in patients with T2DM and preserved renal function. Although exact causation between atherosclerosis and rapid renal function decline needs to be further elucidated, we can speculate that ischemic renal changes caused by atherosclerosis of the intrarenal arteries may have resulted in rapid GFR decline even in the absence of albuminuria [3031]. Furthermore, it was reported that the renal resistive index (RI), a reliable marker of renal atherosclerosis, is significantly elevated in patient with diabetic nephropathy and correlated with creatinine clearance [32]. Given previously reported correlation between renal RI and carotid atherosclerosis [33], these findings may implicate that intrarenal vascular resistance or renal atherosclerosis precedes classical pathophysiologic process of diabetic glomerulosclerosis in early renal function decline. Therefore, detection of CP by B-mode ultrasonography may be an easy, non-invasive method for the early detection of those patients at risk for early rapid renal function decline [34].
In agreement with previous publications, we also found that hypertension was closely associated with rapid renal function decline [1035]. Hypertension is a well-established risk factor for CVD as well as CP formation. Our study also showed a higher incidence of rapid renal function decline with greater annual eGFR decline (%) in women compared to men during 6 years of follow-up. Although estrogen is known to have renoprotective effects by alteration of renin-angiotensin system, reduction in mesangial collagen synthesis, and upregulation of nitric oxide synthesis in kidney [36], diabetes itself alters sex hormone production in both women and men [37] and the effect of alteration in sex hormone levels in DKD remains controversial. Many recent studies have demonstrated that women with T2DM are at greater risk for accelerated GFR decline in the absence of proteinuria [3839] which is consistent with our study. Moreover, the UK Prospective Diabetes Study (UKPDS) and Swedish National Diabetes Register cohort have shown that women were at increased risk for developing renal insufficiency while men were at increased risk for developing progressive albuminuria among T2DM patients with preserved renal function and normoalbuminuria [240]. Although the mechanism of higher incidence of accelerated GFR decline in females is not clear, animal studies using insulin resistant animals also support these findings. Renal failure occurs earlier in female than in male animals in obese Zucker rats [41] and estrogen has been associated with accelerated renal damage in female obese Zucker rats [42].
Only one-third of the patients who developed rapid renal function decline in our study had increased albuminuria at baseline; thus, 60% to 70% of patients who developed rapid renal function decline did not have increased albuminuria preceding renal function decline. In a cross-sectional analysis of National Health and Nutrition Examination Survey III, one-third of patients with T2DM with DKD did not exhibit albuminuria [3]. Similarly in the UKPDS, a prospective cohort study over 15 years, 51% of T2DM patients who developed renal impairment did not have preceding albuminuria [2]. Although albuminuria has traditionally been used as an indicator for development of DKD [4], recent evidences indicate that the presence of microalbuminuria may not always accompany renal structural abnormalities and does not always precede worsening of renal function [43]. It also has been recognized that the progression to microalbuminuria is not a unidirectional process but it may spontaneously regress to normoalbuminuria [7]. Recently, extensive studies in Joslin Clinic have demonstrated that predominant clinical feature of DKD is progressive renal function decline, not progressive albuminuria [7]. Progressive renal function decline is a unidirectional process that develops while patients have preserved renal function, which sometimes precedes the onset of microalbuminuria, and as it continues, it increases the risk of proteinuria.
In the current study, baseline HbA1c level predicted the development of rapid renal function decline in T2DM and preserved renal function. Many evidences indicate that the risk of a rapid decline of glomerular function increases with higher HbA1c and hyperglycemia [44]. Similar finding was also noted in Atherosclerosis Risk in Communities (ARIC) study, where a positive association between HbA1c and CKD was observed in patients with T2DM, even in the absence of albuminuria [45]. In a prospective study in Taiwan, higher HbA1c at baseline was independently associated with rapid decline in eGFR [46].
The strength of this study includes the prospective design with ≥6 consecutive annual measurements of kidney function to accurately estimate annual eGFR decline. We confined the subjects to those with preserved renal function to assess predictive role of CP in development of early rapid renal function decline, allowing us to find early detectable risk factors for the development and progression of DKD. Also, our cohort consists of a large number of participants from a homogeneous population and the follow-up period was over 6 years. This is the first study to demonstrate association between CP at baseline and early rapid renal function decline in patients with T2DM and preserved baseline renal function.
The present study has some limitations. First, because our cohort comprises of Korean patients with T2DM who were followed at tertiary-level, university-affiliated hospitals, our results may not represent general T2DM populations. Second, there was no direct measurement of GFR but we employed CKD-EPI equations, which have been widely used in many studies. It is established that eGFR at higher levels is associated with greater variability, which could lead to misclassification of hyperfiltration and normofiltration, and may bias our study results. However, we have measured serial values over time to identify the rate of decline in eGFR that was approximated using linear slopes, and the use of such slopes likely smoothed out variability in individual GFR estimates and measurements. Lastly, there may have been inter- and intra-observer variability in measurement of IMT as it was performed by multiple observers. To minimize inter-observer variability, workshops were conducted for ultrasound observers from all participating institutions before initiation of the study and then annually thereafter during the entire study period.
In conclusion, our study demonstrated that the presence of CP, a marker of atherosclerosis, predicts rapid renal function decline in patients with T2DM and preserved renal function independent of established risk factors. Close monitoring of renal function and implementation of early intensive treatment are warranted in patients with T2DM and CP. The impact of atherosclerosis on rapid renal function decline needs to be further clarified in future studies.
 XML Download