

 PDF
PDF ePub
ePub Citation
 Print
Print


INTRODUCTION
World Health Organization defines obesity as body mass index (BMI) of ≥30 kg/m2, and around 13% of the world population were reported to be obese in 2016. Prevalence of obesity has been steadily increasing and has tripled in the past 30 years [1]. In Korea, obesity is defined as BMI of ≥25 kg/m2, and according to the Korea National Health and Nutrition Examination Survey (KNHANES), the prevalence of obesity in adults (≥19 years old) has increased from 25.8% in 1998 to 31.5% in 2014 [2]. Obesity is a known risk factor for multiple diseases including cardiovascular diseases (CVD), diabetes, stroke, and cancer [3456], and approximately 4.8% of worldwide mortalities are reported to be associated with obesity [7]. Considering the increasing prevalence of obesity and its clinical significance, an accurate diagnosis of obesity is crucial.
Accurate measurement of body fat can assist with the diagnosis of obesity, and multiple tools including computed tomography (CT), magnetic resonance imaging, dual-energy X-ray absorptiometry, and positron emission tomography-CT can be used [8]. However, these tools have several drawbacks, including high medical costs and clinically limited usage. Therefore, indirect measurement indices are often used to diagnose obesity, and BMI has been one of the most frequently used indices of obesity due to its convenience. However, BMI is not an effective tool for distinguishing body fat and muscle mass, and the distribution of body fat mass cannot be estimated using BMI [9]. As a result, BMI has its limitations in predicting the risk of CVD, stroke, and death [101112]. In order to overcome these limitations, a new measure called A Body Shape Index (ABSI)—utilizing the waist circumference (WC), height, and weight—has recently been introduced [13]. A recent meta-analysis reported an association between ABSI and hypertension, diabetes, CVD, and death; more specifically, ABSI showed superiority in predicting deaths in contrast to BMI or WC [14]. However, ABSI has limitations in its applicability in that the scaling exponents to calculate ABSI are estimated to differ across countries; when ABSI was directly used for logistic estimation, its coefficients were inflated beyond any reasonable interpretation [15]. The use of the z-score of the log-transformed ABSI (LBSIZ) [15], an improved version of ABSI, has been suggested to overcome the above limitations, as well as to determine the value of LBSIZ specific to the Korean population [16]. LBSIZ has been shown to predict CVD in a population-based cohort study [16]. However, there are very few studies that have applied LBSIZ to predict CVD in the general population until now.
This study aimed to examine the association of CVD risk with LBSIZ, in comparison to that of WC and BMI, in a Korean population. We hypothesize that LBSIZ will show a greater association with CVD risk in the Korean population than WC and BMI.
METHODS
Study population
Data were collected from the KNHANES VI to V conducted from 2007 to 2012. Subjects with ≤20 years of age, cancer, renal failure, <60 mL/min/1.73 m2 of estimated glomerular filtration rate, and liver cirrhosis were excluded from the analysis. A total of 31,227 out of 50,405 subjects were included in this study (Supplementary Fig. 1).
Clinical and laboratory measurements
WC was measured with a tape measure at the midpoint between the lowest border of the rib cage and the upper lateral border of the iliac crest at the end of normal expiration. Blood pressure (BP) was measured three times in a seated position with ≥5 minutes of resting period, and the mean value was used in the analysis. After an 8-hour overnight fasting, glucose levels, high density lipoprotein cholesterol (HDL-C), and triglyceride (TG) levels were measured by enzymatic method (ADVIA 1650 in 2007, Siemens, Munich, Germany; and Hitachi Automatic Analyzer 7600 from 2008 to 2012 Hitachi, Tokyo, Japan) [1718]. Presence of CVD was assessed through a structured questionnaire, and subjects with one or more conditions of angina pectoris, myocardial infarction, coronary heart disease, or cerebrovascular disease were considered to have CVD.
Measurement of LBSIZ
As a measure of obesity, we calculated LBSIZ using two steps: in the first step, we calculated the log-transformed ABSI (LBSI) using the equation: log [WC/(exp−2.69×weight0.73×height−1.06)], where the scaling exponents −2.69, 0.73, and −1.06 were estimated from a log-log regression of WC for both weight and height using representative Korean data [15]. In the second step, we calculated LBSIZ using the equation: [LBSI-(LBSI mean)]/(LBSI standard deviation) where LBSI mean is −0.02 and standard deviation is 0.06. A detailed explanation and a supplementary excel file for calculations are provided in previous studies [1516].
Statistical analysis
Summary statistics are provided as mean±standard deviation or prevalence (%), based on the presence of CVD. Differences between groups were assessed with independent samples t-test for continuous variables and with Pearson's chi-square test for categorical variables. Furthermore, overall distributions for each obesity index were provided, and the correlation between obesity indices was tested. Using a receiver operating characteristic (ROC) curve, the association between CVD and each of the obesity indices was analyzed. De Long's test was used to statistically confirm which of the obesity indices were significantly superior. The cut-off values of each obesity parameter were estimated by the highest score of Youden index in the area with sensitivity and specificity >50%, and the corresponding odds ratios (OR) were determined via multivariate logistic regression analysis. In addition, the OR for CVD according to continuous values of LBSIZ was analyzed using restricted cubic spline regression plots with five knots. Analyses were performed using SPSS software version 24.0 (IBM Co., Armonk, NY, USA) and the statistical program R (R version 3.1.0, 2014, www.r-project.org). A P value of 0.05 was considered statistically significant.
Ethics statement
The study protocol was approved by the Institutional Review Board of the Korean Centre for Disease Control (2007-02CON-04-P, 2008-04EXP-01-C, 2009-01CON-03-2C, 2010-02CON21-C) and Hallym University Kangnam Sacred Heart Hospital (IRB No. HKS 2017-07-007). All participants volunteered and provided written informed consent prior to their enrolment. All participants' records were anonymized before being accessed by the authors.
RESULTS
Baseline characteristics
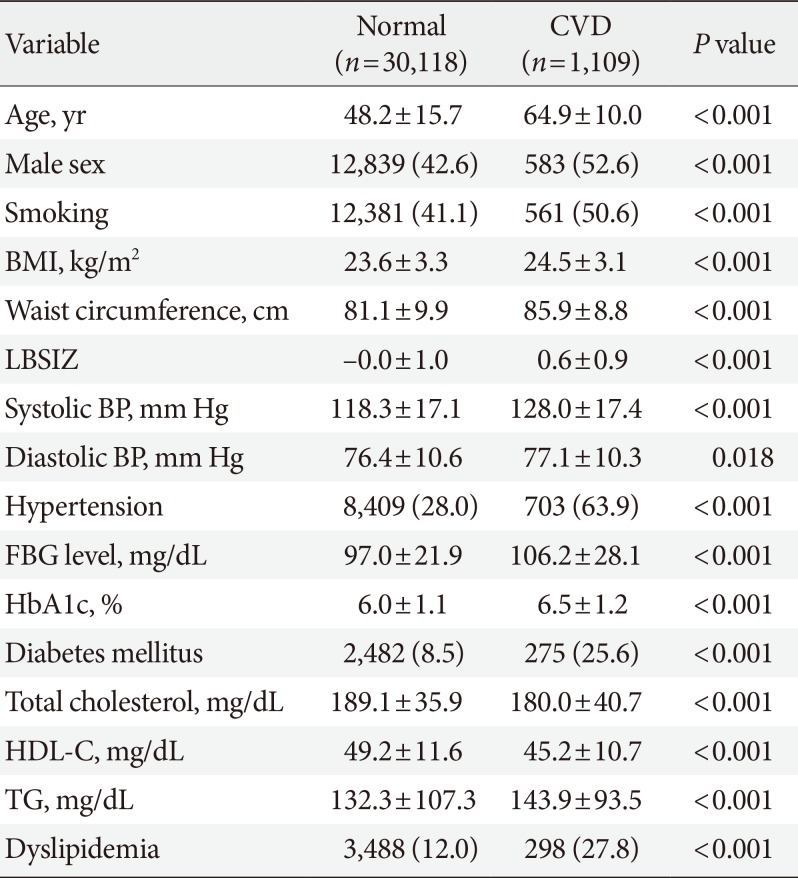
A total of 31,227 Korean healthy adults (13,422 men and 17,805 women) aged 20 to 103 years (mean age=48.8) were analyzed (Supplementary Fig. 1). The anthropometric, clinical, and biochemical characteristics are summarized in Table 1 according to CVD. There were 1,109 subjects (3.6%) with CVD, and among them, 528 subjects (1.7%) had stroke and 616 subjects (2.0%) had coronary artery disease. Compared to the normal group, CVD patient group had greater mean age and higher proportion of male subjects and smokers. CVD patient group exhibited higher BMI, WC, LBSIZ, BP, TG, fasting glucose, and glycosylated hemoglobin levels, and lower levels of HDL-C. Furthermore, the CVD patient group exhibited higher prevalence of hypertension and dyslipidemia.
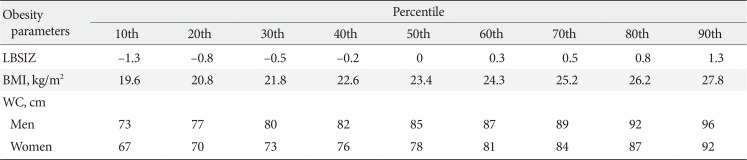
The distributions of obesity parameters are summarized in Table 2. LBSIZ showed a positive correlation with WC (Pearson correlation, 0.507; P<0.001) but a weak positive correlation with BMI (Pearson correlation, 0.023; P<0.001).
Association between CVD and obesity parameters
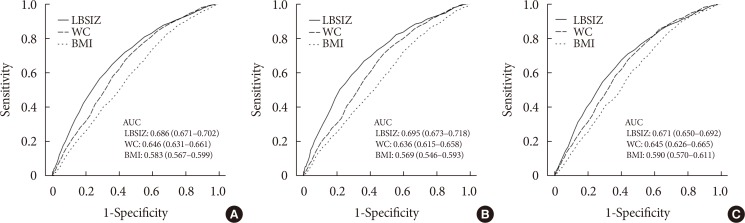
Fig. 1 shows the ROC curves for CVD, stroke, and coronary artery disease according to the three obesity parameters. The area under the curve (AUC) for CVD was 0.686 (95% confidence interval [CI], 0.671 to 0.702) for LBSIZ, 0.646 (95% CI, 0.631 to 0.661) for WC, and 0.583 (95% CI, 0.567 to 0.599) for BMI. Stroke and coronary artery disease also showed similar outcomes.
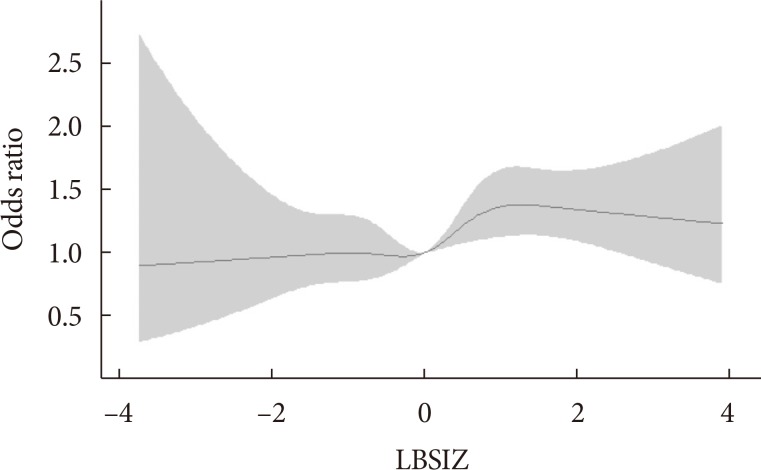
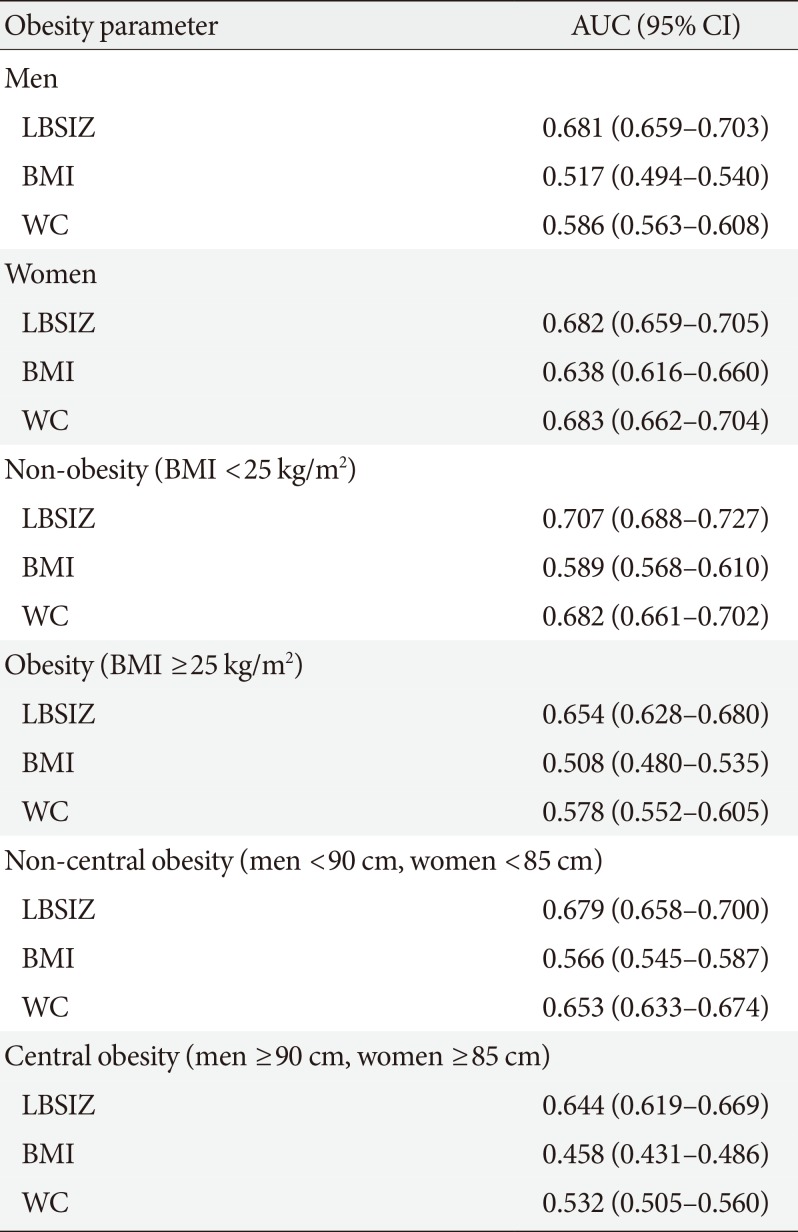
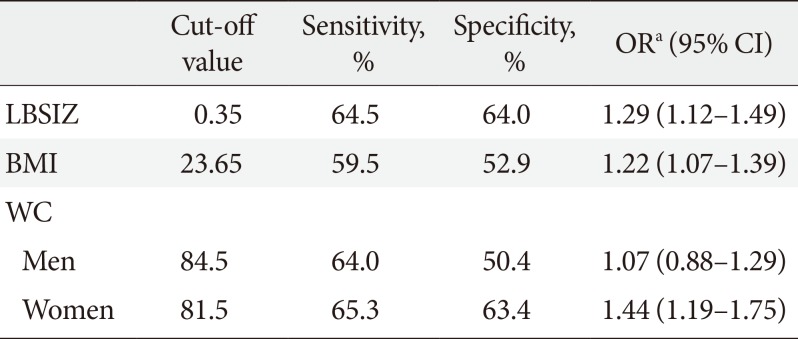
The AUC of LBSIZ was significantly higher than that of WC (P<0.001) and BMI (P<0.001). Table 3 shows the AUC of each obesity parameter by sex and obesity status. WC showed higher AUC than BMI regardless of sex and obesity status. Although WC showed a similar AUC to LBSIZ in women (P=0.93), the same was not observed in men. In comparison with WC, LBISZ showed significantly higher AUC in men (P<0.001). In the subgroup analysis by obesity status, BMI, and WC showed a severe decline in AUC for obesity or central obesity groups compared to the normal group, whereas LBSIZ showed only a modest decline (Table 3). Table 4 shows the cut-off values for each obesity parameter and its corresponding ORs. The cut-off value for LBSIZ was 0.35 (65th percentile: sensitivity, 64.5%; specificity, 64%) and its corresponding multivariate OR with adjustment for age, sex, smoking, hypertension, diabetes mellitus, and dyslipidemia was 1.29 (95% CI, 1.12 to 1.49). Under restricted cubic spline regression, LBSIZ demonstrated that OR started to increase past the median value (Fig. 2).
DISCUSSION
In this study, we investigated the relationship between CVD and LBSIZ, BMI, and WC using a representative sample. LBSIZ demonstrated a superior relationship with CVD than BMI or WC.
There is heterogeneity among previous studies assessing the relationship between BMI and CVD [101112]. This heterogeneity might be due to the limitations in defining obesity based on BMI [11920212223242526]. BMI cannot accurately distinguish fat, bone, and muscle mass; therefore, it cannot effectively estimate the total body fat mass [19]. Even if different subjects have the same BMI, its clinical significance may be heterogeneous based on their age considering that aging humans exhibit reduced muscle mass and increased body fat [2021]. For example, a patient with excessive visceral fat and insufficient muscle mass may have high CVD risk despite having a normal BMI value [22]. Moreover, the metabolic effects of fat can change based on the location. More specifically, while visceral fat is associated with type 2 diabetes mellitus and CVD [2324], subcutaneous fat demonstrated beneficial effects in terms of metabolism [2526]. Based on these limitations of BMI, multiple studies have been investigating other obesity indices [2728]. Among them, WC showed stronger association with visceral adiposity, metabolic risk, and increased morbidity and mortality [293031], and as a result, WC has been used to define metabolic syndrome instead of BMI [32]. However, there is insufficient data regarding the appropriate WC to define obesity based on different age and sex of subjects [2029]. Consequently, we observed heterogeneity in the association between WC and CVD depending on sex.
Krakauer and Krakauer [13] introduced a new obesity index called ABSI, based on WC, weight, and height, using NHANES data in the United States. ABSI provided more effective prediction of premature mortality in contrast to BMI or WC [1333]. Moreover, it has been suggested as an effective prognostic factor of CVD and all-cause mortality [3435]. Nevertheless, ABSI is an equation deduced from the data collected from American population, and thus, there are limitations in applying the equation to other ethnicities. Furthermore, due to the skewness of the value and lack of the cut-off value to define obesity, there are difficulties in clinical application of ABSI [15]. Hence, we suggested LBSIZ—an improved version of ABSI—that can be used regardless of subjects' ethnicity and sex [15]. However, due to its complex nature, we have provided an additional equation that can be utilized in the Korean population [16]. In this study, we applied this equation to a representative sample and confirmed that the relationship between CVD and LBSIZ is stronger than that between CVD and BMI or WC. Furthermore, while WC showed large differences in AUC depending on sex, LBSIZ showed no sex-based differences. Therefore, LBSIZ could be used as a supplemental parameter to overcome the heterogeneity of WC according to sex. Moreover, the profound AUC decrease seen in BMI and WC among obesity groups means LBISZ could be a useful parameter for CVD risk assessment in those people.
Under restricted cubic spline regression plots, no significant increase in the risk of CVD was observed until the median LBSIZ (LBSIZ=0), while OR started to increase past the median value. This result supports the estimated cut-off value (0.35; 65th percentile) can effectively distinguish the group of subjects with high CVD risk and may be used as a clinically significant standard.
Despite our findings, there are a few limitations to this study. First, this was a cross-sectional study, and therefore, the causal relationship between obesity and CVD cannot be determined. Therefore, prospective studies should be performed to address this issue. Second, this study utilized a representative Korean population, and additional studies should be performed in other ethnicities to generalize our findings. Third, the presence of CVD was not based on a physician diagnosis. Lastly, there was no data available regarding mortality and fatal CVD events, and therefore, relevant analyses could not be performed.
In conclusion, we confirmed there was a strong association between LBSIZ and CVD, which was superior to the associations between CVD and BMI or WC. These outcomes would be helpful during CVD risk assessment in clinical settings, especially with the cut-off value of LBSIZ suggested in this study. Nonetheless, in order to validate the role of LBSIZ with stronger evidence, additional larger-scale prospective studies should be performed.
 XML Download