

 PDF
PDF ePub
ePub Citation
 Print
Print


INTRODUCTION
Childhood obesity is a serious health problem worldwide. The prevalence of obesity among United States children and adolescents was 17% in 2011 to 2014 [1]. This is alarming because obesity has deleterious effects on almost every system in the body and childhood obesity tracks strongly into adulthood [2]. Moreover, obesity is an important risk factor for many diseases, such as diabetes, cardiovascular disease, cancers, and obstructive sleep apnea, in adults [3]. Therefore, it is urgent to identify modifiable risk factors for the prevention of obesity, which is important in reducing the risk of chronic disease risk factors later in life.
Recently, accumulating evidence suggests that environmental endocrine disrupting chemicals, including bisphenol A (BPA), may play an important role in the epidemic of obesity [24]. BPA is a synthetic chemical used in canned goods, plastic containers for food and beverage, dental sealants, and thermal paper [5]. The wide use of BPA results in an almost ubiquitous exposure in human populations [4]. Recent studies reported the association of BPA with obesity, diabetes, and cardiovascular disease [6]. In addition, BPA has adverse effects on thyroid function, and neurodevelopment [6]. Since 2010, Europe and Canada have prohibited the use of BPA in plastic food containers, especially in baby products because of the concern for its deleterious health effects [78]. The U.S. Food and Drug Administration also documented that baby bottles and sippy cups could no longer contain BPA in 2012 [9]. Subsequently, BPA-free products began to flood the market, with bisphenol F (BPF) and bisphenol S (BPS) used as a substitute for BPA [10]. Currently BPF and BPS are widely used in the manufacture of plastics, epoxy resins, coatings for various applications, such as liners, adhesives, and food packaging, thermal paper, baby bottles, and personal care products including makeup, toothpaste, and body wash [1011]. However, the health effects of BPF and BPS are unclear. BPF and BPS have similar chemical structures to BPA and have been suggested to be endocrine disrupting chemicals as observed in in vitro and in vivo studies [10]. Experimental studies found that both BPF and BPS are involved in the processes of preadipocytes differentiation and lipid accumulation [1213]. However, studies on health effects of BPF and BPS exposures in children and adolescents are lacking.
In this study, we aimed to examine the associations of BPA, BPF, and BPS exposure with obesity in children and adolescents using data from the U.S. National Health and Nutrition Examination Survey (NHANES), a nationwide, population-based, cross-sectional study.
METHODS
Study population
NHANES is a nationally representative survey of the non-institutionalized United States population, administered by the National Center for Health Statistics at the Centers for Disease Control and Prevention (CDC). NHANES collects data on demographics, socioeconomic status, diet, lifestyle, and medical conditions in addition to specimens for laboratory tests. NHANES data are publicly released in 2-year cycles. A detailed description of NHANES are available elsewhere [14]. NHANES has been approved (Protocol #2011-17) by the National Center for Health Statistics Ethics Review Board. Written informed consent was obtained from all participants.
For this analysis, we used data from NHANES 2013 to 2014, because this was the first and only cycle where urinary levels of BPF and BPS were measured. The study population consisted of children and adolescent aged 6 to 17 years, because bisphenols were measured only in children 6 years and older. We finally identified 745 children and adolescent (mean age 11.1±3.4; 49.8% boys) who had available data on body mass index (BMI) and urinary concentrations of BPA, BPF, and BPS. Fifteen participants did not have data on waist or height; therefore, analyses for abdominal obesity were conducted in 730 children and adolescents (49.8% boys).
Exposure assessment
Urinary concentrations of BPA, BPF, and BPS were measured using on-line solid phase extraction coupled to high performance liquid chromatography and tandem mass spectrometry, at the Division of Laboratory Sciences, National Center for Environmental Health, CDC. The lower limits of detection (LLOD) reported by NHANES were 0.2 ng/mL for BPA, 0.2 ng/mL for BPF, and 0.1 ng/mL for BPS. For those concentrations below the LLOD (1.74% for BPA, 38.79% for BPF, and 10.87% for BPS), NHANES staff assigned a value of the LLOD divided by the square root of 2. To account for urine dilution, levels of all three target analytes were adjusted for urinary creatinine levels in all the analysis models in this study, as NHANES recommended [15].
Outcome ascertainment
Trained health technicians assessed weight, waist, and height according to the NHANES Anthropometry Procedures Manual [14]. BMI was calculated as weight in kilograms divided by the square of height in meters. Obesity was defined as a BMI at or above the sex-specific 95th percentile based on the 2000 CDC sex-specific BMI-for-age growth charts for the United States [16]. Abdominal obesity was defined as waist-to-height ratio ≥0.5 [17].
Covariates
Information on age, sex, race/ethnicity, and family income was collected using questionnaires. Proxy respondents provided this information for children who were under 16 years. Race/ethnicity was categorized into Hispanic, non-Hispanic white, non-Hispanic black, and other. Family income-to-poverty ratio was categorized as ≤1.30, 1.31 to 3.50, and >3.50 [14]. Children aged 12 years or older and proxy respondents for children younger than 11 years answered the question about TV watching. We used daily hours of TV watching to assess sedentary behavioral risk (with a cut point of ≥2 hours/day) [18].
Dietary information was collected by 24-hour dietary recall interview. Interviews of children aged 6 to 8 years were conducted with a proxy and the child present to assist in reporting intake information. Interviews of children aged 9 to 11 years were conducted with the child and the assistance of a proxy familiar with the child's intake. Participants 12 years or older answered for themselves. Total energy intake was calculated using the United States Department of Agriculture Automated Multiple-Pass Method. The 2010 Healthy Eating Index (HEI-2010) score was calculated to represent diet quality, with a higher score indicating a better diet [19].
Statistical analysis
NHANES used a complex, multistage probability sampling design to represent the civilian non-institutionalized United States population. Weighted estimates were applied to account for the differential probability of selection, non-response adjustment, and adjustment to independent population controls. The Taylor series linearization method was used for variance estimation to account for stratification and clustering, following the NHANES Analytic Guidelines [14].
We used chi-square tests and analysis of variance to compare categorical variables and continuous variables, respectively. We log-transformed BPA, BPF, and BPS concentrations before the analyses because they were in skewed distribution. Pearson correlations with sample weights were used to compute correlation coefficients among log-transformed BPA, BPF, and BPS levels. Logistic regression models were used to estimate the odds ratio (OR) of general or abdominal obesity according to quartiles of urinary BPA, BPF, and BPS concentrations. We adjusted for age, sex, and urinary creatinine levels in Model 1. Race/ethnicity, family income-to-poverty ratios, TV watching, total energy intake, and HEI-2010 score were added in Model 2. We considered Model 2 as the main model of this study. BPA, BPF, and BPS levels were mutually adjusted in Model 3. Categorical covariates included a category for missing data if necessary. To test linear trends across categories of BPA, BPF, or BPS concentrations, we assigned the median values for each category and fitted the log-transformed median values as continuous variable in models.
We evaluated effect modification by sex (boy, girl) and race/ethnicity (white, non-white) by conducting stratified analyses. P values for heterogeneity were derived from the multiplicative interaction term coefficient (exposure variable×effect modifier variable) added to the main effects multivariable model.
All statistical analyses were performed with survey modules of SAS software version 9.4 (SAS Institute, Cary, NC, USA). P<0.05 was considered statistically significant.
RESULTS
In this study, the weighted prevalence of general obesity was 21.0% (95% confidence interval [CI], 15.5% to 26.4%), and 35% (95% CI, 28.2% to 41.9%) for abdominal obesity. The median urinary concentration was 1.2 ng/mL (interquartile range [IQR], 0.6 to 2.4 ng/mL) for BPA, 0.3 ng/mL (IQR, 0.1 to 0.9 ng/mL) for BPF, and 0.3 ng/mL (IQR, 0.1 to 0.7 ng/mL) for BPS. Individuals with higher levels of BPA and BPS were more likely to be non-Hispanic blacks (Supplementary Tables 1 and 2). Individuals with higher levels of BPF were more likely to be non-Hispanic whites (Supplementary Table 3). Urinary concentrations of BPA, BPF, and BPS according to population characteristics are present in Supplementary Table 4. The three bisphenols were moderately correlated with each other; the correlation coefficients were 0.25 between BPA and BPF (P<0.001), 0.33 between BPA and BPS (P<0.001), and 0.13 between BPF and BPS (P<0.001).
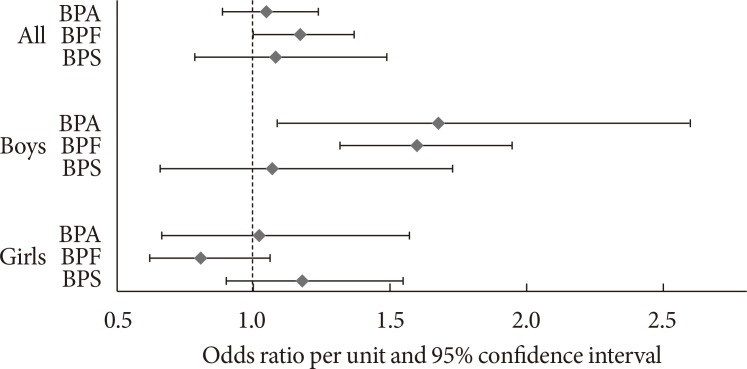
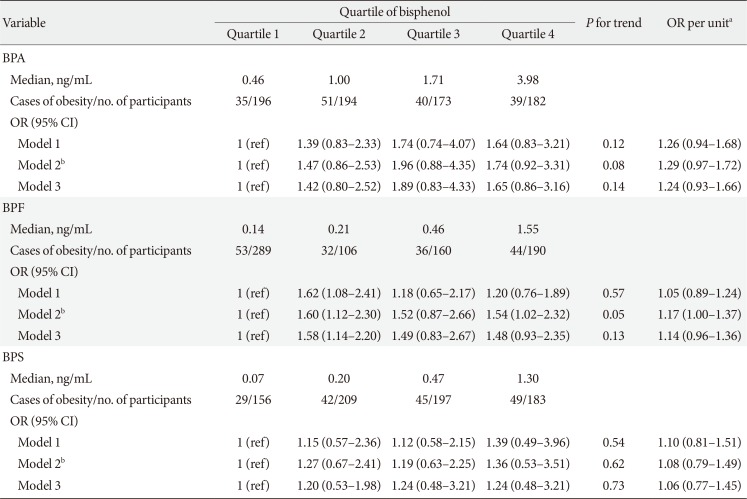
We observed a significant association of urinary concentrations of BPF, but not BPA or BPS, with general obesity (Table 1). After adjustment for demographic, socioeconomic and lifestyle factors, total energy intake, overall diet quality as indicated by the HEI-2010 score, and urinary creatinine levels, the OR of general obesity comparing the highest with lowest quartile was 1.74 (95% CI, 0.92 to 3.31) for BPA (P for trend=0.08), 1.54 (95% CI, 1.02 to 2.32) for BPF (P for trend=0.05), and 1.36 (95% CI, 0.53 to 3.51) for BPS (P for trend=0.62). The ORs of general obesity per unit increase in BPA, BPF, and BPS levels were 1.29 (95% CI, 0.97 to 1.72), 1.17 (95% CI, 1.00 to 1.37), 1.08 (95% CI, 0.79 to 1.49), respectively (Fig. 1). When we simultaneously included all bisphenols in the same multivariable model for mutual adjustment, the adjusted OR of general obesity comparing the highest with lowest quartile of each bisphenol was 1.65 (95% CI, 0.86 to 3.16) for BPA (P for trend=0.14), 1.48 (95% CI, 0.93 to 2.35) for BPF (P for trend=0.13), and 1.24 (95% CI, 0.48 to 3.21) for BPS (P for trend=0.73).
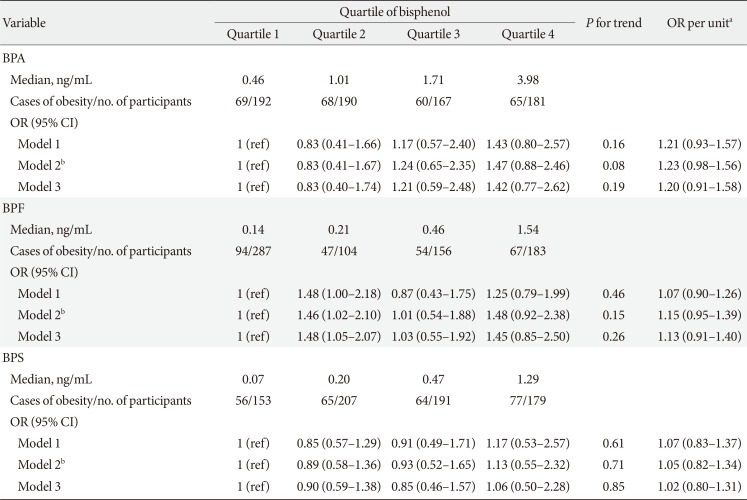
For abdominal obesity, the multivariable-adjusted OR of abdominal obesity comparing the highest with lowest quartile of urinary bisphenol levels was 1.47 (95% CI, 0.88 to 2.46; P for trend=0.08) for BPA, 1.48 (95% CI, 0.92 to 2.38; P for trend=0.15) for BPF, and 1.13 (95% CI, 0.55 to 2.32; P for trend=0.71) for BPS (Table 2).
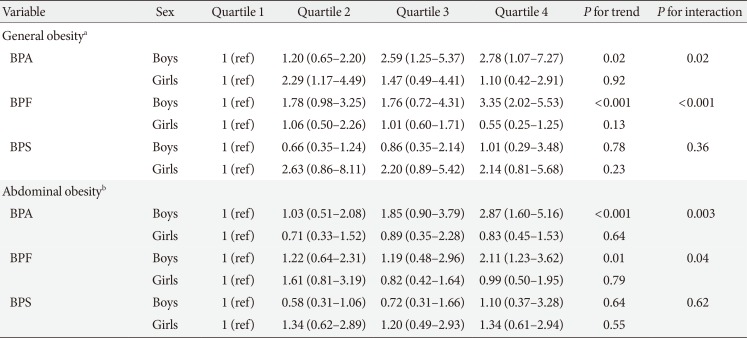
In stratified analyses, the associations of obesity with BPA and BPF levels were much stronger in boys than in girls (Table 3). The multivariable-adjusted OR of general obesity comparing the highest with the lowest quartile of urinary BPA level was 2.78 (95% CI, 1.07 to 7.27) in boys (P for trend=0.02) and 1.10 (95% CI, 0.42 to 2.91) in girls (P for trend=0.92, P for interaction=0.02) (Table 3). For BPF, the corresponding OR was 3.35 (95% CI, 2.02 – 5.53) in boys (P for trend <0.001) and 0.55 (95% CI, 0.25 to 1.25) in girls (P for trend=0.13, P for interaction <0.001) (Table 3). The multivariable-adjusted OR of abdominal obesity comparing the highest with the lowest quartile of urinary BPA level was 2.87 (95% CI, 1.60 to 5.16) in boys (P for trend <0.001) and 0.83 (95% CI, 0.45 to 1.53) in girls (P for trend=0.64, P for interaction=0.003) (Table 3). For BPF, the corresponding OR was 2.11 (95% CI, 1.23 to 3.62) in boys (P for trend=0.01) and 0.99 (95% CI, 0.50 to 1.95) in girls (P for trend=0.79, P for interaction=0.04) (Table 3). No significant interaction effects by sex were found for BPS (P for interaction=0.36 for general obesity; P for interaction=0.62 for abdominal obesity) (Table 3). There was no significant effect modification by age (Supplementary Tables 5 and 6). The ORs of general obesity per unit increase in concentrations of BPA, BPF, and BPS levels in boys and girls were shown in Fig. 1.
We did not observe significant effect modification by race/ethnicity for the relation between bisphenol exposure and general obesity (Supplementary Table 7). However, the associations of abdominal obesity with BPF levels were much stronger in non-Whites than in Whites (Supplementary Table 8). The multivariable-adjusted OR of abdominal obesity comparing the highest with the lowest quartile of urinary BPS level was 1.88 (95% CI, 1.07 to 3.30) in non-Whites (P for trend=0.01) and 0.45 (95% CI, 0.11 to 1.91) in Whites (P for trend=0.36, P for interaction=0.01).
DISCUSSION
In this study, we found positive associations of urinary concentrations of BPF with general and abdominal obesity in United States children and adolescents, especially in boys. In addition, significant associations of urinary BPA levels with general and abdominal obesity were found in boys. However, we did not observe significant associations between BPS exposure at current levels and either general obesity or abdominal obesity.
To our knowledge, this is the first study to evaluate the link between BPF and BPS with obesity in children and adolescents. Our previous study suggested that at current population exposure levels, BPA, but not BPF or BPS, was significantly associated with an increased odds of obesity in United States adults [20]. This may be due to lower dose and shorter duration of BPF and BPS exposure in adults, compared with BPA exposure, because BPF and BPS have only been used in recent years as BPA substitutes. Since children and adolescents are rapidly growing, they may be more susceptible to environmental chemicals than adults [21] and we hypothesized that this would amplify the adverse effects of exposure to BPA and BPA substitutes. In addition, many children may have been exposed to BPA, BPF, and BPS since birth, resulting in similar duration of exposure to BPF and BPS, as compared to BPA [9]. In the present study, we also observed positive associations of BPA, BPF, and BPS with BMI and waist-to-height ratio in children and adolescents, although the associations were generally not statistically significant (data not shown).
Laboratory studies provide strong evidence to support our findings that BPF has obesity-promoting effects similar to BPA [10]. BPF was found to be involved in multiple molecular pathways to obesity. First, BPF has similar estrogenic activities to BPA, such as altering adiponectin production or binding to nuclear estrogen receptors [102223]. BPF was also found to interfere with hormonal regulation by deregulating messenger RNA/long non-coding RNA and micro RNA in a human primary adipocyte model [24]. Moreover, BPF exhibited adverse effects on the hypothalamic-pituitary-gonadal axis, which is crucial for energy storage and consumption [2526]. Second, BPF could promote differentiation of preadipocytes and increase lipid accumulation by affecting the peroxisome proliferator-activated receptor gamma signaling pathway [1227]. Third, BPF was observed to affect adiponectin production and secretion [28].
We observed a positive (although non-significant) association between urinary BPA concentrations and higher odds of general and abdominal obesity in children and adolescents. Similar results were reported in previous studies [18293031]. The non-significant association, in the present study, might because the lower BPA exposure levels compared to previous NHANES reports [18]. Such a declining trend in BPA levels in the United States population is likely related to the policy banning the use of BPA in certain products [932]. The relatively small sample size might be another contributing factor for the non-significant finding in this study. Similarly, there was a positive, but not statistically significant, association between BPS exposure and obesity in this study. Previous in vivo studies and in vitro studies suggested that BPS has similar obesogenic activities to BPA and BPF [1013]. It is possible that the null findings for BPS are due to the relatively low exposure levels and small sample size in this study.
Interestingly, we observed associations of general and abdominal obesity with urinary levels of both BPA and BPF in boys but not in girls. This is consistent with some [1830], although not all [2933], previous studies on BPA exposure and obesity. We hypothesized that sex differences may result from differences in diets of boys and girls, with some diets having more bisphenol-containing packaging than others do. However when we tested this hypothesis, we did not find significant differences of urinary levels of BPA and BPF between boys and girls. It is biologically plausible that sex differences in hormone profiles may lead to different susceptibilities to adverse health outcomes with BPA and BPF exposure [103334]. BPA is a selective estrogen receptor modulator, which means it acts differently in different tissues [35]. A previous study suggested that BPA might act as an estrogenic agonist in males who have low endogenous estrogen levels, and conversely act as an antagonist in females who have higher endogenous estrogen levels [36]. Sex differences in estrogenic activity were also observed for BPF in an animal study [25]. Further investigation is warranted to clarify the health effects of BPA and BPF for each sex.
The current study could be important, being the first report in humans on the association of BPA substitutes, BPF and BPS, with general and abdominal obesity in children and adolescents. More epidemiological and toxicological studies are needed to assess whether and how human exposures to BPA substitutes increase the risk of obesity in children and adolescents. In addition, the positive association between BPA exposure and obesity in children suggested that BPA, even at the current relatively low level, remains to be a concern of health. Continuous monitoring the exposures of BPA and BPA substitutes and measures to reduce human exposure, such as decreasing the use of plastic products, are needed.
A major strength of our study is the use of nationally representative data from NHANES that allowed us to generalize our findings to a broader population. The abundant data from NHANES, including comprehensive information about demographic, socioeconomic, body measure, and lifestyle factors, provided the opportunity to adjust for a variety of risk factors for obesity. However, there were several limitations. First, due to the cross-sectional nature of NHANES, we could not rule out the possibility of reverse causation. Second, NHANES used spot urine samples to measure bisphenol concentrations, because of the challenges to collect 24-hour urine samples in such a large survey study. Although within-person and between person variability exists, previous studies have demonstrated that urinary concentrations of BPA derived from one spot sample may adequately reflect the average exposure of a population to BPA when specimens are collected from a sufficiently large population, with random meal ingestion and bladder emptying times [323738]. Another study detecting the temporal variability of BPA found that one measurement of BPA has moderate sensitivity for predicting multiply measured BPA levels [39]. Moreover, similar assumptions have been made in previous cross-sectional studies [18], which have been confirmed by longitudinal studies [40]. Third, the possibility of residual confounding and unmeasured confounding cannot be ruled out, although we have adjusted for a number of established risk factors for childhood obesity.
In a nationally representative population, BPF exposure was significantly and positively associated with general obesity in United States children and adolescents, especially in boys. BPA exposure was significantly associated with general and abdominal obesity in boys, but not in girls. There was no significant association of BPS at current exposure levels with obesity. Considering the increasing use of BPF and BPS as BPA substitutes, more research is needed to replicate our findings and further investigate their health effects in humans.
 XML Download