

 PDF
PDF ePub
ePub Citation
 Print
Print


INTRODUCTION
Hepatitis C virus (HCV) is a major cause of chronic liver disease, including cirrhosis and liver cancer. The World Health Organization has reported that 170 million people are chronically infected with HCV globally [1]. The highest prevalence of HCV infection worldwide is in Egypt (15%) where 90% of HCV infection is genotype 4 [2].
Patients with chronic hepatitis C virus (ChHCV) infection have significantly increased prevalence of type 2 diabetes mellitus (T2DM), independent of liver disease stage compared with controls or hepatitis B virus (HBV)-infected patients. T2DM is a common comorbid condition in approximately one-third of individuals with ChHCV infection [3].
However, the mechanism by which the increased risk of diabetes occurs is not clear. HCV infection can trigger autoimmune reactions against pancreatic β-cells in genetically susceptible subjects leading to direct destruction of β-cells; thereby, causing type 1 diabetes [4]; or the mechanism may be related to increased insulin resistance (IR) [5].
Patients with ChHCV infection have significantly increased prevalence of T2DM, independent of liver disease stage compared with controls or HBV-infected patients. T2DM is a common comorbid condition in approximately one-thirds of HCV-infected individuals, possibly due to a direct or indirect effect of the virus on insulin sensitivity [5].
Studies show that HCV impairs glucose metabolism directly via viral proteins and indirectly by altering proinflammatory cytokine levels. The direct effect is due to HCV core protein that prevents the insulin receptor substrate-1 (IRS-1) association with its insulin receptor by increasing IRS-1 degradation through upregulation of serine/threonine phosphorylation or increased activity of suppressor of cytokine signaling 3 (SOCS3) [678]. These direct actions on the insulin-signaling pathway impair downstream signalling and appropriate regulation of glucose metabolism [9]. An indirect effect of HCV on insulin sensitivity has also been suggested to be due to increased production of proinflammatory cytokines (interleukin 6 and tumor necrosis factor α) from sinusoidal liver cells that interferes with insulin-signaling pathways and leads to IR [101112].
The realistic possibility of moving to interferon-free therapies offers avoidance of the autoimmune-mediated hyperglycemic effects of interferon. Moreover, these therapies offer an oral, well-tolerated treatment regimen of shorter duration, helping to attain a greater sustained virological response (SVR) after 12 weeks and may help to reduce the development of IR [13].
The aim of this work was to evaluate the factors associated with improved glycemic control by direct-acting antiviral agents (DAAs) in Egyptian T2DM patients with ChHCV genotype 4 infection.
METHODS
This study was conducted on 460 T2DM patients with ChHCV from among the outpatients of the Departments of Internal Medicine and Tropical Medicine of Menoufia University Hospital between February 2016 and December 2016. All patients had HCV genotype 4, which is the most common genotype in Egypt. The study protocol was approved by the Ethics Committee of the Menoufia University Faculty of Medicine, and the selected subjects gave prior consent to participate in the study.
All patients were subjected to detailed history taking including age, sex, body mass index (BMI), and duration and family history of T2DM. Four hundred patients received DAAs in the form of sofosbuvir+daclatasvir with or without ribavirin for 12 weeks, while the remaining 60 patients did not receive DAAs and served as a control group. Before starting DAA therapy, laboratory tests were carried out that included fasting plasma glucose (FPG), glycosylated hemoglobin (HbA1c), qualitative HCV RNA polymerase chain reaction test, liver enzymes, serum bilirubin, serum albumin, and the international normalized ratio. FPG, HbA1c, and body weight were repeated after 3 months. The severity of liver disease was determined by using the Child-Pugh classification. Only class A and class B patients were included. During the study period, all patients were advised to maintain their usual diet regimen and physical activity. For better evaluation of the improvement in glycemic control, we used a composite end-point given by the reduction of FPG (of a minimum of 20 mg/dL) or HbA1c (of a minimum of 0.5%).
Patients with SVR after 3 months (378 patients, 94.5%) were divided into two groups according to the end-point of glycemic control; that is, the improved glycemic control (IGC) group, which comprised 292 patients (77.2%), and the non-improved glycemic control (NIGC) group, which included 86 patients (22.8%).
Statistical methodology
Data was analysed using SPSS version 15 (SPSS Inc., Chicago, IL, USA). Quantitative data were presented in mean±standard deviation. Qualitative data were presented in frequency and percentage. To compare between groups, we used Student t-test and chi-square test. Multivariate logistic regression was used to adjust the confounding factors. Significance level for P≤0.05.
RESULTS
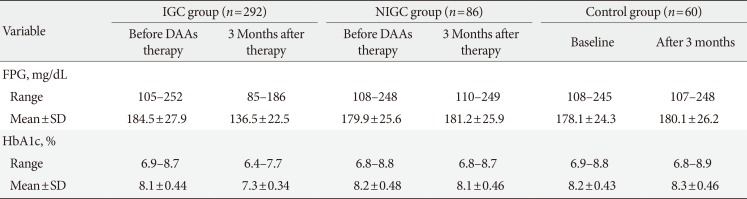
SVR after 3 months was obtained in 378 patients (94.5%). According to the above-mentioned criteria of improvement in glycemic control, 292 patients (77.2%) achieved improvement in glycemic control after 3 months of DAA therapy compared with pretreatment levels (IGC group); the remaining 86 patients (22.8%) and the control group (60 patients) did not achieve improvement in glycemic control during the period of study (Table 1).
In the IGC group, 78 patients (26.7%) needed to decrease the dose of antidiabetic treatment; 61 patients needed to decrease the insulin dose and 17 patients needed to decrease the gliclazide dose. None of the IGC patients needed to decrease the dose of metformin or dipeptidyl peptidase-4 (DPP4) inhibitor.
After 3 months of DAA therapy, the mean value of reduction of FPG in the IGC group was 49.1 mg/dL with a maximum reduction of 88 mg/dL (from 240 to 152 mg/dL) observed in one patient; the mean reduction of HbA1c was 0.8% with a maximum reduction of 1.1% (from 8.7% to 7.6%) observed in one patient (Table 1).
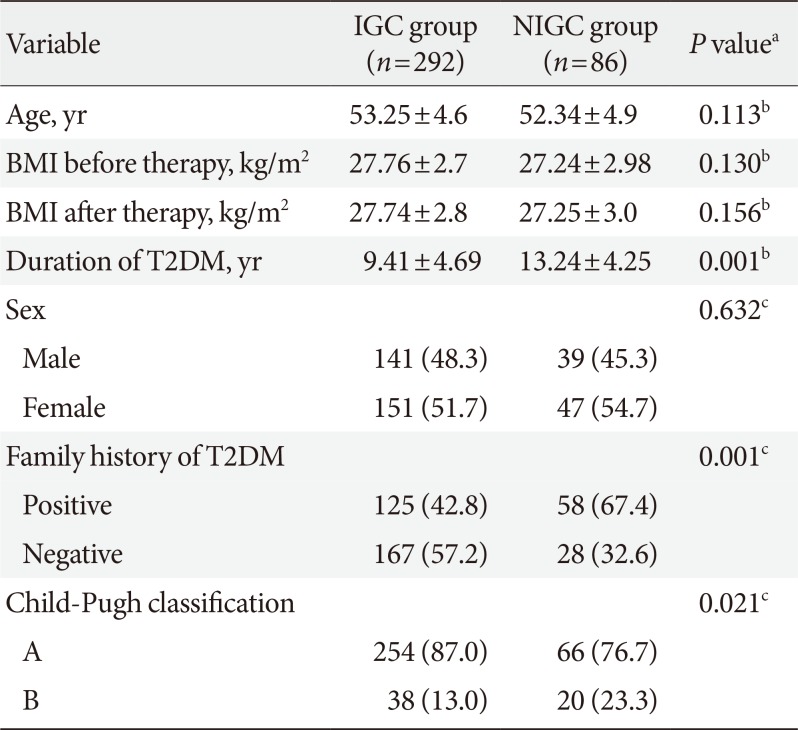
There were no significant differences between the IGC and NIGC groups regarding age, sex, and BMI (before and after therapy). However, the percentage of patients with positive family history of T2DM, longer T2DM duration and Child-Pugh class B was significantly higher in the NIGC group (Table 2).
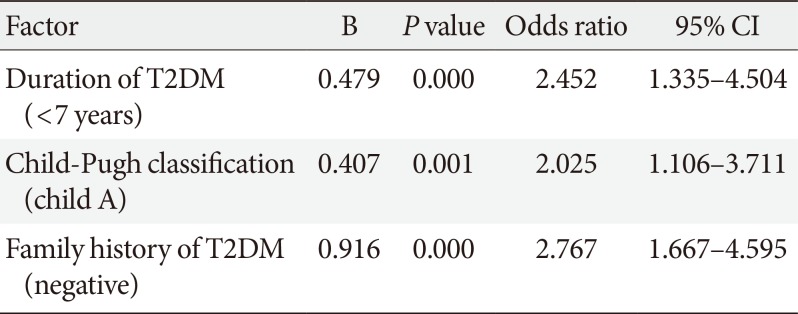
To adjust for confounding factors, multivariate logistic regression analysis was performed, and the results showed that the following factors had a significant influence on improved glycemic control: family history of T2DM, duration of T2DM, and severity of liver disease according to Child-Pugh classification (Table 3).
In the IGC group, no patients experienced hypoglycemia, but three patients experienced deterioration in diabetic retinopathy; all of them had a history of diabetic retinopathy before DAA therapy.
DISCUSSION
In the current study, 77.2% of SVR patients achieved improvement in glycemic control after 3 months of treatment. In the IGC group, 78 patients (26.7%) needed to decrease their dose of antidiabetic treatment.
The evidence for the effect of DAA therapy on T2DM is conflicting. One study suggested that the antiviral effects of danoprevir may decrease IR in patients with HCV genotype 1 [14]. Another study found that HCV suppression with DAA therapy produced a significant improvement in glycemic control regardless of genotype [15]. In contrast, a third study found that DAA therapy with sofosbuvir and ledipasvir led to the development of new-onset T2DM [16].
In the current study, the patients in the IGC group were on the following antidiabetic treatments: 251 patients on metformin, 56 on gliclazide, 101 on sitagliptin or linagliptin, and 153 on insulin. Some patients were on a combination therapy of two or three agents. In this group, 78 patients (26.7%) needed to decrease the dose of antidiabetic treatment (61 patients needed to decrease the insulin dose and 17 needed to decrease the gliclazide dose). Although the main side effect of sulfonylurea drugs such as gliclzide is hypoglycemia, none of IGC group experienced this because some patients on gliclazide had high HbA1c (>7%) at the start of antiviral treatment, so the decrease in plasma glucose did not lead to hypoglycemia. Moreover, gliclazide is metabolized in the liver, so improving the liver condition may lead to improvement in gliclazide metabolism and clearance. None of the IGC patients needed to decrease their metformin or DPP4 inhibitor doses, which may be expected as hypoglycemia rarely occurs with metformin and DPP4 inhibitors.
BMI was not an important factor in improving glycemic control with use of DAA treatment. One case with a significant improvement in diabetic control after successful HCV treatment with DAA therapy has been reported [17]. This improvement in insulin requirements and HbA1c persisted following viral clearance despite an increase in the patient's BMI.
The percentage of patients with positive family history of T2DM was significantly lower in the IGC group compared with the NIGC control group. In patients without family history of T2DM, the possibility of IR is likely due to HCV infection only, so the eradication of HCV infection helps to improve IR and glycemic control, unlike those with inherited IR. It might be useful to classify patients with hereditary IR or HCV-induced IR to define better the effect of HCV eradication on these distinct populations, but this is not always possible. Absence of family history of T2DM may help in this differentiation.
The duration of T2DM was significantly longer in the NIGC group compared with the IGC control group. Prolonged duration of T2DM may lead to more β-cell failure and so improvement in IR does not lead to marked improvement in glycemic control.
In the current study, 22.8% of SVR diabetic patients did not reach the end-point of glycemic improvement. This can be explained by three factors. First, the severity of liver disease may play an important role as the percentage of Child-Pugh class B patients was significantly higher in the NIGC group. The etiology of T2DM in HCV-infected individuals has been postulated to result from either hepatogenous T2DM resulting from advanced liver disease or classical T2DM due to virally mediated IR [18]. Second, HCV infection may affect glucose level by an autoimmune mechanism on β-cells and is not related to IR. Third, some of the patients in the NIGC group already had normal FPG and HbA1c.
Because all the patients in this study had HCV genotype 4, we cannot determine if the glycemic improvement with DAAs was genotype-related or not. Most genotypes of HCV increase IR and can induce T2DM. A significant correlation was found between genotype 1 or 4 infection and IR, both in the presence and absence of T2DM [19]. The association between HCV genotype and IR has also been investigated with one study revealing an SVR-induced reduction in IR in patients with HCV genotype 1 [20].
In the current study, the patients with normal baseline FPG and HbA1c did not experience hypoglycemia, which excluded the direct hypoglycemic effect of DAAs.
Although studying the microvascular complications of diabetes is outside the scope of this study, three patients showed deterioration in diabetic retinopathy in the IGC group. Although these patients had a history of diabetic retinopathy before DAA treatment, the question is why did the improvement of liver condition by DAAs lead to a deterioration of retinopathy? In an Egyptian study [21], retinopathy was higher in T2DM patients without HCV infection (36%) compared with ChHCV T2DM patients (18%). The low prevalence of diabetic retinopathy in patients with ChHCV may be related to liver disease-induced abnormalities protecting the cardio-vascular system from atherosclerosis (hypotension, coagulation defect, thrombocytopenia, and decreased lipoprotein(a)). Lipoprotein(a) competes with plasminogen for binding to fibrin and impairing fibrinolysis. High lipoprotein(a) is associated with the development and progression of diabetic retinopathy. These effects of ChHCV infection may decrease diabetes-induced hypercoagulation and premature atherosclerosis. Unlike nephropathy and neuropathy, diabetic retinopathy is not known to be one of the extrahepatic manifestations of HCV. The protective effect of HCV chronic liver disease on retinopathy makes the prevalence of retinopathy lower [21]. Therefore, improving the liver condition by virus eradication may lead to a deterioration of retinopathy in diabetic patients. However, detailed studies are required to clarify this.
In conclusion, diabetic patients receiving DAAs should be closely monitored for reduction of antidiabetic drugs especially insulin and insulin secretagogues to avoid hypoglycemic events. Improvement of glycemic control in HCV patients treated with DAAs is greater in patients without family history of T2DM, short duration of diabetes, and mild liver disease (Child-Pugh class A) but is not related to age, sex, and BMI. Prospective studies should be conducted to define better the effect of DAAs on IR of HCV suppression, to evaluate the long-term effects of DAAs on diabetes control, and to determine the sustained effects. In addition, studies are needed to detect the effect of improvement of liver condition after DAA therapy on the complications of T2DM, especially diabetic ret-inopathy.
 XML Download