

 PDF
PDF ePub
ePub Citation
 Print
Print


INTRODUCTION
Based on recent study results, the prevalence and progression of metabolic disease may depend on systemic fat distribution and localized fat deposition in major organs, rather than on obesity alone [12]. Excessive fat accumulation in the abdominal visceral area, liver, and muscle is thought to induce insulin resistance and to increase cardiometabolic risk. Pericardial fat has been associated with coronary and periaortic calcifications, and perivascular fat may contribute to the development of peripheral arterial disease. Renal sinus fat may exert toxic effects on renal function and hypertension. However, only a few studies focusing on how pancreatic fat affects the human body have been performed.
Several terms are used to describe fat accumulation in the pancreas [3]. Pancreatic lipomatosis refers to fatty replacement of the exocrine pancreas. Fatty pancreas is a general term for pancreatic fat accumulation. Pancreatic steatosis is defined as fat accumulation in the pancreatic islets or acinar cells [34]. In the present study, pancreatic steatosis is used to refer to fat accumulation in the pancreatic gland.
To date, no definite method for measuring pancreatic steatosis exists. In addition, whether pancreatic steatosis has a local or systemic effect is controversial. Regarding the local effect, studies regarding whether pancreatic steatosis is associated with β-cell dysfunction have been inconsistent. Heni et al. [5] showed that pancreatic triglyceride levels measured by magnetic resonance (MR) imaging were negatively associated with insulin secretion in healthy patients and those with impaired glucose tolerance or impaired fasting glucose levels. However, Begovatz et al. [6] found that pancreatic intralobular fat infiltration measured by MR imaging and proton MR spectroscopy was not associated with total insulin secretion, the adaptation index, or the insulinogenic index.
Conversely, few studies have evaluated the effects of pancreatic steatosis on systemic vascular complications. In a previous study [7], the association between pancreatic steatosis and subclinical atherosclerosis was investigated. Pancreatic steatosis was assessed using non-enhanced computed tomography (CT). Subclinical atherosclerosis was measured by carotid artery sonography. Pancreatic steatosis was associated with a higher prevalence of subclinical atherosclerosis in this study, indicating that pancreatic steatosis is associated with macrovascular complications. Based on this result, we hypothesized that pancreatic steatosis influences systemic vascular complications. In addition, we investigated whether pancreatic steatosis is associated with not only macrovascular but also microvascular complications. In another recent study, the prevalence of diabetic retinopathy (DR) was associated with subclinical atherosclerosis in patients newly diagnosed with type 2 diabetes mellitus (T2DM) [8]. Similarly, other study results showed relationships between pancreatic steatosis and subclinical atherosclerosis and between subclinical atherosclerosis and the prevalence of DR. However, to the best of our knowledge, the association between pancreatic steatosis and DR remains unknown. Therefore, in the present study, the relationship between pancreatic steatosis and DR according to three microvascular complications of diabetes mellitus (DM) was investigated.
METHODS
Subjects
This study was carried out on 186 T2DM patients. Patients were aged 40 years or older and referred to the inpatient diabetes service due to failure of consecutive conventional outpatient treatment with either diet or any combination of oral antidiabetic agents. We excluded type 1 DM patients who had positive autoimmune antibodies (such as glutamic acid decarboxylase [GAD] Ab, islet antigen-2 [IA-2] Ab, islet cell antigen [ICA]). Patients who had a history of pancreatitis or pancreatic cancer and major organ failure (such as liver cirrhosis, renal failure [serum creatinine >2 mg/dL]) were also excluded. We also excluded patients who had systemic infection, were taking corticosteroids, or were pregnant. This study was approved by the Institutional Review Board (SIRB-00205_4-001) of Yeouido St. Mary's Hospital and written informed consent was provided to all of the participants.
Anthropometric and laboratory measurements
We measured the patients' waist circumference at the narrowest point between the lower limit of the ribcage and the iliac crest. We measured body weight in kilograms and height in meters of the subjects while they were barefoot and wearing light clothing. We calculated the body mass index (BMI), defined as weight/height2, using these measurements.
We used BMI >25 kg/m2 to define obesity according to the Asian-specific BMI cutoff values from the World Health Organization report [910]. Waist circumference, although highly correlated with cardiometabolic risk, is subject to interobserver variability. Imaging and other approaches can be used to more accurately assess fat distribution and quantify adiposity, but they are not readily available nor economical for defining obesity on a large scale [11]. Thus, to define obesity, we used the Asian-specific cutoff values rather than waist circumference or another imaging modality.
For measuring glycosylated hemoglobin (HbA1c) levels, an automated high-performance liquid chromatography analyzer (HLC-723 G7; Tosoh Corporation, Tokyo, Japan) was used. Serum C-peptide was measured using an immunoradiometric assay (Institute of Isotopes Co. Ltd., Budapest, Hungary). We measured the serum C-peptide level before and 6 minutes after intravenous injection of 1 mg of glucagon.
Measurement and parameters of pancreatic steatosis
For estimating abdomen and pancreas fat accumulation, we used non-enhanced CT according to the standard clinical abdominal CT protocol using a multislice CT scanner. Pancreatic CT attenuation was determined by calculating the Hounsfield unit (HU) of three pancreatic regions (head, body, and tail) with an area of 1.0 cm2. The pancreatic and splenic attenuation was measured by two experienced radiologists.
We used three pancreatic steatosis parameters for estimating pancreatic fat accumulation. The first parameter was the mean pancreatic CT attenuation (P mean). Previous studies have shown that the distribution of pancreatic fat accumulation is uneven [121314]. For adjusting uneven fat distribution of the pancreas, we defined the mean measurement of three pancreatic regions (head, body, and tail) with CT attenuation as P mean [151617]. The second and third parameters were measurements of normalized pancreatic CT attenuation with spleen attenuation (S). In a recent study [17], the researchers compared values of the difference between the pancreas and spleen attenuation (P–S) and pancreas and spleen attenuation ratio (P/S) to histologic pancreatic fat fraction. Splenic CT attenuation was measured with an area of 1.0 cm2. The study showed that these parameters were significantly correlated to histologic pancreatic fat fraction (P<0.01). Thus, apart from P mean, we used P–S and P/S as additional pancreatic steatosis parameters.
Evaluation of DR
Two expert ophthalmologists assessed the presence of DR using a digital fundus camera (TRC-NW6S; Topcon, Tokyo, Japan).
Statistical analysis
Subjects' characteristics and pancreatic steatosis parameters were compared using independent-sample Student t-tests for continuous measures and chi-square tests for categorical measures. Pearson's correlation coefficients between pancreatic steatosis parameters and various parameters were calculated. We divided the subjects into four groups according to the degree of each pancreatic steatosis parameter. We compared the prevalence of DR with these pancreatic steatosis parameters using the chi-square test. The odds ratios (ORs) and 95% confidence intervals (CIs) were calculated using binary logistic regression analysis to assess the associations between pancreatic steatosis and DR. All data were analyzed using SAS version 9.1 for Windows software (SAS Institute Inc., Cary, NC, USA). Data are presented as the mean±standard deviation unless otherwise stated. A P<0.05 was considered significant.
RESULTS
Clinical characteristics of the study subjects based on the presence or absence of obesity
The clinical characteristics of 186 subjects were analyzed. All patients were treated with oral hypoglycemic agents or insulin. The mean patient age was 58.29±14.70 years, and the mean BMI was 25.91±4.12 kg/m2. The mean duration of DM was 14.90±9.55 years, and the mean HbA1c level was 9.57%±2.09%. The mean total abdominal fat area (cm2) was 347.60±143.87, and the mean visceral fat area (cm2) was 140.67±61.48. Among the 186 subjects, 78 (42%) had DR.
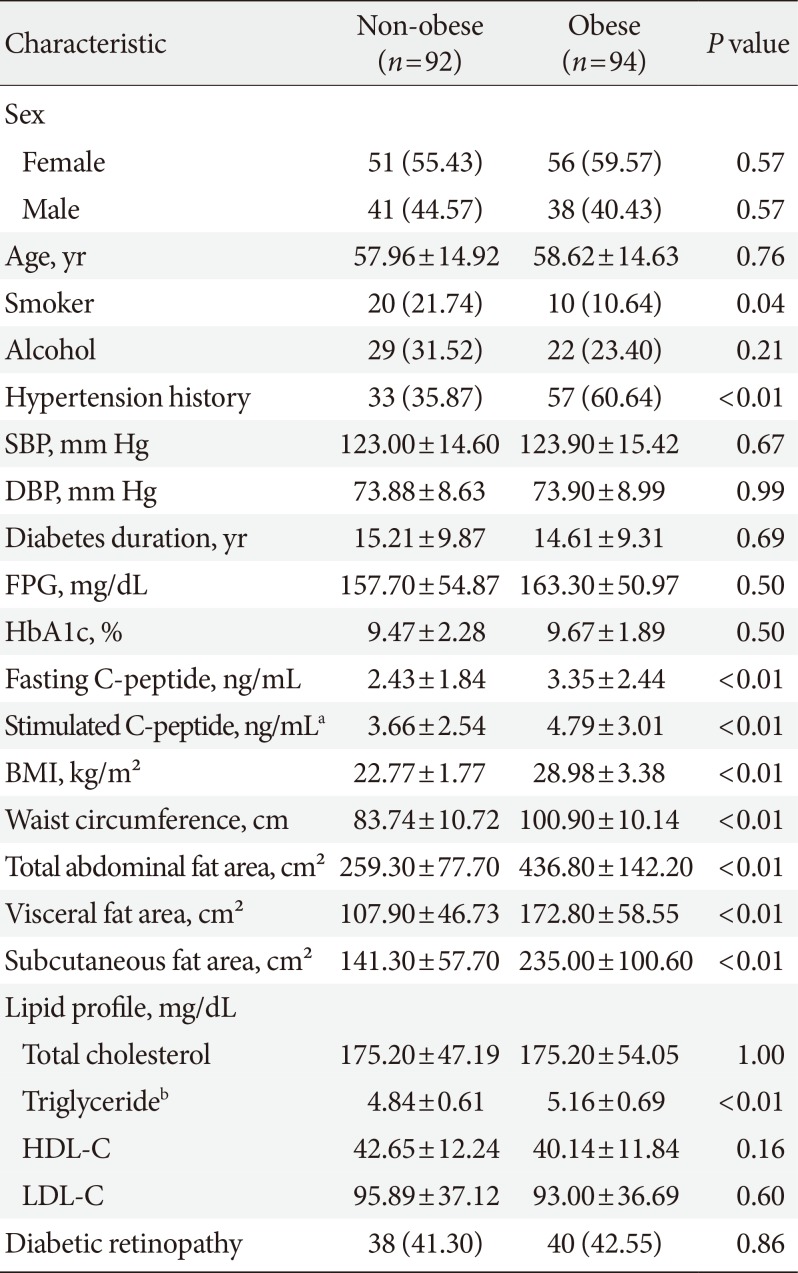
Differences in smoking habits, hypertension history, abdominal fat area, and triglyceride levels were observed between the obese and non-obese groups (Table 1). The mean BMI (kg/m2) in the obese and non-obese groups was 28.98±3.38 and 22.77±1.77. Hypertension was more common in the obese group than in the non-obese group. The smoking rate was higher in the non-obese group than in the obese group. No difference in the duration of DM, fasting plasma glucose (FPG) level, or HbA1c level was observed between the obese and non-obese groups. Fasting and stimulated C-peptide levels were higher in the obese group than in the non-obese group. When comparing the factors associated with abdominal fat between the groups, waist circumference, total abdominal fat area, and visceral and subcutaneous fat areas were significantly higher in the obese group than in the non-obese group. Among the lipid profiles, the log triglyceride level was higher in the obese group than in the non-obese group. The prevalence of DR was not significantly different between the two groups.
The association between pancreatic steatosis parameters and clinical factors based on the presence or absence of obesity
The decreases in pancreatic steatosis parameters measured by non-enhanced CT indicated that the degree of pancreatic steatosis was increased. Thus, the negative correlations suggest that the values of these factors increase as the degree of pancreatic steatosis increases.
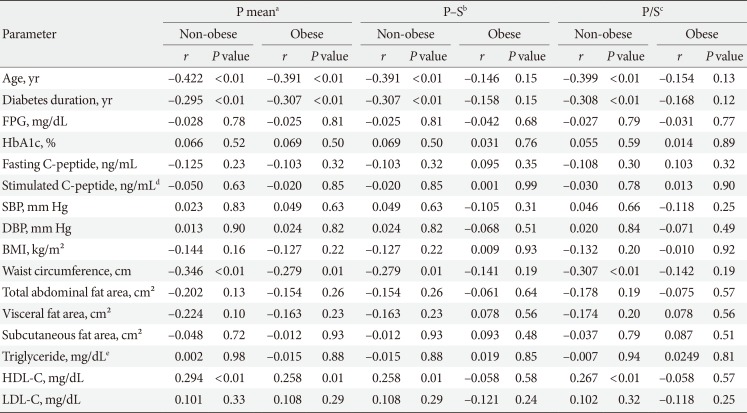
Table 2 shows the relationships between three pancreatic steatosis parameters and clinical factors in both groups. Age and DM duration were negatively correlated with all pancreatic steatosis parameters in non-obese T2DM patients. Age and DM duration were negatively correlated with P mean but were not correlated with P–S or P/S in the obese group. Waist circumference was negatively correlated with all pancreatic steatosis parameters in the non-obese group. In the obese group, waist circumference was negatively correlated with P mean but was not correlated with P–S or P/S. The total abdominal fat area and visceral and subcutaneous fat areas were not related to pancreatic steatosis parameters in either group.
No significant associations were observed between pancreatic steatosis parameters and other clinical factors for glycemic control (HbA1c, FPG, and fasting and stimulated C-peptide levels) or lipid profiles (triglyceride and low density lipoprotein levels).
The relationship between pancreatic steatosis parameters and DR according to the presence or absence of obesity
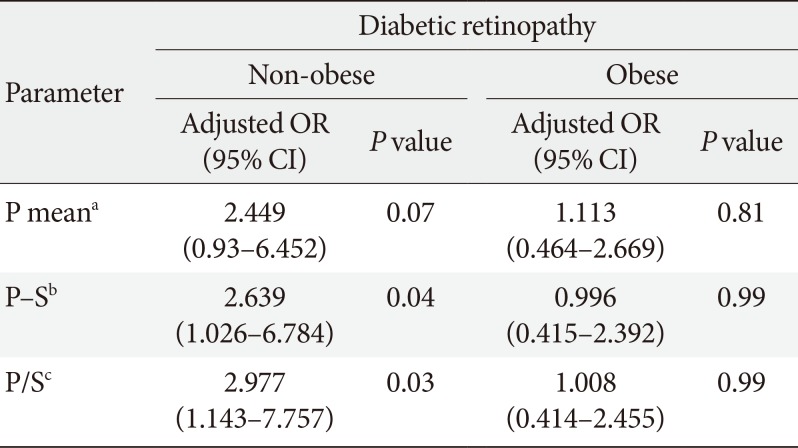
The average P mean, P–S, and P/S were 29.02, −18.20, and 0.61 HU, respectively. These three pancreatic parameters were strongly associated with the prevalence of DR in the non-obese group. The ORs of P mean, P–S, and P/S for the prevalence of DR, after adjustment for age, sex, and HbA1c level, were 2.449 (95% CI, 0.930 to 6.452; P=0.07), 2.639 (95% CI, 1.026 to 6.784; P=0.04), and 2.977 (95% CI, 1.143 to 7.757; P=0.03), respectively, in non-obese T2DM patients. In the obese group, none of the three pancreatic steatosis parameters was associated with DR (Table 3).
Correlations between the degree of pancreatic steatosis parameters and the prevalence of DR in non-obese and obese T2DM patients
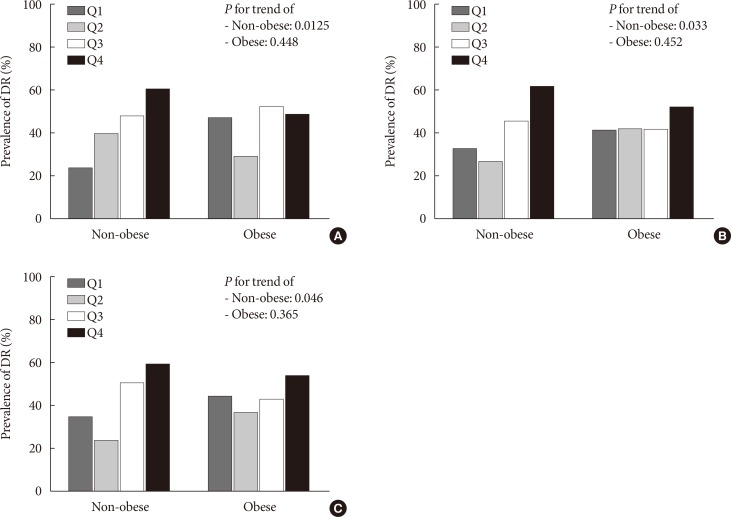
Fig. 1 shows the prevalence of DR according to the degree of pancreatic steatosis in both groups. Each pancreatic steatosis parameter was divided into four quartiles, and the mean of each quartile was defined as Q1 to Q4. From Q1 to Q4, the degree of pancreatic steatosis increased. For P mean, Q1 to Q4 were 41.67, 36.67, 26.5, and −58.3, respectively. For P–S, Q1 to Q4 were −6.33, −12, −22, and −106.3, respectively. For P/S, Q1 to Q4 were 0.87, 0.76, 0.56, and −1.22, respectively.
In addition, we analyzed the relationship between the degree of pancreatic steatosis and the prevalence of DR. For P mean, the prevalence of DR increased from Q1 to Q4 (Q1, 23.33%; Q2, 39.29%; Q3, 47.37%; Q4, 60%; P for trend=0.0125) in the non-obese group (Fig. 1A). For P–S (Q1, 32.26%; Q2, 26.09%; Q3, 45.00%; Q4, 61.11%) (Fig. 1B) and P/S (Q1, 34.48%; Q2, 23.08%; Q3, 50.00%; Q4, 58.82%) (Fig. 1C), the prevalence of DR decreased from Q1 to Q2 and increased from Q2 to Q4. The P values for trend to P–S and P/S for DR prevalence were 0.046 and 0.033. For all three pancreatic steatosis parameters, this pattern was not observed in the obese group.
DISCUSSION
In this study, pancreatic steatosis parameters measured by non-enhanced CT were associated with DR in non-obese T2DM patients.
Several imaging methods have been used to measure pancreatic steatosis. Using abdominal ultrasonography, increased echogenicity of the pancreatic body, which is greater than the echogenicity of the kidney, has been used to diagnose fatty pancreas [1218]. In another study, the pancreatic fat fraction was defined as a mean value of one to two regions of interest (1 cm2 of the pancreatic head, body, and tail areas) on MR spectroscopy [192021]. However, abdominal ultrasonography can vary widely depending on the examiner. As performing MR examinations is expensive, CT may be a more practical, noninvasive imaging modality for the pancreas because of its high reproducibility and cost-effectiveness. In a previous study [17], the corrected value of pancreatic CT attenuation based on splenic attenuation was compared with the histologic pancreatic fat fraction in 62 patients who underwent any type of pancreatic resection. The histologic pancreatic fat fraction was correlated with the P–S (r=−0.616, P<0.01) and P/S (r=−0.622, P<0.01). Based on the above research results, we investigated the relationship between DR and pancreatic steatosis parameters measured by non-enhanced CT.
In the present study, pancreatic steatosis parameters were associated with DR in T2DM patients, especially in the non-obese group. In addition, pancreatic steatosis was thought to affect DR independently of several glycemic control factors. In recent studies [518], pancreatic steatosis was shown to be associated with β-cell dysfunction and insulin resistance as local effects. Therefore, we analyzed whether three pancreatic steatosis parameters are correlated with glycemic control factors and found that the parameters were not associated with the HbA1c or FPG level in either group. In addition, the three pancreatic steatosis parameters were significantly associated with DR in the non-obese group after adjustment for HbA1c level. Thus, pancreatic steatosis is another independent factor associated with DR other than glycemic control.
In addition, the results of this study showed that pancreatic steatosis was associated with systemic vascular complications in T2DM patients. In a previous study, an association between pancreatic steatosis and atherosclerosis was found in T2DM patients [7]. Based on these results, pancreatic steatosis is likely involved in macrovascular complications. However, it is difficult to exclude the possibility that generalized systemic fat accumulation affects pancreatic steatosis and subclinical atherosclerosis simultaneously. In our study, pancreatic steatosis was associated with DR in non-obese T2DM patients, indicating that pancreatic steatosis likely influences microvascular as well as macrovascular complications. Both pancreatic steatosis and generalized systemic fat accumulation appear to affect systemic vascular complications.
In the present study, we analyzed which value among the three pancreatic parameters was most associated with DR. In non-obese patients, the ORs of the two pancreatic steatosis parameters corrected by splenic CT attenuation for DR were higher than the P mean, which was not corrected by splenic CT attenuation (Table 3). In another study, pancreatic steatosis parameters corrected by splenic CT attenuation were correlated with the histologic fat fraction of the pancreas [17]. In addition, in the present study, these parameters were associated with DR in non-obese T2DM patients. Therefore, pancreatic CT attenuation corrected by splenic CT attenuation may be helpful when comparing pancreatic steatosis with other vascular complications of DM.
In this study, a differential association between pancreatic steatosis and DR was observed based on the presence or absence of obesity. Pancreatic steatosis parameters and DR were more relevant in the non-obese group than in the obese group. In addition, the prevalence of DR increased linearly with the degree of pancreatic steatosis in non-obese T2DM patients. The P value for trend for all three pancreatic steatosis parameters for DR prevalence was less than 0.05 in non-obese group. In the obese group, this linear correlation was not observed.
The possible mechanism underlying this discrepancy is unclear; however, it may be due to the abdominal fat component of obese patients offsetting the systemic effect of pancreatic steatosis. In a study comparing fatty pancreas with the homeostatic model assessment of insulin resistance (HOMA-IR) [18], fatty pancreas was correlated with HOMA-IR even after adjusting for age, sex, and triglyceride, cholesterol, and fatty acid levels. However, after adjusting for visceral fat area, the correlation between fatty pancreas and HOMA-IR disappeared. In another study comparing the duration of DM and pancreatic fat volume measured by CT [22], the pancreatic volume was 49.1 to 66.3 cm3 and the pancreatic fat volume 2.4 to 4.0 cm3. In our study, the volume of total abdominal fat was not calculated; only the cross-sectional area of the abdominal fat was measured. However, in the present study, the mean total abdominal fat area was 259.30±77.70 cm2 in the non-obese group and 436.80±142.20 cm2 in the obese group (P<0.01). Based on these results, abdominal fat was more abundant than pancreatic steatosis in the obese group compared with the non-obese group. Because of preexisting imbalances due to the abdominal fat component in obese subjects, pancreatic steatosis may have a greater impact on DR in non-obese subjects than in obese subjects.
On the other hand, when the degree of pancreatic steatosis increased from Q1 to Q2, the DR prevalence also increased with P mean (Fig. 1A) but decreased with P–S (Fig. 1B) and P/S (Fig. 1C) in the non-obese group. The mechanism underlying this discordance is difficult to explain. However, in Table 3, the ORs of DR of P–S (P=0.04) and P/S (P=0.03) were found to be more significant than those of P mean (P=0.07) when adjusted by HbA1c, a factor associated with level of glycemic control. These results suggest that, with regard to DR, Q1, and Q2 subjects with low degrees of pancreatic steatosis are more likely to be affected by other factors related to glycemic control than those of pancreatic steatosis.
The present study had several limitations. First, our study was observational and cross-sectional in design. We could not control for oral glycemic agents, insulin injections, antihypertensive agents, medication for dyslipidemia, or other factors that might affect DR. In addition, this study included patients with poor glycemic control who required hospitalization. Therefore, the study subjects might have experienced glucotoxicity during the study period. Consequently, these confounding factors might have influenced the results. Second, the number of study subjects with DR was small (n=78, 42%). Therefore, determining whether the DR stage varies depending on the degree of pancreatic fat deposition was difficult. Large-scale prospective studies are needed for patients with mild to moderate DR to identify the relationship between pancreatic steatosis and DR stage.
 XML Download