

 PDF
PDF ePub
ePub Citation
 Print
Print


INTRODUCTION
Type 2 diabetes mellitus (T2DM) has emerged as a global pandemic in the 21st century [1]. Chronic kidney disease (CKD) is a frequent microvascular complication among the diabetic patients [23]. CKD is the leading cause to develop ‘end stage of renal diseases (ESRD)’ and very frequent to appear in patients with T2DM both for the developed and developing countries [4]. For the South East Asian context, the prevalence of renal failure as a diabetic microvascular complication is quite high [5]. It is estimated that kidney disease as a complication of T2DM will eventually take the leading position of global disease burden by the year 2030 [6].
As a country of Southeast Asia, Thailand has experienced the effects of the epidemiological transition in recent years, and the prevalence of non-communicable diseases is rising [7]. Among the various reasons, behavioural factors like physical inactivity and increasing trend of junk food consumption are responsible for causing over-nutrition, which can gradually trigger microvascular complications in patients with diabetes mellitus (DM) [8]. Though it is not certain that all diabetic patient will develop CKD, but the minimal damage to the kidney is frequent due to uncontrolled DM [910]. Another study suggested that age, sex, race, positive family history, high blood pressure, and dietary habit are the influencing factors for CKD [11]. Moreover, long-term hyperglycaemia due to uncontrolled DM can play a vital role to initiate renal vascular diseases [12]. Therefore, it is always desirable to keep the glycaemic state under control to prevent kidney disease for the patients who have DM [13].
High body mass index (BMI) relates to metabolic disorders that can act as a risk factor for microvascular complication. Therefore, obese patients are more likely to develop diabetic microvascular kidney complication when compared with the normal BMI patients [14]. However, a previous study found that the association of BMI with CKD is not straightforward in patients with T2DM [15]. Some epidemiological studies have found that overweight and obesity can be protective for some patients of the ESRD [161718]. Besides, patients with high BMI might survive more during the dialysis stage of CKD [161718]. A new terminology of survival paradox has appeared to explain that patients with high BMI might survive well [19] which is very controversial. This study will give us a good insight by investigating the above relationship in Thai population. To the best of our knowledge, the relationship of obesity with CKD has not been fully explored in Northeastern Thailand. Therefore, this study aims to explore the association between BMI and CKD among the diabetic patients in Thailand.
METHODS
Data source
The study population was T2DM patients who sought care in a large district hospital located in the northeast of Thailand. The hospital has been maintaining a diabetic registry under an ongoing screening program for more than a decade. Based on this clinical registry, we have extracted the hospital record of 3580 T2DM who attended the hospital between January 1, 2015 and December 30, 2015. This study has also collected three consecutive monthly records of estimated glomerular filtration rate (eGFR) of a T2DM patient to determine the presence of CKD. Patients above 18 years were enrolled in this study. All the information related to patient's anthropometric measurement and biochemical tests were taken at the same time during a patient's hospital visit. Fasting blood samples were used to report glycosylated hemoglobin (HbA1c) and lipid profile for the individual patient.
Data management
A medical record number (MRN) was used as a unique identifier to retrieve the hospital records across the hospital's electronic system. One MRN was linked with three datasets. First one was the clinical data where medical diagnosis, treatment, and anthropometric measurements were recorded. The second dataset contained the demographic information that was collected by accessing the patient's health card. The laboratory staff prepared the third data set for this study. Data entry was done by a group of skilled data operator under the supervision of a data management officer (DMO). All the entered data were verified by DMO to detect the entry errors and inconsistencies. Error data were cross-checked with the laboratory records and clinical case recording forms. Physical measurements were recorded twice to minimize the observer error, and quality of biochemical tests was maintained by ensuring the regular quality control check of the laboratory.
Definition of variables and measurement
CKD was defined based on the eGFR value according to the ‘National Kidney Foundation-Kidney Disease Outcomes Quality Initiative (NKF-KDOQI)’ which states that “GFR less than 60 mL/min/1.73 m2 for 3 months with or without the other signs of kidney damage” [20]. This study has used the ‘Chronic Kidney Disease Epidemiology Collaboration (CKD-EPI)’ equation to estimate the eGFR and we have used CKD staging (stage 1 to 5 based on eGFR). Participant's age was categorized into two subgroups based on the Thai retirement age. For the detection of the poor glycaemic control, this study has used the World Health Organization (WHO) recommendation to consider HbA1c >6.5% as a cut-off point [21]. BMI was classified into four different categories according to WHO recommended BMI classification: underweight (<18.50 kg/m2), normal (18.50 to 24.99 kg/m2), overweight (25.00 to 29.99 kg/m2), and obese (≥30.00 kg/m2) [22]. Hypertension was defined by measuring the average systolic (≥140 mm Hg) and/or diastolic blood pressure (≥90 mm Hg) or positive history of taking the antihypertensive drugs [23]. Microalbuminuria was defined according to ‘American Diabetic Association Classification of Microalbuminuria’ if the excretion rate of albumin is from 30 to 300 mg/day of urine collection for a patient. Low density lipoprotein cholesterol (LDL-C) was categorized into normal or high (LDL-C ≥130 mg/dL) based on ‘American Association of Clinical Endocrinologists’ guideline [24].
Statistical analysis
Descriptive statistics were used to present the categorical and continuous variables. The difference between CKD and the non-CKD group was examined by performing the chi-square test. Bivariable and multiple logistic regression analysis were used to explore the association of CKD with known risk factors including BMI. We have simultaneously used all the potential risk factors in the model during the adjusted analysis. STATA version 13 (StataCorp, College Station, TX, USA) was used for data analysis [25], and a cut-off value of 0.05 was considered as statistical significance.
Ethics statement
The Ethical Committee of Khon Kaen University (KKU) approved this study (approval no. HE2247). Anonymous hospital data were analysed, and all participants provided informed consent to be included in the hospital registry. Hence, the Institutional Review Board of KKU exempted the study team from obtaining consents from individual patients.
RESULTS
Participant's characteristics
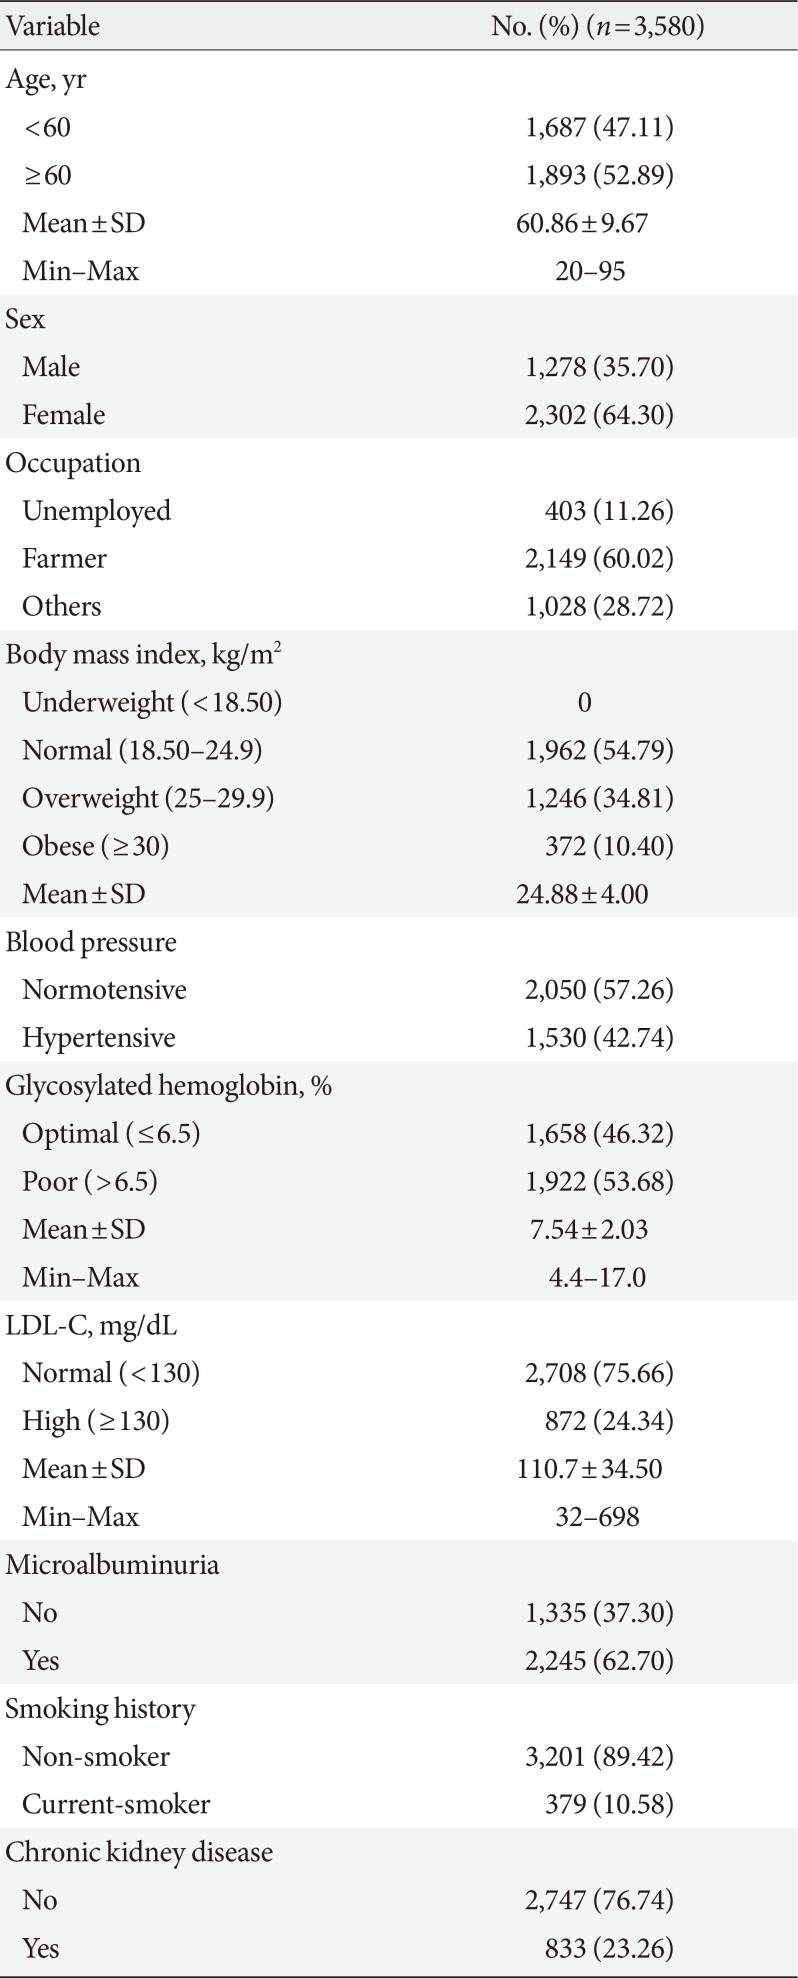
Table 1 outlines the general features of the study participants. The mean age was 60.86±9.67 years, and male to female ratio was 1.00:1.80. Their primary occupation was farming (60.02%), 11.26% were unemployed, while about one-thirds (28.72%) were engaged in different types of employment. Nearly half of T2DM patients (54.79%) had normal BMI, while one-thirds were overweight (34.81%) and one of 10 patients were obese (10.40%). About 42.74% of the T2DM patient was hypertensive, and 53.68% had poor glycaemic control. High LDL-C and microalbuminuria were present among 24.34% and 62.70% patients, respectively. About one-quarter of the T2DM patients (23.26%) were diagnosed as CKD cases.
Association of BMI with CKD in patients with T2DM
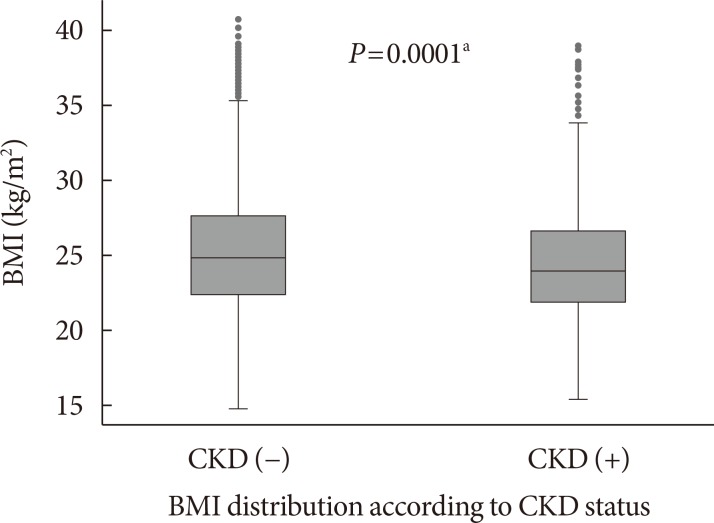
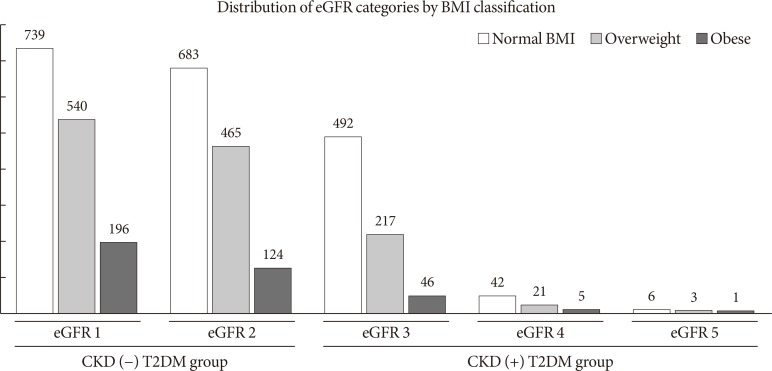
Fig. 1 describes the BMI distribution among the T2DM patients by CKD status. Mean BMI of the non-CKD group was slightly higher than CKD group (25.30 kg/m2 vs. 24.30 kg/m2), Fig. 2 shows the normal distribution of eGFR categories according to optimal BMI, overweight, and obese condition among the patients with T2DM.
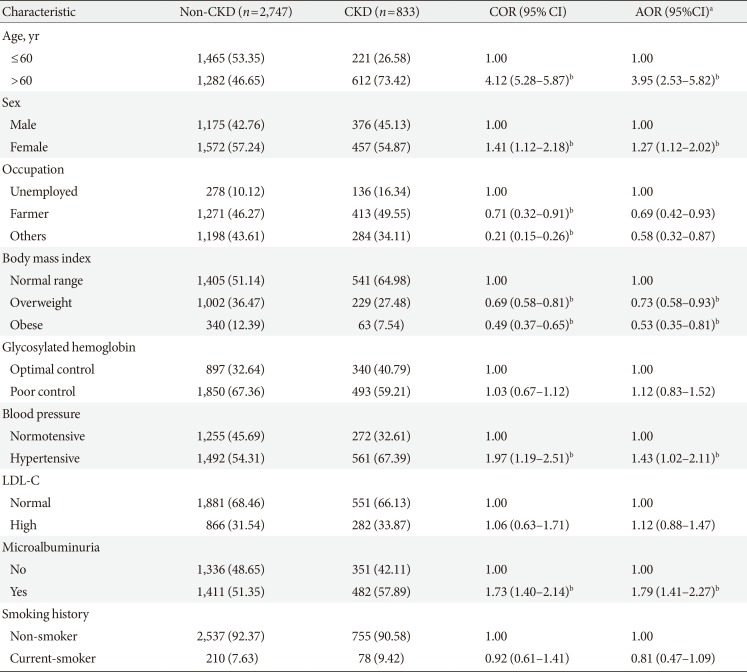
Table 2 demonstrates the association of CKD with different risk factors. In the bivariate analysis, higher age (crude odds ratio [COR], 4.12; 95% confidence interval [CI], 5.28 to 5.87), female sex (COR, 1.41; 95% CI, 1.12 to 2.18), hypertension (COR, 1.97; 95% CI, 1.19 to 2.51), and microalbuminuria (COR, 1.73; 95% CI, 1.40 to 2.14) showed statistically significant positive association with CKD. On the other hand, compared to unemployment status, being farmer (COR, 0.71; 95% CI, 0.32 to 0.91) or employed in other areas (COR, 0.21; 95% CI, 0.15 to 0.26) and compared to normal BMI, being overweight (COR, 0.69; 95% CI, 0.58 to 0.81) or obese (COR, 0.49; 95% CI, 0.37 to 0.65) were negatively associated with CKD, and the association was statistically significant. We did not find any significant association for poorly controlled HbA1c, high LDL-C, and smoking history with CKD.
In multivariable analysis, CKD was negatively associated with high BMI: overweight, (adjusted odds ratio [AOR], 0.73; 95% CI, 0.58 to 0.93) and obese (AOR, 0.53; 95% CI, 0.35 to 0.81) in this study. On the other hand, older age, female sex, hypertension, and microalbuminuria showed positive association of CKD (P<0.05).
DISCUSSION
This study observed a significant negative association between higher BMI and CKD among T2DM patients. On the contrary to expectation, the measure of BMI was found lower among the CKD patients' than the non-CKD group. Our observed negative association of CKD with BMI could be demonstrated by the fact that CKD patients usually lose their weight. Moreover, there are high chances of reverse causation, which can be explained that CKD patients might receive special attention and treatment from the health care system, and their adherence to healthy diet intake and good lifestyle might reduce extra calories and carbohydrates. Another explanation could be that CKD patients usually develop anaemia and their nutritional status can also in decline [19].
There is plenty of evidence showing obesity as a risk factor of CKD. For example, the findings of Framingham study cohort reported that high BMI could predict the reduced kidney function independently [26]. Therefore, our results do not support the Framingham cohort study. However, using BMI to know the status of CKD for T2DM patients can be problematic. These diabetic patients not only tend to lose muscle mass but also experience increased body fat at the same time. As BMI cannot differentiate between the body muscle and the body fat; therefore, BMI should not be used as a reliable indicator of CKD for T2DM patients [27].
Previous research mainly focusing on the longitudinal study has argued that obese person can experience a good survival outcome, particularly who are with cardiovascular and/or renal disease [28]. This statement is neither completely understood nor universally accepted in the research community; hence, this phenomenon is known as obesity paradox. This theory of obesity paradox found in a longitudinal study [19] hypotheses that high BMI might enable a patient to be protected from various metabolic illnesses by utilizing energy stores from their body. Therefore, an abrupt decline in body muscle over a period could be linked to reducing the survival in CKD patients [19]. One study showed that a reduction in the content of body fat over a 6-month period was associated with higher mortality in patients with maintenance haemodialysis [17]. However, it is difficult to compare our study with above-mentioned association of obesity and CKD as our findings are based on retrospective cross-sectional study.
The global distribution of kidney disease does not share the same epidemiological feature, and it varies by geographical aspects, ethnicity, and racial consideration [29]. This study found that increased age was associated with renal insufficiency which corresponded with a previous study finding [30]. In this study, the mean of BMI was 24.88 kg/m2 among the T2DM patients. After applying the WHO recommended BMI classification (overweight: BMI ≥25.00 kg/m2 and obese ≥30.00 kg/m2), the overweight and obese T2DM patients were found 34.81% and 10%, respectively (27.48% overweight, and 7.54% obese among the T2DM with CKD). The finding was consistent and contextual, after taking consideration of another study, which found that about 50% of participants of a selected area in Taiwan were accounted as overweight and obese [31].
Considering the other risk factors of CKD, degenerative changes of the renal glomerular tissue is found as frequent among the older age group [30]. The number of female patients with CKD was more when compared with their male counterparts. Our findings are similar to other large-scale studies where old age and female sex were found as a risk factor of CKD [1132]. Our study found that T2DM patients with hypertension had 1.4 times high chances to get CKD which is similar to a previous report [33]. Moreover, diabetic patients with higher microalbuminuria were 1.7 times more likely to have CKD, which corresponds to an earlier study [34]. To the best of our knowledge, this was the first initiative to analyze the individual relationship between BMI and diabetic CKD in the northeast of Thailand.
However, this study has experienced certain limitations. It was a monocentric study, and this study could not collect relevant information on food habit, behaviour, duration of T2DM, first-time identification of DM, medication use like lipid-lowering drugs, and adherence to treatment. This study did not consider other comorbidities like chronic obstructive pulmonary disease, heart failure, or malignancies which are contributory factors for weight change due to unconfirmed diagnosis. Therefore, residual confounding might influence the study findings. The results of this cross-sectional study should be interpreted with caution due to the usual cause and effect dilemma. However, this study has used a large volume of sample and high-quality data to come up with the finding.
Finally, the negative association of BMI with CKD in patients with T2DM might reflect the reverse causality. Lower BMI might not contribute to CKD, but there are probabilities that CKD can lead to the reduced BMI. Therefore, longitudinal studies are required to explore the actual relationship of BMI with the development of diabetic CKD.
 XML Download