

 PDF
PDF ePub
ePub Citation
 Print
Print


INTRODUCTION
After publication of the United Kingdom Prospective Diabetes Study, strict glycemic control for the prevention of diabetic complications was emphasized in patients with type 2 diabetes [1]. However, surprisingly, recently published large clinical trials such as the Action in Diabetes and Vascular Disease (ADVANCE), Action to Control Cardiovascular Risk in Diabetes (ACCORD), and the Veterans Affairs Diabetes Trial (VADT), failed to demonstrate that intensive glucose control improved primary cardiovascular outcomes in patients with type 2 diabetes [234]. Notably, severe hypoglycemia (SH) requiring medical intervention and remarkable weight gain were reported to be the main factors associated with the limited benefits of glycemic control [56]. On the basis of these results, recent clinical practice guidelines emphasize the need to individualize glycemic target goals [789] because accumulated results from cardiovascular trials have suggested that not all patients benefit from intensive glycemic treatment.
Hypoglycemia is a well-recognized side effect of diabetes treatment and is regarded as a major barrier to achieving glycemic targets in patients with type 2 diabetes [10], and the incidence of hypoglycemia has continued to increase. One systematic review showed that the risk factors of further development of hypoglycemic events in subjects with type 2 diabetes included a history of hypoglycemia, renal insufficiency, longer diabetes duration, lower education level, race, history of dementia, and a history of microvascular complications [11]. A previous study comparing the incidence of SH over 10 years suggested that intensification of glycemic control led to a considerably higher incidence of SH [1213]. According to the ADVANCE study, SH was strongly associated with increased risks of adverse clinical outcomes, including vascular events and death, in patients with long-standing type 2 diabetes [14]. Therefore, early detection and prevention of SH risk factors are clinically important.
Hypoglycemia is known to induce cardiovascular events [5]. Hypoglycemia has been suggested to have acute effects on sympathoadrenal activation, inflammation, increased platelet and neutrophil activation, and endothelial function, all of which have potential adverse cardiovascular effects [1516]. In addition, cardiac ischemia or fatal arrhythmia during hypoglycemia may be responsible for the increased risk of cardiovascular disease (CVD) among patients with hypoglycemia [17]. Therefore, hypoglycemia may contribute directly to the increased risk of CVD and death, especially in elderly people with type 2 diabetes [18].
However, there is limited evidence supporting CVD history as a risk factor for SH [192021]. Previously, we suggested that cardiovascular autonomic neuropathy (CAN) increases the risk of SH [22]. Thus, the current study attempted to investigate whether prior episodes of CVD were associated with an increased risk of SH, especially with regard to the effect of CAN, in a prospective cohort of patients with type 2 diabetes.
METHODS
Population
The methodology of this cohort study has been described previously [22]. From January 2001 to December 2002, 1,102 patients aged 25 to 75 years with type 2 diabetes were consecutively recruited, and all patients underwent follow-up from January 2011 to December 2012 at the university-affiliated diabetes center of St. Vincent's Hospital in South Korea. Patients were excluded if they were older than 75 years, mentally ill, unable to undertake self-care behaviors, had previously experienced SH, or had cognitive dysfunction, alcoholism, or any severe illness such as malignancy, severe infection, or liver cirrhosis. Patients with renal impairment (estimated glomerular filtration rate [eGFR] <60 mL/min/1.73 m2) were also excluded. This prospective cohort study was approved by the Institutional Review Board of St. Vincent's Hospital, The Catholic University of Korea. The study was conducted in accordance with the Declaration of Helsinki. Written informed consents were obtained from all participants. All data were anonymized for analysis after collection.
Time frame for analysis
All of the participants were followed up every 3 to 6 months on an outpatient basis. If the patients visited an emergency department or were hospitalized because of SH, we reviewed the medical records and identified the reason and diagnosis. The median follow-up period was 9.5 years. Two hundred forty-seven patients who did not receive follow-up care and 23 patients who died during the follow-up period were excluded from the analyses.
Evaluation of previous cardiovascular disease
CVD was defined as a diagnosed history of coronary artery disease (CAD) or stroke. CAD was defined as either a diagnosed history of angina pectoris, myocardial infarction, or coronary revascularization (coronary bypass surgery or coronary angioplasty). Stroke manifestations included previous transient ischemic attack or cerebral infarction. Diagnosis of clinically established CVD was based on verified medical records, and the diagnosis was confirmed by a specialist (cardiologist, neurologist, or neurosurgeon).
Evaluation of severe hypoglycemia cases
The primary outcome of this study was the development of SH. SH was defined as hypoglycemic episodes requiring the assistance of medical care in an emergency department or hospitalization [23]. Our study was designed to observe if SH occurred spontaneously as part of the routine management of diabetes, not as a consequence of intensive therapeutic intervention.
When the patients visited the outpatient clinic during regular follow-up, the physician asked whether they had experienced SH episodes or visited an emergency department because of SH. We also investigated the SH events of patients in our emergency department each day. If patients reported their hypoglycemic episodes or visited our emergency department as a result of SH, we obtained clinical information, such as the presence of signs or symptoms, blood glucose levels, probable causes of events, and type and dosage of current hypoglycemic medications, from the patients' history and/or objective medical records and confirmed the occurrence of an SH event. If patients did not visit our clinic for any reason, we attempted to contact the patient by telephone or electronic mail to evaluate the occurrence of SH.
Assessment of risk factors
A detailed questionnaire was used to obtain participant information, including medical history, current cigarette smoking status, and the use of medications. The patients' height and weight were measured to determine their body mass index. Hypertension was defined as systolic blood pressure ≥140 mm Hg, diastolic blood pressure ≥90 mm Hg, or the use of antihypertensive medications. Blood samples were collected from all subjects after they had fasted for 12 hours, and lipid parameters (total cholesterol, triglycerides, and high density lipoprotein cholesterol), blood glucose levels, and glycosylated hemoglobin (HbA1c) levels were also measured. Fasting and 2-hour postprandial plasma glucose levels were measured using an automated enzymatic method. The HbA1c level was measured by high-performance liquid chromatography with a reference range of 4.4% to 6.4% (Bio-Rad, Montreal, QC, Canada) every 6 months to evaluate the status of glycemic control during the follow-up period. The blood lipid concentrations for total cholesterol, triglycerides, and high density lipoprotein cholesterol were measured enzymatically using an automatic analyzer (model 736-40; Hitachi, Tokyo, Japan). The eGFR was used to determine the chronic kidney disease classification using the 4-component Modification of Diet in Renal Disease equation [24].
Diabetic retinopathy was assessed from retinal photographs at baseline, and the findings were reviewed by an ophthalmologist. Retinal findings were classified as either the absence or presence of diabetic retinopathy. Diabetic nephropathy was considered if a patient was found to have microalbuminuria (30 to 300 mg/day) or macroalbuminuria (≥300 mg/day). The urinary albumin excretion rate was measured from a 24-hour urine collection using immunoturbidimetry (Eiken, Tokyo, Japan).
A cardiovascular autonomic function test using the Ewing method was performed by a single examiner during the recording of a continuous electrocardiogram, and the RR intervals were recorded. The cardiovascular test included measurement of heart rate variability, including the expiration-to-inspiration (E/I) ratio, responses to the Valsalva maneuver, and postural change from lying to standing [1725]. The patients were asked to fast for 12 hours before the autonomic function test and to avoid taking insulin, antidepressants, neuroleptic agents, caffeine, nicotine, antihistamines, or sympatholytic drugs. An E/I ratio below the age-related reference value, a Valsalva ratio of <1.2, and a posture ratio of <1.03 were considered abnormal. Each of the three ratios described above were scored as either normal (0) or abnormal (1), for a total maximum score of 3. The staging of CAN was confirmed as follows: a score of 0 was defined as normal autonomic function; a score of 1 was defined as early CAN; and a score of at least 2 was defined as a definite diagnosis of CAN [172526].
Statistical analysis
All results are expressed as the mean±standard deviation or as proportions. P<0.05 was considered significant. Chi-square tests were used to test differences in the proportion of categorical variables, and independent Student t-tests were used for evaluating the difference between the mean of two continuous variables. If a patient had multiple SH events, the first recorded event was used in this analysis. After verifying the proportional hazards assumption by means of log-minus log-survival plots and testing with the methods described elsewhere [27], we used Cox proportional hazards regression analysis to test associations between the outcome (SH episodes) and potential explanatory variables. The relationships were analyzed after adjustment for the following prognostic factors: sex, age, duration of diabetes, presence of hypertension, diabetic retinopathy or nephropathy, mean HbA1c throughout the study, CAN, and the use of insulin, angiotensin-converting-enzyme inhibitors (ACEi), angiotensin receptor blockers (ARBs), or β-blockers. The results are presented as hazard ratios (HRs) and 95% confidence intervals (CIs). Statistical analyses were performed using SAS version 9.2 (SAS Institute, Cary, NC, USA).
RESULTS
Clinical characteristics
Among the 1,102 patients who were recruited, 208 patients were excluded. Of the 894 patients who were enrolled in the study, 624 (69.8%) completed the follow-up. The median follow-up time was 9.5 years (5,814 person-years of follow-up). The mean age and diabetic duration of patients who completed follow-up were 54.5±9.9 and 8.9±6.4 years, respectively. Among the patients who completed follow-up, 60 patients (9.6%) had a previous history of CVD (27 [4.3%] had a stroke, 39 [6.5%] had CAD, six [1.0%] had a disease history of both stroke and CAD) at baseline. There were no significant differences between the participants who completed the follow-up evaluation and those who did not with respect to sex ratio (P=0.921), age (54.5±9.9 years vs. 54.7±10.6 years, P=0.783), diabetes duration (8.9±6.3 years vs. 7.9±7.6 years, P=0.063), presence of hypertension (P=0.481), or history of prior CVD (P=0.212). However, baseline HbA1c levels were significantly lower among those who completed follow-up (8.61%±1.96% vs. 9.03%±2.15%, P=0.005).
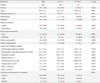
Compared to patients without CVD, those with CVD were older, had a longer duration of diabetes and hypertension, and used more insulin, ACEi, and β-blockers at baseline. The patients with CVD had a higher incidence of diabetic retinopathy and nephropathy. Regarding CAN, 196 patients (31.4%) had CAN at baseline. More patients with CVD had CAN than did those without CVD (46.7% vs. 29.8%, P<0.001). In the group with a CVD history, we observed a lower eGFR, but it was within the normal range. There were no differences in the parameters of baseline HbA1c and lipid profiles between the two groups (Table 1).
Incidence of severe hypoglycemia
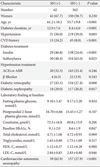
During the follow-up period, 62 patients (9.9%) experienced at least one episode of SH, with an incidence rate of 1.33 per 100 patient-years. When analyzed by age group, the incidence of SH was higher in the older age groups (5.8%, 4.4%, 6.8%, 15.0%, and 38.2% in the under 40, 41 to 50, 51 to 60, 61 to 70, and over 70 age groups, respectively; P for trend <0.001). Compared to patients without SH, those with SH had a longer duration of diabetes and used more insulin and ACEi at baseline. The patients with SH had more microvascular complications, such as retinopathy and nephropathy. Patients with SH showed significantly more CAN compared to patients without SH at baseline (SH (+) vs. SH (-), 62.9% vs. 27.9%; P<0.001). Notably, patients with a CVD history at baseline experienced SH events three times more frequently than patients without a history of CVD (24.2% vs. 8.0%, P<0.001) (Table 2).
The most common presenting symptom of SH was decreased mental status, such as coma or stupor (44.9%), and the most common precipitating cause was missing a meal (41.9%). Twelve patients (19.4%) in the SH group experienced recurrent SH episodes. Twenty patients (32.3%) had antecedent hypoglycemia within 3 or 6 months of SH events. There were no significant differences in insulin dose by weight (0.64±0.29 IU/kg vs. 0.67±0.33 IU/kg, P=0.757) and type of insulin (P=0.612) at the severe hypoglycemic event between the patients with and without prior CVD history.
Association with confounding factors
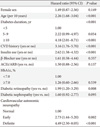
Univariate Cox hazard regression analysis revealed that age, duration of diabetes, history of CVD, use of insulin, and diabetic retinopathy were significantly associated with SH events (Table 3). However, glycemic control status or type of antihypertensive medication did not show any association with SH. In multivariate analysis, after adjustment for age, sex, diabetes duration, presence of hypertension, mean HbA1c, diabetic complications, and the use of insulin, ARB/ACEi, or β-blockers, the patients with a history of CVD exhibited a 1.90 times higher SH risk than those without a CVD history (Table 4).
In the next step, we further evaluated the relationship between a history of CVD and SH using cardiovascular autonomic dysfunction as an additional confounder. Additional multivariate analysis combined with CAN stage revealed that a CVD history at enrollment remained a significant prognostic factor for the development of SH (HR, 1.99; 95% CI, 1.07 to 3.72; P=0.031) (model 4 in Table 4).
DISCUSSION
In this study, we demonstrated that previous episodes of CVD were associated with future development of SH in patients with type 2 diabetes. Specifically, patients with a history of CVD had a two times higher risk of SH during the 10-year follow-up period compared to those patients without a CVD history. The results were independent of glycemic control status, diabetic duration, age, diabetic complications, use of insulin, or presence of cardiovascular autonomic dysfunction.
Currently, three large clinical trials (the ADVANCE, ACCORD, and VADT trials) have investigated whether intensive glycemic control could improve cardiovascular outcomes. None of these trials demonstrated cardiovascular benefits in the intensive glycemic control group [2328]. Moreover, the intensive glycemic control group was found to have more episodes of SH and weight gain, which were related to an increased risk of CVD. In a meta-analysis, participants in the intensive glycemic control group experienced SH events 2.5 times more frequently (95% CI, 1.9 to 3.2) than did those in the control group [29]. Another study including 903,510 people with type 2 diabetes and the ADVANCE study (n=11,140) both showed that SH was associated with more than twice the risk of CVD [1415]. Therefore, avoiding SH is important in the prevention of CVD in patients with type 2 diabetes.
In a previously reported retrospective case-control study, patient groups with CAD and stroke had 1.48 and 2.78 times higher risk of SH than control groups, respectively [21]. One retrospective study in patients with type 2 diabetes who were hospitalized for SH found that those with recurrent hypoglycemia had a significantly higher prevalence of CAD (odds ratio, 2.30; 95% CI, 1.04 to 5.10) compared to the non-recurrent group [30]. Another case-control study showed that patients with CAD had a 2.38 times higher relative risk for developing SH [20]. One nested case-control study in patients with type 2 diabetes revealed that CAD was present in 21.0% of hypoglycemia hospitalization cases compared with 7.8% of control cases (adjusted odds ratio, 1.48; 95% CI, 1.21 to 1.81) [31]. However, these reports had the limitations of being retrospective or case-control studies.
Our prospective cohort study revealed that the incidence of SH was approximately two times higher in patients with a CVD history than in those without a CVD history, after adjusting for several confounding factors. However, there are no known mechanisms by which CVD could increase the risk of future SH in patients with type 2 diabetes. There are two known main mechanisms for a normal response to hypoglycemia [3233]: one is a consecutive decrease in insulin secretion and an increase in counter-regulatory hormone secretion, such as glucagon or adrenomedullary epinephrine, and the other is subjective recognition of the hypoglycemia by autonomic nervous function. In patients with CVD, sympathetic activation and catecholamine release during hypoglycemic events usually accompany tachycardia and elevation of blood pressure [34]. If myocardial damage or dysfunctional sympathetic innervations preexisted in patients with CVD, hypoglycemia could not be easily recognized by patients themselves. Moreover, if hypoglycemic episodes are repeated and aggravated, hypoglycemia unawareness may occur. In addition, preservation of whole-brain glucose uptake during hypoglycemia is different between patients with tightly controlled diabetes and nondiabetic subjects [35]. Hypoglycemia counter-regulation is at least partly triggered by a glucose-sensitive brain region. Therefore, the brain must be responsible for adaptation to hypoglycemic events to some degree [36]. If this glucose-sensitive region of the brain is damaged by ischemic events, the response to hypoglycemia may be blunted in patients with diabetes.
CAN is associated with impaired recognition of hypoglycemia and impaired recovery from hypoglycemia because of defective endocrine counter-regulatory mechanisms [3738]. It is well known that CAN may affect the occurrence of CVD events in patients with diabetes. Initially, we hypothesized that CAN is one of the main linkage mechanisms between CVD and the development of SH. However, in our analysis, CVD remained a significant independent prognostic factor for SH after adjusting for the presence of CAN. Furthermore, antihypertensive medications, such as β-blockers, which may mask the symptoms of hypoglycemia, did not influence the risk of SH in this study. Thus, determining the mechanism for the association between CVD and risk of SH calls for further well-designed studies.
The main strengths of our study were the long-term, well-characterized prospective approach in a large hospital-based cohort, in addition to our use of multivariate analysis to ascertain the risk factors of SH in patients with type 2 diabetes. In addition, SH episodes were defined from the medical records of our emergency department or outpatient clinic. Even if the patients visited other hospitals, we reviewed all medical records describing their SH episodes and confirmed the events.
However, there are some limitations to this study. First, the number of CVD patients among the patients who completed the follow-up was relatively small (approximately 10% of the total population), and this may have introduced a selection bias. Second, exclusion of patients with renal insufficiency may also explain the relatively small number of CVD patients at baseline, although this exclusion contributed to increasing internal validity. Third, this cohort study was composed entirely of an Asian population. More studies are needed to apply this finding to other ethnic groups. Last, peripheral artery disease and carotid endarterectomy were not included in the definition of CVD. We measured the ankle-brachial index but could not routinely confirm peripheral artery disease using a lower extremity ultrasonogram or angiography on an outpatient basis.
In summary, we demonstrated that the risk of SH was higher in patients with a history of CVD. The patients with established vascular complications such as CVD were found to have a high risk of developing SH. Diabetic education for the prevention of hypoglycemia should be emphasized for patients with previous CVD. Moreover, additional studies are needed to clarify the underlying mechanisms linking CVD and SH.

 XML Download