

 PDF
PDF ePub
ePub Citation
 Print
Print


Introduction
Most patients who undergo surgical repair of tetralogy of Fallot (TOF) have excellent functional outcomes and lead a normal active and social life.1)2)3)4) Nevertheless, almost all patients have some degree of pulmonary regurgitation (PR) as a result of right ventricular outflow tract reconstruction;1)5) and consequently, the chronic volume overload may lead to right ventricle (RV) dilation, biventricular dysfunction, heart failure symptoms, arrhythmias, and sudden death.6)7)8)9) Pulmonary valve replacement (PVR) is commonly undertaken to avoid these adverse outcomes. Since patients often express symptoms late, assessment of objective exercise tolerance by cardiopulmonary exercise (CPEX) testing is a potential tool for the optimal timing of PVR in asymptomatic patients.10) Magnetic resonance imaging (MRI), a gold standard for evaluating RV volumes and function, can also be used to decide the indications for PVR.11) The aim of this study was to investigate the effect of PVR on exercise capacity and determine CPEX parameters-associated with improvement in RV function among patients who underwent CPEX testing and MRI in pre and post PVR period.
Subjects and Methods
Patient selection
A total of 245 patients who underwent PVR for chronic PR after repair of TOF from January 1998 to October 2015 in Sejong General Hospital were retrospectively analyzed. Patients who underwent PVR more than twice were excluded. Patients were also excluded if the PVR was performed percutaneously. The patients who underwent CPEX testing before and after PVR were included only if respiratory exchange ratio (RER) was ≥1.05 in CPEX testing before and after PVR, in order to exclude biased data from patients who stopped exercising for non-cardiovascular reasons.12) The following CPEX parameters were obtained: peak oxygen uptake (VO2peak), percentage of predicted VO2peak, slope of respiratory minute volume to CO2 production (VE/VCO2), anaerobic threshold (VO2at); in addition, the following MRI parameters were analyzed: right ventricular ejection fraction (RVEF) (%), right ventricular end diastolic volume index (RV EDVI), right ventricular end systolic volume index (RV ESVI). Clinical data such as gender, age at study onset, age at PVR, body surface area (BSA) and clinical status were obtained by review of medical records. The study was approved by the Institutional Review Board of Sejong General Hospital.
Cardiopulmonary exercise testing
CPEX testing was performed using modified Bruce protocol on True One 2400 (Parvo Medics, Salt Lake City, UT, USA). All subjects were encouraged to exercise to exhaustion. Heart rate, blood pressure, and oxygen saturation were monitored for the duration of the test. VO2peak (mL/kg/min) was defined as the highest respiratory oxygen uptake (VO2) achieved by the subject during the maximal exercise. VO2 was determined by cardiac output and the difference of oxygen content between arterial and venous blood by the Fick equation.13) Values for VO2peak (mL/kg/min) were indexed to body weight. VO2peak (mL/kg/min) was often presented as a percentage of predicted value, predicted VO2peak (%), which was determined by age, gender, body height, and body weight.14) VE/VCO2 ratio indicates the number of liters of air breathed to eliminate 1 liter of CO2.13) VO2at (mL/kg/min) was defined as the VO2 during exercise at which the blood lactate level began to rise (anaerobic threshold by lactate measurements).15)
Magnetic resonance imaging
Studies were performed using a 1.5-T GyroscanIntera CV system (Philips Medical Systems, Best, The Netherlands). Multiphase acquisition was obtained using steady-state free precession pulse sequence in 2- and 4-chamber planes. From these images, 10 to 12 contiguous short-axis slabs perpendicular to the long axis of the left ventricle were obtained (slice thickness 6 to 8 mm; inter slice gap 0 to 2 mm). Ventricular volumetric analysis was performed using Extended MR Workspace software (Philips Medical Systems, Best, The Netherlands). Stroke volume was calculated by deducting end-systolic volume from end-diastolic volume; and ejection fraction was calculated as percent stroke volume divided by end-diastolic volume.
Data and statistical analysis
All continuous variables were expressed as mean or median±standard deviation. Paired student's t-test was used to compare CPEX and MRI parameters with normal distribution before and after PVR. Patients were divided into 2 groups based on improvement in VO2peak after PVR. The unpaired 2-sample t-test was used to compare the baseline and changes of variables between the two groups. Kolmogorov-Smirniv test and Shapiro-Wilk test were used to assess the normality of distribution. Correlations between CPEX and MRI parameters were tested using Pearson's test for normally distributed variables. SPSS version 18.0 (SPSS Inc., Chicago, IL, USA) was used for statistical analysis, and p<0.05 was considered statistically significant.
Results
Study population
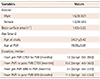
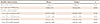
Of the 245 patients, preoperative MRI was performed in 166 and postoperative MRI in 77; and preoperative CPEX in 88 patients and postoperative CPEX in 76 patients. Among the patients who underwent all 4 examinations, only 28 patients showed RER ≥1.05 and were included in the final analysis. The patients' characteristics were shown in Table 1. The group consisted of 16 male patients and 12 female patients. The primary diagnosis was TOF in all patients. The mean BSA was 1.63±0.22 (m2). The mean age at study was 24.21±5.42 years old and the mean age at PVR was 19.95±5.01 years old. The median duration from pre PVR CPEX testing to PVR was 1.0 months (range: 0.0-39.0) and the median duration from PVR to post PVR CPEX testing was 15.0 months (range: 4.0-56.0). The median duration from pre PVR MRI to PVR was 3.5 months (range: 0.0-22.0) and the median duration from PVR to post PVR MRI was 11.5 months (range: 3.0-53.0) (Table 1). Pre PVR CPEX testing and MRI mentioned above refer to CPEX testing and MRI performed before PVR. Also, post PVR CPEX testing and MRI mentioned above refer to CPEX testing and MRI performed after PVR.
The changes of CPEX and MRI parameters after PVR
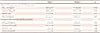
VO2peak (mL/kg/min) was changed from 30.08±4.84 to 29.83±5.16 (p=0.803) and predicted VO2peak (%) was changed from 69.39±14.36 to 67.71±10.84 (p=0.500). In addition, VE/VCO2 ratio was changed from 27.34±3.86 to 26.77±4.70 (p=0.559) and VO2at (mL/kg/min) was changed from 23.82±3.61 to 22.78±4.43 (p=0.194). In conclusion, CPEX parameters showed no significant changes after PVR (Table 2). On the other hand, RV EDVI (mL/m2) was changed from 174.39±24.64 to 121.04±24.89 (p<0.001) and RV ESVI (mL/m2) was changed from 92.21±21.07 to 63.39±18.95 (p<0.001). However, RVEF (%) was changed from 47.74±5.89 to 48.45±7.59 (p=0.623), without significance (Table 2).
The comparisons of CPEX and MRI parameters between the two groups
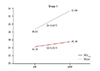
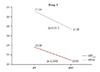
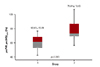
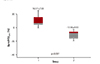
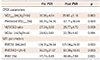
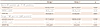
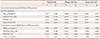
Despite the absence of significant changes in CPEX parameters after PVR, we analyzed the characteristics of the patients who showed improved exercise capacity after PVR. If post PVR VO2peak of patients were increased compared to pre PVR VO2peak (pre PVR VO2peak <post PVR VO2peak), we designated them as group 1. Conversely, if post PVR VO2peak of patients were decreased compared to pre PVR VO2peak (pre PVR VO2peak > post PVR VO2peak), we designated them as group 2. Baseline characteristics between the two groups did not differ statistically (Table 3). However, the exercise capacities of the patients in group 1 improved significantly; the mean VO2at (mL/kg/min) improved from 24.15 to 25.38 (p=0.051), the mean VO2peak (mL/kg/min) from 28.53 to 33.09 (p=0.001) (Fig. 1). On the other hand, the exercise capacities of patients in group 2 decreased significantly; the mean VO2at (mL/kg/min) decreased from 23.58 to 20.83 (p=0.030), the mean VO2peak (mL/kg/min) from 31.24 to 27.39 (p<0.001) (Fig. 2). Baseline Predicted VO2peak (%) value was significantly lower in patients in group 1 (60.83±10.28), as compared to group 2 (75.81±13.83) (p=0.003) (Fig. 3). However, baseline VO2peak, VE/VCO2 ratio, VO2at were not significantly lower in patients belonging to group 1 than group 2 (28.53±5.18 vs. 31.24±4.38, p=0.159, 27.43±3.46 vs.27.27±4.24, p=0.914, 24.15±4.19 vs. 23.58±3.22, p=0.697, respectively). In addition, the changes of VO2peak, Predicted VO2peak (%), VO2at in patients belonging to group 1 were significantly higher than group 2 (4.56±3.60 vs. -3.85±2.51, p<0.001; 10.17±7.63 vs. -10.56±8.03, p<0.001; 1.22±1.94 vs. -2.74±4.58, p=0.009, respectively) (Table 4) (Fig. 4). Group-wise comparisons between baseline MRI parameters and changes in MRI parameters after PVR indicated that baseline RV EDVI and RV ESVI values were lower and baseline RVEF (%) was higher in patients belonging to group 1 than group 2, without significance (165.92±16.35 vs. 180.75±28.22, p=0.093; 86.92±16.87 vs. 96.19±23.47, p=0.235; 48.33±6.13 vs. 47.30±5.87, p=0.657, respectively). Also, the absolute value of changes of RV EDVI, RV ESVI, RVEF (%) in group 1 patients were lower than group 2 patients, without statistical significance. (−47.17±20.32 vs. −58.00±22.36, p=0.193; −24.67±14.73 vs. −31.94±16.48, p=0.231; −0.53±8.81 vs. 1.64±6.54, p=0.481, respectively) (Table 5).
Correlation between RVEF (%) and CPEX parameters in each group
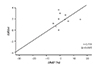
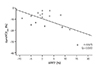
We analyzed the correlations between RVEF (%) on MRI and CPEX parameters (VO2peak, predicted VO2peak (%), VE/VCO2, VO2at) in each group. We first analyzed the correlations between baseline RVEF (%) and baseline CPEX parameters (VO2peak, predicted VO2peak (%), VE/VCO2 ,VO2at) in each group. As a result, we found negative correlation between baseline RVEF (%) and baseline VO2peak (r=−0.590, p=0.043), negative correlation between baseline RVEF (%) and baseline VO2at (r=−0.693, p=0.012) in patients belonging to group 1; on the other hand, patients belonging to group 2 showed no significant correlations. (Table 6). Subsequently, we analyzed the relationships between the changes of RVEF (%) and the changes of CPEX parameters (VO2peak, predicted VO2peak (%), VE/VCO2, VO2at) in each group. The results indicated that patients belonging to group 1 showed a positive correlation between the change of RVEF (%) and the change of VO2at (r=0.733, p=0.007) (Fig. 5); Whereas, patients belonging to group 2 showed a negative correlation between the change of RVEF (%) and the change of Predicted VO2peak (%) (r=−0.575, p=0.020) (Table 6.) (Fig. 6).
Discussion
The detrimental effects of PR after total repair of TOF are now widely known, which, has led to earlier PVR, in most instances before overt symptoms.10) PVR enables volume unloading of the RV, which may be essential for preserving ventricular function. The hemodynamic effects of PVR are assessed by functional class, volumetric changes and exercise tolerance using MRI and CPEX parameters. MRI is the first imaging modality that provides exact quantification of regurgitated volume and RV ventricular volume and mass.16) This MRI information might lead to identification of new quantitative indicators for PVR and facilitate the management of these patients.17) In addition, a better understanding of the effect of altering different pathologic RV loading conditions on CPEX parameters might help to refine the selection criteria and timing of PVR.8) In our study, pre PVR CPEX parameters (VO2peak, predicted VO2peak [%], VE/VCO2, VO2at) showed consistently decreased exercise capacity (Table 2). Low VO2peak is likely the consequence of multiple interrelated factors (ex, RV dysfunction, RV pressure and volume overload) that act synergistically to impair exercise function.19) CPEX parameters showed no significant improvement after PVR in our study, which is consistent with the other studies19)20)21) that showed no improvement in VO2peak after PVR.22) On the other hand, MRI revealed reduced volumes of the dilated right ventricle (RV EDVI, RV ESVI) after PVR, but no significant improvement in RVEF (%) after PVR. However, the pre PVR data may represent an overestimation of the effective ejection fraction, because a regurgitation of the pulmonary or tricuspid valve leads to an increase of the end diastolic volume and therefore, to a higher ejection fraction. Corrected RVEF was calculated as percent effective RV stroke volume divided by RV end diastolic volume.23) Although the RV function did not improved statistically by RVEF on MRI, corrected RVEF indicated improvement of RVEF, preoperative corrected RVEF (%) 21.82±4.51 vs. postoperative corrected RVEF (%) 39.52±9.46 (p<0.001). Thus, if the effects of regurgitation on the measurement of ejection fraction are considered, it may lead to improvement in real RV output after valve replacement.16) Discussion of the many factors that can influence corrected RVEF is beyond the scope of this study. Although no significant improvement in exercise capacity was detected, we tried to determine the characteristics of the patients who showed improvement in exercise capacity. Peak uptake of oxygen (VO2peak) is the most commonly used variable to describe aerobic capacity.24) So we analyzed the characteristics between the two groups divided by VO2peak value (i.e., whether post PVR VO2peak increased or decreased from pre PVR VO2peak). The group-wise comparison showed that the exercise capacities in group 1 patients improved statistically. And predicted VO2peak (%) was significantly lower in increased group (group 1) than decreased group (group 2) unlike other CPEX parameters (VO2peak, VE/VCO2 ratio, VO2at). This finding showed the importance of predicted VO2peak (%) in evaluating exercise capacity of our patients. In addition, the changes of predicted VO2peak (%) were significantly larger in increased group (group 1) than decreased group (group 2). These findings suggested that patients who had significantly lower pre-PVR predVO2peak (%) could improve exercise capacity after PVR. For the relationships between RVEF (%) and CPEX parameters, we found negative correlation between baseline RVEF (%) and baseline VO2peak (r=−0.590, p=0.043), the negative correlation between baseline RVEF (%) and baseline VO2at (r=−0.693, p=0.012) in patients belonging to group 1. Generally, the exercise capacity can reflect the RV function. However, if the exercise capacity is decreased despite preserved RV function, we suggest that such patients need PVR for recovery of exercise capacity, however, further study with more data is required. Positive correlation occurred between the change of RVEF (%) and the change of VO2at in patients belonging to group 1. Thus, the change of VO2at is a more sensitive indicator than VO2peak to predict the improvement of RVEF (%) after PVR; and the change of RV function using the CPEX. VO2peak might be underestimated because of reduced patient motivation, as well as premature termination of exercise by the examiner. VO2at measures the sustainable O2 uptake and is an objective parameter of exercise capacity derived from submaximal exercise testing; and therefore, independent of these influences.25) It corresponds to approximately 70% of the peak oxygen consumption in the symptom-limited maximal exercise and is a simple and noninvasive means for respiratory measurements well before maximal effort.15) Stevenson reported that VO2at was essentially interchangeable with VO2peak.26) The decrease in VO2at is probably caused by earlier onset of anaerobic metabolism due to insufficient blood supply for working muscles, which is a net result of reduced cardiovascular reserve, and reduction in level of physical fitness.27) In this case, despite the rise in RVEF (%), VO2at cannot be increased, contrary to our expectations. On the other hand, exercise training increases submaximal exercise performance. Training delays blood lactate accumulation during submaximal exercise and these changes are associated with an increase in the VO2at.28) In addition, several other factors may play an important role, including skeletal muscle fiber type and motor unit recruitment patterns, glycogen stores, adrenergic stimulation, and skeletal muscle aerobic enzyme content.29) Therefore, it is possible to detect the increase of VO2at without the change of RVEF (%). Finally, negative correlation was found between the change of RVEF (%) and the change of predicted VO2peak (%) in patients belonging to group 2. These findings showed the importance of predicted VO2peak (%) in evaluating exercise capacity repeatedly and deterioration of exercise capacity after PVR. VO2peak likely differs according to age, gender, body weight, body height. Therefore, VO2peak is usually expressed as the predicted VO2peak (%) in evaluating exercise capacity. The predicted VO2peak (%) is the percentage of value which is calculated in consideration of variable factors (age, gender, body weight, body height). It is widely used in the area of congenital heart disease involving TOF. Therefore, it is very important to regularly determine the predicted VO2peak for evaluating exercise capacity after PVR.
Study limitation
Underlying pulmonary function abnormalities limit pulmonary gas exchange response,22) and ultimately, result in a reduced exercise capacity. The reduction in alveoli number, increased alveolar density, decreased lung volume, and decreased vital capacity have been demonstrated in patients with TOF.30) The patients with a lower vital capacity are expected to have a lower VO2peak, a lower breathing reserve. Thus, in order to increase the accuracy of improved exercise capacity after PVR, it might be helpful to perform CPEX testing with pulmonary function test. But, the patients belonging to our study group did not perform the pulmonary function test. In addition, the time intervals between CPEX testing and PVR varied among patients. Since the point that RV function is restored after PVR may differ in each patient, it is necessary to set the time for CPEX testing. Finally, our study was conducted with a retrospective model and a small sample size. Despite these limitations, our study could provide the basis for future study.
Conclusion
PR after TOF repair led to earlier PVR but showed no significant improvement in CPEX parameters after PVR, despite significant decreases in RV volume. However, we could determine the characteristics of improved exercise capacity group and worsening exercise capacity group after PVR. Baseline predicted VO2peak (%) value was significantly lower in patients with significantly improved exercise capacity after PVR than in patients with worsening exercise capacity after PVR. Therefore, we confirmed the importance of predicted VO2peak (%) in evaluating exercise capacity differentiated from other CPEX variables. In addition, the change of RVEF (%) was positively correlated with the change of VO2at. But in patients with worsening exercise capacity post PVR, the change of RVEF (%) showed a negative correlation with the change of predicted VO2peak (%). Therefore, the change of VO2at and predicted VO2peak (%) are sensitive indicators to predict the change of RVEF (%) after PVR.
 XML Download