

 PDF
PDF ePub
ePub Citation
 Print
Print


Introduction
The Asia-Pacific region accounts for about half of the cases of cardiovascular disease (CVD).1) Furthermore, the mortality from coronary heart disease has been steadily increasing in less developed and economically transitioning countries.2) In Korea, diseases of circulatory system including coronary heart disease and stroke accounted for 22% of the entire death in 2012.3) As widely known, high blood pressure is the leading cause of CVD. It is estimated that every 20 mmHg increase in systolic blood pressure (SBP) or 10 mmHg in diastolic blood pressure (DBP) is associated with two times increased risk of mortality from both ischemic heart disease and stroke.4) Prevalence of hypertension was estimated to about 33.3% for male, and 29.8% for female among Korean adults aged 30 years and above in 2012.5) Total medical cost for hypertension was estimated to 2640 billion Korean bills which accounts for 22% of medical cost due to all chronic disorders.6) This implies that controlling hypertension is important for reducing overall disease burden in the society.
It has been shown that elevated SBP is more important than elevated DBP,7)8) because SBP is more closely associated with cardiovascular risk than DBP.9) Multiple clinical studies have shown that elevated SBP is a more reliable predictor for adverse cardiovascular outcomes than elevated DBP.10)11) Isolated systolic hypertension (ISH) is age-dependent because of progressively increasing SBP and decreasing DBP after the age of 55 years.12) Treating ISH can reduce the risk of cardiovascular disease among the elderly.13) In contrast to the abundant epidemiologic data for the Western population,12)14) there is limited data available on hypertension subtypes in the Asian population.15)16)17)18) Moreover, reported prevalence of hypertension subtype among Koreans is limited to a certain age group,18) geographical region,17) and specific subtype.16)
Therefore, the major aim was to evaluate cases of hypertension subtypes among the Korean population. First, the prevalence of overall hypertension and hypertension subtypes in the adult Korean population was estimated. Second, the overall absolute number of people with hypertension was estimated by subtype. With an exploratory aim, secular trends of hypertension subtypes were estimated as well.
Subjects and Methods
Study population
This study was based on the data from the first (1998), second (2001), third (2005), fourth (2007-2009), and fifth (2010-2012) Korea National Health and Nutrition Examination Survey (KNHANES).5)19) The KNHANES is a national representative survey to assess the health and nutritional status of the Korean population. Its target population comprises of nationally representative non-institutionalized civilians in Korea. The KNHANES consists of three distinct surveys: health interview survey, health examination survey, and nutrition survey. The KNHANES selected representative households using a stratified and multi-stage clustered probability sampling method. The sample for each year was the probability sample representing all parts of the country, which was determined by assigning weights to each respondent, where each rolling sample had both homogenous and independent characteristics. To make KNHANES samples represent the Korean population, sampling weights were assigned to participants each year. The final analysis weight, which was applied data analysis, reflects sampling weights. This is meant to correct for unequal selection probabilities and make adjustments for non-response as well as post-stratification samples so as to correct for known discrepancies between the sample and the target population. All participants in the survey signed an informed consent form. The institutional Review Board of the Korea Centers for Disease Control and Prevention (KCDC) approved the protocol.19)
To estimate the current prevalence and absolute number of people with hypertension, adults aged 20 years or older who completed both health examination and health interview survey for the fifth (2010-2012) KNHANES were selected. To assess the secular trend of hypertension and its subtype, data from the first through fifth (1998-2012) KNHANES was analyzed.
Blood pressure measurement
According to the standard protocol, SBP and DBP were measured by trained nurses using a mercury sphygmomanometer (Baumanometer Desk model; Baum, NY, USA) on the right arm of the subject while sitted after taking at least five minutes of rest. To increase the accuracy of blood pressure measurements, blood pressure was measured twice from 1998 to 2001, and the two values were then averaged to determine each participant's SBP and DBP. Since 2005, blood pressure was measured three times, whereby the second and third measurements were averaged.
Definition and classification of hypertension
Hypertension was defined as a SBP≥140 mmHg or a DBP≥90 mmHg, or a case of anti-hypertensive drug use. In this study, hypertension subtypes were divided into treated hypertension and untreated hypertension. Individuals currently taking antihypertensive medication were categorized together as one group referred to as, "treated hypertension," regardless of their actual blood pressure values. Untreated hypertension was further classified into three subtypes as follows: (1) ISH: defined as an average SBP≥140 mmHg and an average DBP<90 mmHg; (2) isolated diastolic hypertension (IDH): defined as an average SBP<140 mmHg and an average DBP≥90 mmHg; and (3) combined systolic and diastolic hypertension (SDH); defined as an average SBP≥140 mmHg and an average DBP≥90 mmHg.
Statistical analysis
All statistical analyses in this study were performed using SAS version 9.2 (SAS Institute Inc., Cary, NC, USA). SAS SURVEY procedures were used to estimate the prevalence of hypertension while accounting for sampling weights. Frequency analysis was mainly used in this study in order to understand demographic characteristics of the data and distribution of hypertension. To estimate prevalence of hypertension and absolute number of patients with hypertension by subtype, data in both men and in women were analyzed separately, because sex and age are well known factors which influence blood pressure levels. When calculating the number of patients with hypertension subtypes, age-standardization was not conducted because the primary aim of this study was to estimate absolute disease weight. However, for the prevalence hypertension, both crude and age-standardized rates were calculated in order to assess the effects of population aging. Age-standardized results were provided as supplementary data.
Results
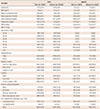
The general characteristics of 17621 people from the fifth KNHANES, which were used to estimate recent prevalence of hypertension, are summarized in Table 1. Mean age of the study population was 51.0 years for men and 50.9 years for women. Means of SBP, DBP, body mass index, waist circumference, fasting glucose and triglyceride were higher in men than in women. However, total cholesterol level was higher in women than in men.
Prevalence of hypertension
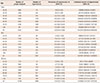
Table 2 shows the prevalence of hypertension and absolute number of people with hypertension in total and by aspects of sex and age. These were estimated using data from the fifth (2010-2012) KNHANES. In adults aged 20 years or older, the overall prevalence of hypertension was 25.8%. When divided by age-group, prevalence of hypertension was 4.9% in 20-29 years, and 71.0% in 80 years or older group. Hypertension tended to be more prevalent in older age groups in both sexes. Men had higher prevalence than women up to 50 years of age, while women had higher prevalence than men in 60 or older years. However, absolute number of patients with hypertension was largest in age group of 50 years (2.4 million) and accounted for 25.4% of the entire hypertension cases. When divided by sex, absolute number of patients with hypertension was the biggest in age 50s among men (1.3 million), and age 60s among women (1.2 million).
Subtype distribution among people with hypertension by sex and age; 2010-2012
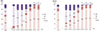
Fig. 1 presents the relative frequency of each hypertension subtype in total and by age, which is separate for men and for women. As age increases, the proportion of treated hypertension progressively increases. Untreated ISH also shows increasing trends with age, partly in age-group that is above 40 years. Treated hypertension accounted for the highest proportion of total hypertension patients both in men (49.5%) and women (72.0%). Among the untreated hypertension subtypes, IDH was the most frequent subtype in younger adults (<50 years). Combined SDH was the most frequent subtype in men and women aged 50-59 years. However, SDH gradually decreased after those ages, and accounted for only 0.3% in men and 1.8% in women aged 80 years or older. On the other hand, ISH was the most common untreated hypertension subtype in people aged 60 years or older. Weighted frequency with 95% confidence interval (CI) and proportion for each hypertension subtype were provided in Supplementary Table 1 (Supplementary Table 1 in the online-only Data Supplement).
Trends in the number of patients for each hypertension subtype
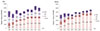
Between 1998 and 2012, the number of patients under treatment has increased remarkably both in men and women. On the other hand, the number of untreated hypertension has been relatively constant. In overall adult population (age≥20 years), there have been more male patients with hypertension than female patients. However, women with hypertension were more likely to take anti-hypertensive medication, such that the number of treated hypertension was bigger in women than in men. Subtypes of SDH and IDH were more common in men than in women, while ISH was more common in women than in men (Fig. 2). As a further analysis, age-adjusted proportion for each hypertension subtype was calculated. Moreover, proportion of treated hypertension has been increased in age-standardized analysis between 1998 and 2012, while proportions of ISH and SDH have been decreased during the same period (Supplementary Table 2 in the online-only Data Supplement).
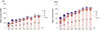
The absolute number of elderly people (age≥65 years) with hypertension shows a generally increasing trend. Among the elderly population, the number of women with hypertension was much bigger than the number of men with hypertension. ISH accounted for the highest proportion among untreated hypertensive subtypes both in men and women, while IDH was lowest (Fig. 3).
Discussion
The present study shows the prevalence of hypertension and absolute number of people with hypertension, which analyzes the national representative data. The recent (2010-2012) percentage prevalence of hypertension among Korean adults was estimated to 25.8% (27.8% in men, 23.8% in women) in the total population, and the estimated number of people with hypertension was over 9.4 million (95% CI 9.0 to 9.9 million).The KCDC has reported that prevalence of hypertension was 29.0% among Korean adults aged 30 years or older.5) However, to evaluate the absolute weight of hypertension, younger adults need to be included for the prevalence of hypertension. Blood pressure during young adulthood predict future risk of cardiovascular events.20)
In the US, the prevalence of hypertension was calculated for adults aged 18 years or older.21) According to the US National Health and Nutrition Examination Survey (NHANES), rates of hypertension control have improved in the United States,22) whereby young adults have consistently low rates of hypertension control compared to middle-aged and older adults.22)23) This is a significant health issue, because young adults with uncontrolled hypertension are at risk for chronic kidney disease and premature strokes, particularly in the presence of diabetes.24)25) According to the report of the fifth KNHANES (2010-2012), young adults (20-39 years) accounted for 10.4% of all hypertension patients. However, this age group accounted for less than 1% of all treated hypertension. This represents only 3.4% of the entire 20s year old of people with hypertension. No data has been published for hypertension awareness and treatment rates among Koreans aged less than 30 years. The official KNHANES reports estimated awareness, treatment and control rates only for hypertensive patients aged 30 years or older.
In this study, about 10% of all patients with hypertension was untreated ISH which corresponds to the prevalence of 2.6% in the entire Korean population. This is lower than the prevalence reported from China (7.6%),15)16) USA (5.6%), and Canada (6.4%).26) In general, it is known that ISH is age dependent,12)27) and is more common in elderly women than elderly men.28) The study shows that the proportion of subjects with ISH became bigger with advancing age in older adults (≥40 years). By contrast, the IDH was more prevalent in adults until age 50s, after which it declined. The data from both the US and Canadian studies were consistent with the data collected in this study. In the US study, the increase in ISH prevalence was steeper for women than for men after the age of 55.26) The prevalence of ISH in women was lower at a younger age, but higher after 65 years of age, according to the results of the Canadian study.26) However, data from the Chinese study showed that the prevalence of ISH in women was higher than in men at all age groups.15) The US and Chinese studies also indicated that the proportion of subjects with ISH increased progressively with increments in the advancing ages, and the prevalence of IDH decreased after middle age.15)29)
Although awareness, treatment, and control rates of hypertension have been improved, the absolute number of people with untreated hypertension remains high in the Korean population. Younger people with hypertension were especially less likely to be treated than older people. Thus, more intense efforts are required for detection and treatment of hypertension in younger adults. With the ageing population, the elderly patients with hypertension are increasingly markedly, and ISH is also becoming more prevalent. Therefore, management of hypertension in the elderly people should be an important health address issue.
This study has several limitations. First, KNHANES data are restricted to the civilian non-institutionalized population. Therefore, results from this study do not represent persons who live in nursing homes, long-term care facilities, or prisons. This means that samples are not easily defensible as being representative of populations due to aspect of potential subjectivity. Second, blood pressure was measured at a single visit, although blood pressure can be measured multiple times during one visit. This may not reflect the usual blood pressure levels. Third, blood pressure was measured only in the office setting, and home blood pressure or ambulatory blood pressure measurement was not available. Thus, the possibility of white coat hypertension or masked hypertension cannot be excluded.30)
In conclusion, the absolute number of people with hypertension has increased consistently over the last decades. Untreated ISH is more frequent in older adults than in younger aged groups, especially for women. In contrast, untreated IDH is common in younger adults, especially for men. Recent (2010-2012) percentage prevalence of hypertension among Korean adults was estimated to 25.8% (27.8% in men, 23.8% in women) in the total population, and the estimated number of people with hypertension was over 9.4 million (95% CI 9.0 to 9.9 million).The KCDC has reported that prevalence of hypertension was 29.0% among Korean adults aged 30 years or older.5) However, to evaluate the absolute weight of hypertension, younger adults need to be included for the prevalence of hypertension. Blood pressure during young adulthood predict future risk of cardiovascular events.20) Further population-based surveillance of hypertension needs to be performed to find subtypespecific risk factors and to develop efficient prevention and management strategies.
 XML Download