

 PDF
PDF ePub
ePub Citation
 Print
Print


INTRODUCTION
The diagnosis of growth hormone deficiency (GHD) in children with short stature is based on clinical features. Children with GHD usually present with short stature and a low growth velocity for age and pubertal stage.1,2 Alternative causes of poor growth need to be considered and excluded. One of the normal variants is idiopathic short stature, a group of short children with no definitely recognizable underlying disease. It is important to distinguish between the child with GH deficiency and the short normal child.
GH secretion is regulated by multiple physiologic factors, including age, onset of puberty, nutritional status, and body weight.3,4,5,6 GH secretion is pulsatile and serum concentrations are low during the daytime. Thus, provocative tests of GH release, rather than a single basal GH estimation, are used to determine GH status. Immunoradiometric assays (IRMAs) are commonly used to determine the level of GH.7
The standard method for the diagnosis of GH deficiency is to confirm insufficient responses to GH provocation tests. GH deficiency is defined as a serum peak GH concentration <10 ng/mL on provocation with a combination of at least two separate stimulation tests.8,9 GH stimulation tests are performed with various stimuli, such as insulin, L-dopa, arginine, and growth hormone releasing hormone (GHRH).10 The test using insulin as a stimulus is classically recommended, but this test has potential risks such as hypoglycemia. In this study, we compared two standard provocation tests, insulin and L-dopa, with a primary focus on specificity, accuracy, and safety.
MATERIALS AND METHODS
1. Subjects
This retrospective study was done by reviewing the medical records of children who visited the pediatric endocrine clinic at Chonnam National University Hospital. A total of 120 children with short stature who completed a GH stimulation test from January 2006 to April 2014 were enrolled in this study. All patients had a height less than the third percentile. Children with central nervous system neoplasms, multiple pituitary hormone deficiencies, and hypothyroidism were excluded. Children who had been taking drugs that may affect endogenous GH secretion, such as antipsychotic drugs and corticosteroids, and children with congenial disorder (e.g., Russel-Silver syndrome) were also excluded.
GH deficiency was defined as a serum peak GH concentration <10 ng/mL on provocation with a combination of at least two separate stimulation tests. Idiopathic short stature (ISS) was classified as a height less than the third percentile with a serum peak GH concentration ≥10 ng/mL with provocation.
Data for height, weight, pubertal status, insulin-like growth factor (IGF-1), insulin-like growth factor binding protein (IGFBP)-3, thyroid function, and peak GH levels after stimulation were collected. Pubertal status was assessed by Tanner stage of breast development for females and genital development for males. Bone age was evaluated by the method of Greulich and Pyle.11 All GHD subjects had normal magnetic resonance imaging findings of the hypothalamic-pituitary region. This study was approved by the Institutional Review Board of our hospital (CNUH-2014-295).
2. GH stimulation test
After an overnight fast, an intravenous cannula was inserted. All provocation tests were performed in the morning hours with a 1-day interval between the two stimulation tests. To assess GH secretion, dopamine (Sinemet®, MSD, Whitehouse Station, NJ, USA; body weight more than 30 kg, 500 mg; body weight 15 to 30 kg, 250 mg; body weight less than 15 kg, 125 mg of L-dopa) was administered orally. Blood samples were drawn immediately before the medication and 30, 45, 60, 90, and 120 minutes later to obtain the serum GH concentration for each time point. Insulin (0.1 IU/kg) was administered as an intravenous bolus at time 0 to induce a fall in the blood glucose level to 50 mg/dL or less (or one-half of the baseline glucose level). Blood samples were obtained immediately before injection and at 15, 30, 45, 60, 90, and 120 minutes after injection. No patients were primed with sex steroids before the provocation tests.
3. Hormone assays
GH levels were measured by IRMA with the detection limit of 0.03 IU/mL. The intra-assay coefficients of variation (CVs) were 1.3% to 2.1%, and the inter-assay CVs were 3.8% to 5.0% (Cisbio Bioassays, France). Serum IGF-1 levels were measured by using an IRMA with an analytical sensitivity of 2 ng/mL, intra-assay CV of 2.4% to 6.3%, and inter-assay CV of 5.3% to 6.8% (IRMA IGF-1, Immunotech, Czech Republic). Serum IGFBP-3 levels were measured by using an IRMA with an analytical sensitivity of 50 ng/mL, intra-assay CV of 4.6% to 10.2%, and inter-assay CV of 6.3% to 12.4% (IDS S.A, Belgium).
4. Analysis
Categorical data were described as number (percentage) and continuous data were presented as the mean±standard deviation (SD). Comparisons between groups were performed by using independent-sample t-tests. Statistical significance was defined as p<0.05. Statistical analysis was performed by using SPSS (version 22.0; SAS Institute, Chicago, IL, USA) and GraphPad Prism (version 5; GraphPad Software Inc, La Jolla, CA, USA). Specificity was defined as the number of true negative results divided by the total number of results. Accuracy was defined as the number of correct results divided by the total number of tests.
RESULTS
1. Subjects' characteristics
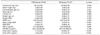
The clinical and laboratory data are summarized in Table 1. Of the 120 children who underwent the GH stimulation test, 83 children (69.2%) were diagnosed with GHD and 37 children (30.8%) were diagnosed with ISS. A total of 83 children (69.2%) were boys and 37 (30.8%) were girls. The mean age of the children was 9.99±2.60 years in the GHD group and 9.64±2.78 years in the ISS group. A total of 92 children (76.7%) were prepubertal (Tanner stage 1) and 28 children (23.3%) were pubertal (Tanner stage 2 or 3). The IGF-1 and IGFBP-3 level of the patients at the time of the stimulation test showed no significant difference in either group. In the GHD group, the mean IGF-1 level was 171.86±96.95 ng/mL, similar to that in the ISS group (170.75±98.60 ng/mL, p=0.954).
The mean body weight standard deviation score (SDS) of the GHD group was -1.59±0.11, which was higher than that of the ISS group of -2.31±0.14, which was a statistically significant difference (p<0.001). Also, the mean body mass index (BMI) SDS of the GHD group was higher (-0.25±0.13) than the mean BMI SDS of the ISS group (-0.98±0.16, p=0.001; Table 1).
2. Comparison of peak GH levels
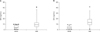
Peak GH levels were achieved on average 45 min after the administration of insulin and L-dopa in both groups. In the test with insulin (peak GH-I), the mean peak GH level of the ISS group (14.71±8.78 ng/mL) was significantly higher than that of the GHD group (4.03±2.60 ng/mL, p<0.001). Also, in the test with L-dopa (peak GH-L), the mean peak GH level of the ISS group (10.62±8.37 ng/mL) was significantly higher than that of the GHD group (5.17±2.63 ng/mL, p<0.001; Fig. 1).
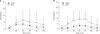
The mean peak time was on average 45 min for both groups for both tests. We also compared the peak GH concentrations versus time after the L-dopa and insulin stimulation tests between the GHD and ISS patients (Fig. 2). In both tests, the peak GH concentration was much higher in the ISS group.
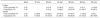
Table 2 shows the differences between the cross-sectional and cumulative frequency of a GH cutoff value of >10 ng/mL at each time point during the insulin and L-dopa stimulation tests in ISS patients. The cumulative frequency at 120 min was 75.6% after insulin stimulation compared with 35.1% after L-dopa.
Also, we compared the specificity and accuracy of the two tests. In the case of insulin, the specificity was 78.4% and the accuracy was 93.6%. On the other hand, the specificity for the L-dopa stimulation test was 29.7% and the accuracy was 79.2% (Table 3).
DISCUSSION
Children with short stature visit the outpatient department for the evaluation of short stature and reduced growth velocity. The diagnosis of GHD is classically based on clinical features, but can only be confirmed by a GH stimulation test using different stimuli.12 Because GH secretion is regulated by multiple physiologic factors, including age, onset of puberty, nutritional status, and body weight, the reliability of the pharmacological tests used for the evaluation of GH secretion has been repeatedly questioned.13,14 However, the GH stimulation test is still considered to be the gold standard when diagnosing GHD. It is defined as a serum peak GH concentration <10 ng/mL on provocation with the combination of at least two separate stimulation tests.15,16,17
Classically, a child whose height is below the third percentile will undergo a GH stimulation test using L-dopa and insulin. A diagnosis is made by assessing the peak GH level.18 If the peak GH level is higher than 10 ng/mL, at any time point on a single test, the child is diagnosed as having ISS.19,20 In both tests with L-dopa and insulin, the mean peak GH level of ISS children was significantly higher than that of the children with GHD.
A relationship exists between body weight, BMI, and GHD. The mean body weight SDS of the GHD group was -1.59±0.11, which was higher than that of the ISS group of -2.31±0.14 (p<0.001), and the mean BMI SDS of the GHD group was higher (-0.25±0.13) than that of the ISS group (-0.98±0.16, p=0.001). According to a recent study, BMI is one of the predictors of peak GH.21 Stanley et al. demonstrated that the peak GH response to a provocative test decreases with increasing BMI SDS in healthy children with short stature.22 A higher BMI is associated with lower GH secretion.23,24,25
The peak GH concentration was higher in the ISS group but the time to the peak GH level was similar in both groups (mean peak time of 45 min). There were differences between the cross-sectional and cumulative frequency of the GH cutoff value of >10 ng/mL at each time point during the insulin and L-dopa stimulation tests in ISS patients. As shown in Tables 2 and 3, the cumulative frequency at 120 min was 75.6% after insulin stimulation compared with 35.1% after L-dopa stimulation. Thus, we suppose that the stimulation test with insulin is better for diagnosing ISS than the test with L-dopa.
One of the most important results of this study was the difference in specificity and accuracy between the two provocation tests (Table 3). Also, the frequency (%) of a GH concentration >10 ng/mL in the ISS group was higher with the insulin test (75.6%) than with the L-dopa test (35.1%). This result suggests that it would be beneficial to perform the ISS test first before the L-dopa test. In this way, ISS patients who show a peak GH >10 ng/mL can be ruled out by use of a single test.
The provocation tests have some side effects because of the drugs used as stimuli.26 L-Dopa can cause adverse reactions, commonly gastrointestinal problems (e.g., nausea, vomiting), and insulin has the potential to induce serious hypoglycemia. Thus, close monitoring for adverse reactions, especially for hypoglycemia during a provocation test using insulin, is needed.27,28 In our study, among the 120 patients who underwent the insulin stimulation test, the lowest serum glucose level was less than 40 mg/dL in 58 patients, and 119 patients showed a glucose concentration under 50 mg/dL. The mean glucose level was 38.5 mg/dL. In a total of 71 patients (59.1%), the lowest glucose level was recorded at 20 min after insulin administration (mean, 21.6 min). The most common hypoglycemic symptom was dizziness, and these patients recovered soon after drinking juice or eating candy. However, one patient with serious hypoglycemia (serum glucose, 21 mg/dL) showed mental change (drowsy mental status) and recovered after intravenous administration of 10% dextrose water.
Considering the outcomes, although the insulin test has the potential to evoke hypoglycemia, we suggest performing the insulin stimulation test first to rule out ISS (with close monitoring for hypoglycemic symptoms) and then the L-dopa test for the remaining patients to confirm the GHD. This is cost-effective because the diagnosis of ISS can be made shortly after a single test. Also, the burden of doing two serial tests is reduced.

 XML Download