

 PDF
PDF ePub
ePub Citation
 Print
Print


INTRODUCTION
Breast cancer is the most frequently diagnosed and the leading cause of cancer death among females worldwide, accounting for an estimated 1.7 million cases and 521,900 mortalities annually. Breast cancer is a serious healthcare burden in women, and is reported in 25% of all cancer cases and 15% of all cancer deaths in females. With its increasing incidence, clinicians aim to establish the standard treatment for breast cancer [1].
Chemotherapy has remarkably improved the outcome of breast cancer. Neoadjuvant chemotherapy (NAC) has been generally accepted in treating breast cancer patients, yet its optimal indication is under investigation. NAC is currently recommended in locally advanced cancers, large-sized tumors or tumors involving the regional lymph nodes [2]. Moreover, NAC is recommended particularly in patients who prefer primary tumor reduction to achieve better cosmesis with breast-conserving surgery, or in patients who require the postponements of surgeries due to medical conditions [2].
Since the concept of NAC has been introduced, significant efforts to determine patients who would most likely benefit from NAC have consistently been made by clinicians and researchers. A few parameters have been suggested as predictors of NAC response. Recent studies demonstrated that better pathological response to NAC is associated with a favorable prognosis, although its association varies among intrinsic subtypes [3]. Subsequently, a few parameters, including hormone receptor (HR) expression, level of Ki67 and expression of other muted genes, used to predict better response to NAC prior to treatment were proposed [4]. These predictive markers however have limited accessibility currently; hence, more convenient biomarkers are required.
Researchers have reported that the host immunologic environment influences cancer progression. The neutrophil-lymphocyte ratio (NLR) has been considered as an indicator of inflammation, and a high NLR has been suggested as a possible predictor of poor outcomes in various cancers. Particularly, neutrophils inhibit the immune system and promote tumor growth by suppressing the activity of lymphocytes and T-cell responses. Moreover, increased tumor-infiltrating lymphocytes (TILs) have also been associated with improved disease-free survival (DFS) in triple negative breast cancer (TNBC) [5]. Furthermore, some studies determined the prognostic value of platelet activation [6]. Platelets secrete a significant number of growth factors. In turn, these growth factors, for example, platelet-derived growth factor (PDGF), transforming growth factor-β and platelet-derived endothelial cell growth factor enhance cancer activities [7]. Moreover, systemic inflammation is known to influence tumor progression and lymphocytes are reported to be essential in coordinating immune response against tumor [8]. Based on these concepts, studies showing increased immunologic biomarkers such as NLR and platelet-lymphocyte ratio (PLR) as predictive biomarkers of breast cancer prognosis have been published [91011]
There are few reports that present the association between NLR, PLR, and NAC response, while considerable studies present the association between NLR, PLR, and prognosis [12]. This study aimed to analyze the predictive value of NLR and PLR for NAC response and evaluate their prognostic role in breast cancer.
METHODS
Patient treatment and blood sample analysis
Data from a total of 105 patients with breast cancer treated with NAC between 2009 and 2017 were analyzed. Exclusion criteria were as follows: patients who were older than 70 years old, who had an American Society of Anesthesiologist Physical Status Classification score higher than 2, and who were concurrently diagnosed with cancers in other organs. All patients underwent anthracycline- and/or taxane-based NAC before surgery. Patients received three to six cycles of anthracycline- and/or taxane-based chemotherapy (three to six cycles of doxorubicin 60 mg/m2 and docetaxel 75 mg/m2 with a 3-week interval, four cycles of doxorubicin 60 mg/m2 and cyclophosphamide 600 mg/m2 with a 3-week interval). Peripheral blood samplings were performed before NAC initiation. NLR was defined as follows: the absolute neutrophil count divided by the absolute lymphocyte count. PLR was defined as follows: the absolute platelet count divided by the absolute lymphocyte count. This study received approval and ethical clearance from the Medical Ethics Committee of the Inje University Busan Paik Hospital (IRB #17-0019). Informed consent was exempted due to the retrospective format of this study.
Immunohistochemical staining and assessment of NAC response
Needle biopsy tissue sections obtained prior to NAC therapy, and surgical tissue sections obtained after NAC therapy, were stained with hematoxylin-eosin and reviewed. Tumor stage was stratified based on the tumor-node-metastasis classification according to the American Joint Committee on Cancer Staging Manual, 7th Edition [13]. Tumor characteristics variables included clinically determined tumor size (cm) and positive lymph nodes obtained. Estrogen receptor (ER)/progesterone receptor (PR) status (ER/PR expression) was defined according to the Allred scoring system. The percentage of stained cells (scores, 0–5) and their staining intensity (scores, 0–3) were determined, and the sum of the intensity and percentage scores was calculated. Allred scores of 0–2 were defined as ER/PR negative, whereas scores of 3–8 were defined as ER/PR positive. Tumor grade (Scarff-Bloom-Richardson classification; grade 1, grade 2, grade 3), Ki67-labeling index (graded low for < 10%, intermediate for 10–20, high for > 20% tumor cells) and human epidermal growth factor receptor 2 (HER-2) status (positive when IHC ≥ 3+, negative when IHC ≤ 1+) were determined. Tumors with equivocal HER-2 status (2+) were subjected to fluorescence in situ hybridization test to confirm c-erB2 positivity (positive when HER-2/17 centromere reference probe [CEP17] ≥ 2.0). Pathological response was evaluated using the Miller-Payne criteria for grading response of solid tumors to chemotherapy based on the following grades: grade 1, no change or some minor alterations in individual malignant cells, but no reduction in overall cellularity; grade 2, minor loss of tumor cells, but overall high cellularity and up to 30% reduction in cellularity; grade 3, 30%–90% reduction in tumor cellularity; grade 4, marked disappearance of > 90% of tumor cells, such that only small clusters or widely dispersed individual cells remained; and grade 5, no invasive malignant cells identifiable in sections from the tumor site [14]. Grades 1–3 were classified into the NAC non-response group, while grades 4 and 5 were classified into the NAC response group.
Patient follow-up and prognostic assessment
Seventy-four patients treated before July 2016 were included for prognostic analysis. Follow-up was performed in the outpatient department. All patients were followed up with physical examination every 3 months and ultrasound or additional imaging studies every 6 months. Overall survival (OS) time was defined as the period from the diagnosis of breast cancer to the time of death from any cause. DFS was defined as a period free from all local, loco-regional and distant recurrences, and progression-free survival (PFS) was defined as time elapsed between treatment initiation and tumor progression or death from any cause.
Statistical analysis
To determine the characteristics of patients, frequency analysis, two independent samples t-test, and χ2 tests were performed. The ability of NLR and PLR to predict pathological responses was analyzed using receiver operating characteristic (ROC) curve analysis. Optimal cut-off values were determined. Logistic regression analysis using forward selection method was performed to determine the association between NAC response and both NLR and PLR cut-off values. Mann-Whitney U test was performed for non-parametric test of the association of NLR and PLR with NAC response. DFS, PFS, and OS were analyzed using the Kaplan-Meier method. Univariate analysis was performed using log-rank test, and multivariate analysis was performed using Cox's proportional hazard model with 95% confidence interval (CI). A p-value < 0.05 was considered statistically significant. Statistical Package for the Social Sciences (SPSS) Statistic software 20 (IBM Corp., Armonk, USA) and MedCalc software version 15.8 (MedCalc Software, Ostend, Belgium) were used for statistical analysis.
RESULTS
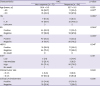
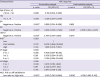
The median follow-up duration was 46 months. The mean age of all patients was 51.1 ± 9.5 years, ranging between 28 and 69 years. A total of 47 (44.8%) patients were > 50 years old. Seventy-one patients were part of the NAC non-response group, while thirty-four patients were part of the NAC response group. Fifty-six patients had HR-positive breast cancer. The NAC response group was composed of patients who were younger (≤ 50 years old) and who had higher histologic grade tumors (grade II, III) (p = 0.077, and p = 0.060, respectively). ER- and/or PR-negative tumors achieved better NAC response (p = 0.004, and p = 0.002, respectively) than ER- and/or PR-positive tumors. HER-2-positive tumors showed better NAC response (p = 0.041) than HER-2-negative tumors. Table 1 presents the clinicopathological characteristics of all patients.
Table 1
Clinicopathological characteristics of all patients according to NAC response
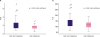
ROC curve analysis proposed the optimal cut-off value of preoperative NLR and PLR for the NAC response group. The NLR cut-off value was ≤ 2.21 (area under the ROC curve [AUC], 0.617; 95% CI, 0.517–0.710; p = 0.030) with 94.1% sensitivity and 38.0% specificity. The PLR cut-off value was ≤ 143.36 (AUC, 0.618; 95% CI, 0.518–0.711; p = 0.040) with 85.3% sensitivity and 39.4% specificity (Figure 1). The non-parametric test of NLR and PLR using Mann Whitney-U test showed p = 0.053, and p = 0.051, respectively (Figure 2).
Figure 1
ROC curve analysis for the cut-off value to predict NAC response (A) cut-off value of NLR (B) cut-off value of PLR. NLR cut-off was ≤ 2.21 with 94.1% sensitivity and 38.0% specificity. PLR cut-off was ≤ 143.36 with 85.3% sensitivity and 39.4% specificity.
ROC = receiver operating characteristic; NAC = neoadjuvant chemotherapy; NLR = neutrophil-lymphocyte ratio; PLR = platelet-lymphocyte ratio.
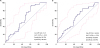
Figure 2
Non-parametric analysis of NLR and PLR with NAC response. (A) NAC response and NLR demonstrated tendency of correlation (p = 0.053, Mann-whitney U). (B) NAC response and PLR demonstrated tendency of correlation (p = 0.051, Mann-whitney U).
NLR = neutrophil-lymphocyte ratio; PLR = platelet-lymphocyte ratio; NAC = neoadjuvant chemotherapy.
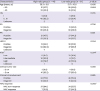
According to the cut-off value of NLR and PLR obtained from the ROC curve, patients satisfying both NLR and PLR cut-off levels (low-ratio group) were selected and compared with those who did not (high-ratio group) (Table 2). Forty-four patients were part of the high-ratio group, and sixty-one patients were part of the low-ratio group. The low-ratio group had a better tumor response rate of 44.3% reaching a NAC response of greater than 90%, while the high-ratio group had a tumor response rate of 15.9%, reaching a NAC response of 90% (p = 0.002). The high-ratio group had higher Ki67 levels (p = 0.034) than the low-ratio group. On the contrary, they were not associated with age, histologic grade, ER, PR, HER-2, tumor size, and nodal status (Table 2).
Table 2
Clinicopathological characteristics of all patients according both cut off satisfaction
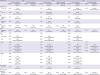
According to logistic regression analysis of NAC response, the low-ratio group significantly demonstrated higher NAC response than the high-ratio group (odds ratio [OR], 4.197; 95% CI, 1.619–10.884; p = 0.003) in univariate analysis. Consistent with the result, multivariate analysis revealed significant association between the low-ratio group and NAC response (OR, 4.139; 95% CI, 1.498–11.431; p = 0.006). Patients with ER-negative, PR-negative, and HER-2-positive tumors showed better NAC response in univariate analysis (p = 0.005, p = 0.002, and p = 0.043, respectively). In multivariate analysis, the low-ratio group and PR-positive breast cancers were considered as significant factor in achieving NAC response (Table 3).
Table 3
Univariate and multivariate analysis of NAC response
NAC = neoadjuvant chemotherapy; OR = odds ratio; HG = histologic grade; ER = estrogen receptor; PR = progesterone receptor; HR = hormonal receptor; cT stage = clinical T stage; cN stage = clinical N stage; NLR = neutrophil-lymphocyte ratio; PLR = platelet-lymphocyte ratio.
*Ki67: low for < 10%, intermediate for 10–20, high for > 20% tumor cells. †The p-values with statistically significance.
A total of six patients had breast cancer recurrence, and four of them died from breast cancer. Only one out of six patients who experienced recurrence was part of the low-ratio group, and showed recurrence of axillary lymph node metastasis. The high-ratio group had five recurrences; three cases of recurrences of distant metastasis, one had recurrence of axillary node metastasis, and the last case had recurrence of axillary and supraclavicular lymph node metastasis with subareolar recurrence. The NLR and PLR were not significantly associated with both DFS and PFS (Figure 3). All mortality cases in this study were noted in the high-ratio group. In univariate survival analysis, the low-ratio group had higher DFS and PFS (p = 0.046, and p = 0.040, respectively) than the high-ratio group. Univariate analysis revealed that the low-ratio group had tendency of better OS than the high-ratio group (p = 0.078) (Figure 4). Moreover, in multivariate analysis, the low-ratio group had significantly better PFS (p = 0.049), and tendency of better DFS (p = 0.054) than the high-ratio group. OS did not show meaningful association with the variables in multivariate analysis. HR-positive tumors were tend to have better DFS and PFS (p = 0.088, and p = 0.078, respectively) in univariate analysis. HER-2-negative tumors demonstrated significantly better DFS (p=0.043) and tendency of longer PFS and OS (p = 0.052 and p = 0.092 respectively) in univariate analysis. Clinical T stage was significantly associated with OS in univariate analysis, but was not associated with OS in multivariate analysis. (Table 4).
Figure 3
Correlation of prognosis and NLR and PLR index in terms of DFS and PFS. (A) DFS and NLR did not demonstrate significant correlation (p = 0.306, Log rank) (B) PFS and NLR did not demonstrate significant correlation (p = 0.281, Log rank) (C) DFS and PLR did not demonstrate significant correlation (p = 0.326, Log rank) (D) PFS and PLR did not demonstrate significant correlation (p = 0.349, Log rank).
NLR = neutrophil-lymphocyte ratio; PLR = platelet-lymphocyte ratio; DFS = disease-free-survival; PFS = progression-free-survival.
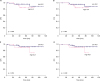
Figure 4
Correlation of prognosis and both cut-off satisfaction in terms of DFS, PFS and OS. (A) The Low-index group demonstrated longer DFS (p = 0.046, Log rank). (B) The Low-index group demonstrated longer PFS (p = 0.040, Log rank). (C) The Low-index group demonstrated tendency of longer OS (p = 0.078, Log rank).
DFS = disease-free-survival; PFS = progression-free-survival; OS = overall survival.
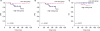
Table 4
Univariate and multivariate survival analysis
DFS = disease free survival; PFS = progression free survival; OS = overall survival; CI = confidence interval; HG = histologic grade; ER = estrogen receptor; PR = progesterone receptor; HR = hormonal receptor; cT stage = clinical T stage; cN stage = clinical N stage; NAC = neoadjuvant chemotherapy; NLR = neutrophil-lymphocyte ratio; PLR = platelet-lymphocyte ratio.
*Ki67: low for < 10%, intermediate for 10–20, high for > 20% tumor cells. †The p-values with statistically significance or with a tendency to statistical significance.
DISCUSSION
It is now evident that the host immunologic environment influences early neoplastic progression and malignant conversion. Currently, inflammatory cells, and their production of chemokines and cytokines, are widely accepted as promoters of cancer progression [15]. Neutrophils produce cytokines, and excess of neutrophil infiltration in malignant tissue accelerates angiogenesis, resulting in adverse outcomes. Moreover, a high platelet count is associated with more advanced stage, metastasis, recurrence rates in various cancers, and poor prognosis [161718]. The carcinogenic mechanism of platelets is attributable to the similarity between its growth factor and oncogene products. The functional homology between the PDGF receptor and oncogene products promotes PDGF mediated expression of cellular counterparts of myc and fos [19]. Benoy et al. [20] demonstrated an association between platelet count and angiogenesis. Moreover, platelets aggravates tumor advancement by enhancing metalloproteinase-9 secretion [21]. Additionally, malignant conditions might increase platelet count. Pro-inflammatory mediators, such as interleukin (IL)-1, IL-3, and IL-6, are produced by several cancer cells, thereby stimulating platelet progenitor cells to proliferate.
The role of lymphocytes in the tumor microenvironment has been highlighted for its antitumor effect, and recent evidences presented that more favorable prognosis could be expected when more TILs are present in breast cancer tissues [22]. CD4+ T-helper 1 cells enhance antigen presentation through cytokine secretion and activation of antigen-presenting cells. CD8+ cytotoxic T-cells play a crucial role in tumor destruction [23]. Considering these data and the relatively immune-dependent characteristics of breast cancer, monitoring host inflammatory status is considered essential breast cancer treatment. Based on this knowledge, the NLR or PLR in peripheral blood are considered as possible indicators of breast cancer prognosis. Previous studies determined the prognostic value of the NLR and PLR in breast cancer. Koh et al. [24] showed that high NLR and PLR levels are indicators of poor prognosis in breast cancer. Several studies assessed the prognostic role of NLR according to molecular subtypes. Others considered that increased NLR is an adverse prognostic marker in luminal A breast cancers [25]. Other study asserted that NLR has prognostic value in TNBC patients [17]. Controversies regarding the role of PLR in predicting cancer prognosis exist. Azab et al. [26] analyzed the prognostic values of PLR and NLR and reported that NLR was a reliable predictor of prognosis, while PLR was not. However, other researchers in a study with 793 breast cancer patients revealed that increased PLR is a significant prognostic factor [9]. In our study, the low-ratio group showed higher PFS than the high-ratio group in both univariate and multivariate analyses. Additionally, univariate analysis revealed that the low-ratio group showed better survival in terms of DFS than the high-ratio group, and multivariate analysis revealed that the low-ratio group had tendency of higher DFS than the high-ratio group. In this study, neither NLR nor PLR had a significant predictive role for DFS and PFS in themselves. This suggests that combination of these two markers might enhance their ability as prognostic markers compared to that of one parameter alone. We could not identify a significant association between these parameters and OS, and only tendency of association was presented in univariate analysis. This result might be due to the relatively short follow-up duration and small number of patients.
To the best of our knowledge, so far, there has been only one study that examines the value of the combination of NLR and PLR as a predictor of NAC response, and our study is the first study that evaluates the value of the combination of NLR and PLR as a prognostic factor of breast cancer patients treated with NAC as well [27]. Few predictors, such as imaging studies and the transmembrane glycoprotein Mucin 1 (MUC-1) antigen (CA 15-3) levels, of NAC response are available; however, their use is significantly limited because of their expensive price and low sensitivity. Moreover, few predictive markers have simultaneously shown reliable ability as prognostic markers [28]. Furthermore, our study identified the potential efficiency of NLR and PLR in terms of cost and extensive utilization.
Insufficient data toward association between NLR, PLR, and NAC response are available, while analysis of the correspondence of outcomes of breast cancer with NLR and PLR has been reported [29]. The present study demonstrated that low NLR and PLR was a potential predictor of better NAC response. The NLR and PLR cut-off values had high sensitivity (94.1%, and 85.3%, respectively) for indicating better NAC response individually, showing their potential as reliable screening tools. The non-parametric test of NLR and PLR using the Mann Whitney-U test could not sufficiently reveal their potential role as individual predictors with insignificant p values (p = 0.053, and p = 0.051, respectively). However, when both cut-off values were combined, their predictive value for NAC response increased with significant p-values in both univariate and multivariate analyses. The sensitivity of the predictive model was 79% and we believe that this could be a possible cost-effective marker in predicting NAC response. Moreover, although their specificities were relatively low when employed independently (38.0% and 39.4%, respectively), when both cut-off values were applied, the specificity increased to up to 52%. This was consistent with the result of outcome prediction, suggesting that the combination of NLR and PLR might enhance their prognostic role of NAC response.
This study has several limitations. First, our single-center study comprised small number of patients that might be insufficient to represent the entire breast cancer population. Due to the small cohort size, the complete evaluation of OS and DFS was limited. While low-ratio group showed correlation or tendency with better DFS, PFS and OS, NAC response itself did not reveal any association, which might be mainly due to the insufficient sample size. Second, the study population showed heterogeneity in terms of molecular subtypes. This might have also led to unclear association of prognosis and NAC response. The response to NAC is generally known to be related to the prognosis of breast cancer; however, a recent study demonstrated that the association differs between subtypes. In this study, HER-2-positive and TNBC tumors showed highest correlation between pathologic complete response rate and prognosis [30]. Our study included a considerable number of HR-positive breast cancers in the survival analysis. This heterogeneity is due to our inclusion of every patient treated with NAC without intentional selection. Therefore, further studies should be conducted for additional assessments.
NLR and PLR are significantly cost-effective and less time consuming, and their prognostic values are certainly appealing. However, these parameters have the fallowing disadvantages: vulnerability to alteration in various conditions. Increased neutrophil and platelet counts are often caused by inflammatory diseases, such as connective tissue disorders, administered medications, bacterial diseases, or viral infections. The most common cause of low lymphocyte counts is a recent infection. Additionally, lymphocytopenia may also be caused by infections, malnutrition, connective tissue disorders, severe stress, intense physical exercise, and medical treatments. Another limitation of our study is its inert retrospective study design and relatively small sample size. Nevertheless, our study suggests an efficient potential tool that can facilitate the selection of better candidates for NAC.
In this study, the combination of NLR and PLR was suggested as an improved predictive model for NAC response with a potential role as screening tools. Furthermore, NLR and PLR combination demonstrated significant prognostic role in breast cancer patients who received NAC. Future studies with subgroup analysis, larger population, and longer follow-up duration are required to validate our findings.
 XML Download