

 PDF
PDF ePub
ePub Citation
 Print
Print


INTRODUCTION
Dendritic cells (DCs), monocytes, and macrophages traditionally comprise the mononuclear phagocyte system [123]. DCs are a class of bone marrow-derived cells found in the blood, epithelia, and lymphoid tissues, and are the most efficient antigen presenting cells [45]. DCs are equipped with molecular sensors and antigen processing machinery to recognize pathogens, integrate chemical information, and guide immune responses [13].
DCs act as messengers between innate and adaptive immunity, and, importantly, several cancers exhibit dysfunction of DCs [16]. It is well established that DCs play a central role in the induction of antitumor immune responses [7]. The important role of DCs in cancer has been shown in a number of reports in which the presence of DCs in a tumor was associated with the clinical prognosis of the disease [8]. Previous studies have revealed that the infiltration of a tumor with different subtypes of immune cells, including DCs, is closely associated with prognosis and/or response to anticancer treatment.
DCs constitute a heterogeneous population of cells with different developmental pathways and at different stages of maturation [1910]. At least 2 DC lineages have been identified: conventional myeloid DCs (mDCs), which include Langerhans cells and interstitial DCs, and the newly defined lymphoid-related plasmacytoid DCs (pDCs) [110].
In this report, we focused on the subpopulation of DCs circulating in peripheral blood. We investigated circulating mDCs and pDCs using markers specific for these DCs in the blood: blood DC antigen (BDCA)-1 and BDCA-2, respectively. We quantitatively evaluated the percentage of mDCs and pDCs in the peripheral blood of patients with breast cancer using fluorescence activated cell sorting (FACS) assays and then correlated the levels of circulating DCs with clinicopathologic characteristics of breast cancer patients.
METHODS
Materials
From January 2013 to November 2013, peripheral blood samples of 53 untreated stage I, II, and III breast cancer patients at single institution, ranging in age from 29 to 80 years, were collected before surgery. Stage 0 and stage IV patients were excluded. All patients had breast cancer with no prior chemotherapy. Forty-one healthy age-matched volunteers served as controls. Informed consent was obtained from each individual, and the protocol of this study has been approved by the relevant Institutional Review Board (IRB No. ECT 12-14A-03).
Preparation of peripheral blood mononuclear cells
After anesthesia, 5 mL peripheral blood samples were collected in heparinized tubes before surgery and immediately processed. Mononuclear cells were isolated by density gradient centrifugation using the Ficoll Paque Plus (Amersham Biosciences, Freiburg, Germany) protocol. Interphase cells were removed, washed twice in cold phosphate-buffered saline (PBS) without Ca2+ and Mg2+ (Biomed, Krakow, Poland) supplemented with 0.5% bovine serum albumin and 2 mM ethylenediaminetetraacetic acid (Sigma, Darmstadt, Germany), and then resuspended in the same buffer.
FACS assays
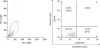
The cells were collected, washed with PBS, and resuspended in 500 μL of PBS containing phycoerythrin-conjugated anti-human CD1c antibody (Novus Biologicals, Littleton, USA) and allophycocyanin-conjugated anti-human CD303 antibody (Dendritics, Lyon, France), as recommended by the manufacturers. After antibody binding for 1 hour at room temperature, the cells were rinsed 3 times with PBS. Non-specific staining was inhibited by adding 20 μL of FcR blocking reagent (Miltenyi-Biotec, Bergisch Gladbach, Germany). Cells were analyzed using a FACS Calibur™ flow cytometer (Becton Dickinson Biosciences, San Jose, USA). An acquisition gate was established based on forward scattered light and side scattered light that included both the lymphocyte and monocyte populations (mononuclear cells) and excluded dead cells and debris. Each measurement contained 100,000 total events per sample. After acquisition, the cells were analyzed with CELLQuest software™ (Becton Dickinson Biosciences) (Figure 1).
Statistics
Peripheral blood DC immunophenotypes were correlated with clinicopathologic data of breast cancer patients. Student's t-test and analysis of variance were performed to compare the independent groups. SPSS software 22.0 (SPSS, Chicago, USA) was used to perform a simple linear regression analysis and multiple regression analysis. A value of p < 0.05 was considered statistically significant.
RESULTS
The demographics of the patients studied are shown in Table 1. The mean age of patients was 51.8 ± 11.6 years. Twenty-five (47.2%) patients had tumors in pathological TNM (pTNM) stage I, 23 (43.4%) patients had tumors in pTNM stage II, and 5 (9.4%) patients had tumors in pTNM stage III. Twenty-two (41.5%) patients had tumors of the luminal A subtype, 21 (39.6%) patients had tumors of the luminal B subtype, 5 (9.4%) patients had tumors of the human epidermal growth factor receptor 2 (HER-2) subtype, and 5 (9.4%) patients had tumors of the triple negative breast cancer (TNBC) subtype. T stage, N stage, estrogen receptor (ER) status, progesterone receptor (PR) status, HER-2 status, Ki67 index, histologic grade, nuclear grade, and lymphovascular invasion (LVI) of patients are shown in Table 1.
Table 1
Values of various circulating mDCs and pDCs parameters and DC ratios according to the clinicopathologic features in 53 breast cancer patients
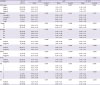
Data are shown as mean ± standard deviation or number (%).
mDC = myeloid dendritic cell; pDC = plasmacytoid dendritic cell; DC = dendritic cell; HER-2 = human epidermal growth factor receptor 2; TNBC = triple negative breast cancer; ER = estrogen receptor; PR = progesterone receptor; HG = histologic grade; NG = nuclear grade; LVI = lymphovascular invasion.
*Student t-test.
The phenotypes of circulating pDCs and mDCs were determined using FACS (Figure 1). In the group of patients with breast cancer, the mean percentage of circulating mDCs was 5.99 ± 3.71% in peripheral blood mononuclear cells and the percentage of circulating pDCs was 5.17 ± 4.71% (Table 2). A comparison of DC subsets between breast cancer patients and healthy donors showed that the percentage of circulating pDCs was significantly higher (p = 0.046) in patients with breast cancer than in the control group, 5.17 ± 4.71 and 3.40 ± 3.43, respectively (Table 2).
Table 2
Percentage of circulating mDC and pDC in breast cancer patients and controls

| Variables | Cancer group (n = 53) | Normal group (n = 41) | p-value |
|---|---|---|---|
| Circulating mDC | 5.99 ± 3.71 | 5.63 ± 3.19 | 0.634 |
| Circulating pDC | 5.17 ± 4.71 | 3.40 ± 3.43 | 0.046* |
Analyses of correlations in the circulating DC immunophenotypes with the clinical and pathological data of breast cancer patients revealed no relationships between the levels of circulating DCs with tumor stage and intrinsic subtype. ER positive breast cancer patients had higher levels of circulating mDCs than ER negative patients (6.57 ± 3.85 and 3.77 ± 1.99, respectively; p = 0.025), and HER-2 positive breast cancer patients had higher levels of circulating pDCs than HER-2 negative patients (8.02 ± 5.19 and 4.34 ± 4.28, respectively; p = 0.040). No relationships were observed with T stage, N stage, Ki67 index, histologic grade, nuclear grade, and LVI (Table 1). Further, no significant relationships were observed between the ratio of mDCs:pDCs and these prognostic factors (Table 1).
In simple linear regression analyses, ER positive breast cancer patients had higher levels of circulating mDCs than ER negative patients, with an unstandardized coefficient of 2.797 and a regression coefficient of 2.316 (p = 0.025). Patients with HER-2 positive breast cancer had higher levels of circulating pDCs than HER-2 negative patients, with an unstandardized coefficient of 3.680 and a regression coefficient of 2.498 (p = 0.016). In multiple regression analysis, patients with HER-2 positive breast cancer had higher levels of circulating pDCs than did HER-2 negative patients (p = 0.026).
During the mean follow-up period (50.1 ± 11.1 months), 3 cases of cancer recurrence were recorded. The mDC value, pDC value, tumor stage, intrinsic subtype, ER status, PR status, HER-2 status, and Ki-67 index of these patients with recurring cancers are shown in Table 3.
Table 3
Recurrence cases

DISCUSSION
It is clear that immune response against cancer cells is impaired in cancer patients [1112]. Cancers can have many characteristics that prevent an effective immune response [12]. Meanwhile, the presence of functionally competent DCs is crucial for effective tumor control and for the success of cancer immunotherapy. Sufficient research is available to provide evidence of the inappropriate function of DCs in cancer [411]. Particularly, Gabrilovich et al. [13] first isolated DCs from the peripheral blood of patients with breast cancer and demonstrated significant reductions in the ability to cluster and to stimulate immune responses by DCs.
In the present study, immune response was evaluated by analyzing the immunophenotypes of DCs. We also investigated the differences in mDCs and pDCs circulating in the peripheral blood of breast cancer patients. For routine, repetitive monitoring, a blood test is better than resection of the tumor or tumor biopsy. Analysis of cell suspensions from blood also permits application of FACS for better characterization of DC subset types compared to what can be achieved with immunohistochemistry in tissue sections [14].
We found statistically significant differences in pDCs between breast cancer patients and healthy donors (p = 0.046). The levels of circulating DCs, especially pDCs, in breast cancer patients were significantly higher than in normal controls. The levels of circulating mDCs in breast cancer patients were also higher than those in normal controls, although this difference was not statistically significant. These results are contrary to the findings of Wojas et al., [15] who reported no significant differences in either population of DCs between breast cancer patients and healthy donors. The p value 0.046 of our study was marginal though it was statistically significant. The role of tumor-associated pDCs remains controversial, with various studies indicating that pDCs play an immunosuppressive role and facilitate tumor progression and others showing that the presence of activated tumor-associated pDCs results in tumor regression in mice [16]. Clearly, further investigations are needed to clarify the role of pDCs in cancers.
The present study focused on investigating the prognostic relevance of circulating mDCs and pDCs separately. Few studies have noted the importance of pDCs and their influence on mDCs and vice versa [141718]. Our study results show that ER positive breast cancer patients had higher levels of circulating mDCs than ER negative patients (p = 0.025) and HER-2 positive breast patients had higher levels of circulating pDCs than HER-2 negative patients (p = 0.040). This difference may be due to recruitment of DCs into the tumor, which may deplete these cells from the peripheral blood [1419]. Moreover, it has been shown that infiltration of pDCs into the tumor microenvironment is associated with poor outcomes in early breast cancer patients [820]. Although we did not find any correlations of specific DCs immunophenotypes with prognosis of breast cancer patients, there were some relationships between DCs and prognostic factors, such as ER status and HER-2 status, in these patients. In multiple regression analysis, patients with HER-2 positive breast cancer had higher levels of circulating pDCs than HER-2 negative patients (p = 0.026). The HER-2 subtype was an independent factor associated with DC % in peripheral blood. Though considering the small number of studied patients, our study suggests immunogenicity of HER-2; HER-2 is considered to be a good candidate for immunotherapy in breast cancers [21]. Active immunotherapy approaches, such as a DC vaccine against HER-2-overexpressing breast cancers, are currently under clinical investigation [2122]. Bailur et al. [23] reported that patients with low mDC:pDC ratios who also had a CD8+ T-cell response to HER-2 had better survival compared to those with high mDC:pDC ratios and no CD8+ T-cell response to HER-2 [14]. Unexpectedly, our study found no significant relationships between mDC: pDC ratios and prognostic factors.
This is a pilot study and its small sample size could be a limitation. Recent studies reported that CD1c might not be an ideal marker for DCs [24]. CD1c positive cell populations can contain other cell types including lymphocytes (Supplementary Figure 1) [24]. Additionally, due to the short follow-up period, it was impossible to evaluate the prognostic significance of DCs. Only 3 cases of cancer recurrence were recorded, and all of those patients had high TNM stage or a high Ki-67 index with TNBC subtype. We found that lower levels (2.83 ± 1.13 vs. 6.17 ± 3.73) of circulating mDCs correlated (p = 0.009) with the patients with recurring. It appears that not only known prognostic factors, such as tumor stage, intrinsic subtype, and Ki-67 index, but also the amount of circulating DCs can affect cancer recurrence. Interestingly, the pDC value in patient 3, whose HER-2 status was positive, was higher than the mean pDC value of 5.17 ± 4.71 in all breast cancer patients. Further investigations with long term follow-up results are warranted. Our present study is a pilot in which the quantitative analysis of DCs was performed. From the analysis results, we conclude that pDCs are increased in the peripheral blood of breast cancer patients, and patients with HER-2 positive breast cancer have higher levels of circulating pDCs than HER-2 negative patients. Further investigations are warranted to prove the prognostic role of DCs in breast cancer patients.
 XML Download