

 PDF
PDF ePub
ePub Citation
 Print
Print


INTRODUCTION
Breast cancer is the most prevalent type of cancer among women around the world and has the highest fatality rate [1]. The most reliable detection methods are mammography and core needle biopsy. However, these methods are not sensitive or comfortable enough for women to select as routine examinations. For liquid biopsy, existing markers such as carcinoembryonic antigen or carbohydrate antigen 153 are not recommended for screening or diagnosis of breast cancer because of their low sensitivity in early detection [2]. Therefore, a convenient, effective method for early detection is urgently needed.
MicroRNAs (miRNAs) are noncoding RNAs approximately 22 nucleotides in length. Recent evidence [34] demonstrates that miRNAs could be utilized as biomarkers for different cancers. They widely regulate life processes including cell proliferation, differentiation, apoptosis, and metabolism through a complicated network of the miRNAs and their target genes. Mitchell et al. [5] identified miR-16, let-7a, and other miRNAs from plasma RNA isolated from healthy volunteers and found that these miRNAs remain intact and are safe from endogenous RNase. Other studies [67] identified specific expression patterns of serum miRNAs for lung cancer, colorectal cancer, and diabetes, and found that the levels of miRNAs in unfrozen serum remained stable over a 4 hours period at room temperature and are minimally affected by twice freezing and re-thawing. These result suggested there are stable and detectable miRNAs in serum that can serve as nonintrusive biomarkers in tumor diagnosis.
Wang et al. [8] suggested tumor cells could communicate with each other by exporting specific miRNAs. miRNAs with consistent expression status in tumor tissue and serum samples are likely to be message molecules released from tumor tissue to the circulatory system, which can be used as indicators for tumor detection. Previous studies [9] suggested there are miRNAs whose expression deregulation status was consistent between tumor tissue samples and serum samples. Thus, effective miRNA signatures identified from tissue profiles may also be prospective serum miRNA signatures.
Large scale tumor data from cancer databases have been used widely in research to obtain reliable evidence. The Cancer Genome Atlas (TCGA) is one of these preeminent databases, which contains information on over 1,000 breast cancer cases, including clinicopathological information and transcriptomic data. The present research is based on tissue-originated public miRNA expression profiles from TCGA, aiming to establish a novel method for identifying effective miRNA signatures which can detect early breast cancer in patients.
METHODS
Data and serum samples
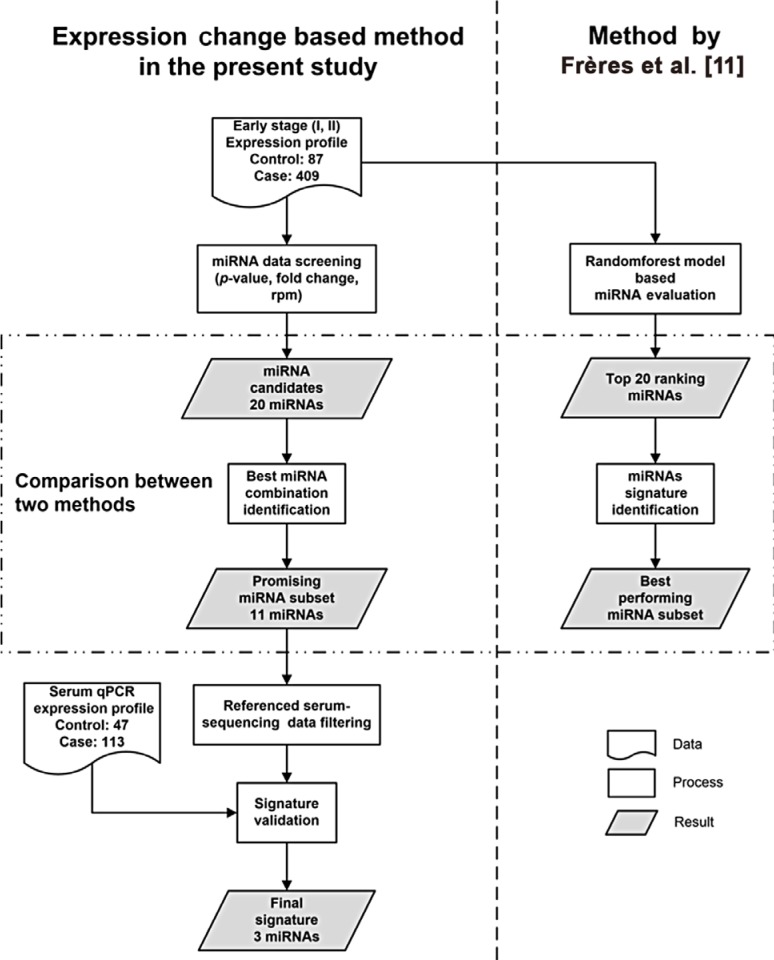
The present study consists of two stages: signature discovery stage and signature validation stage. Analysis design and strategies are summarized in Figure 1.
In the discovery stage, the sequencing data normalized as reads per million (RPM) of mature miRNAs was downloaded from the breast cancer project of TCGA (containing information from 99 stage I patients, 310 stage II patients, and 87 healthy controls) through Broad GDAC Firehose data portal (http://gdac.broadinstitute.org/). These data were used in method establishment and identifying prospective tissue-based signatures.
In the validation stage, 113 breast cancer patients in early stages and 47 healthy controls from Sun Yat-sen University Cancer Center were recruited as the validation cohort. Serum of the subjects was collected based on the following criteria: (1) collected at diagnosis before receiving any surgery or treatment; (2) breast cancer serum samples were collected from patients diagnosed as having early breast cancer, including invasive breast cancer at stage I, stage IIA, or stage IIB; (3) control serum samples were collected from healthy volunteers without any history of cancer or inflammatory conditions currently.
Serum samples were prepared by retaining the supernatant after double centrifugation of blood samples at 4℃ (10 minutes at 3,000 rpm and 10 minutes at 13,400 rpm) and stored at −80℃ immediately until use. In the present study, the tumor stage was classified according to the revised American Joint Committee on Cancer tumor-node-metastasis (TNM) classification. Histopathological information was obtained by reviewing medical records. This study followed the principles outlined in the Helsinki Declaration and was reviewed and approved by the Institutional Review Board and Ethics Committee of Sun Yat-sen University Cancer Center (GZR2017-186). Written informed consent was obtained from all of the enrolled participants.
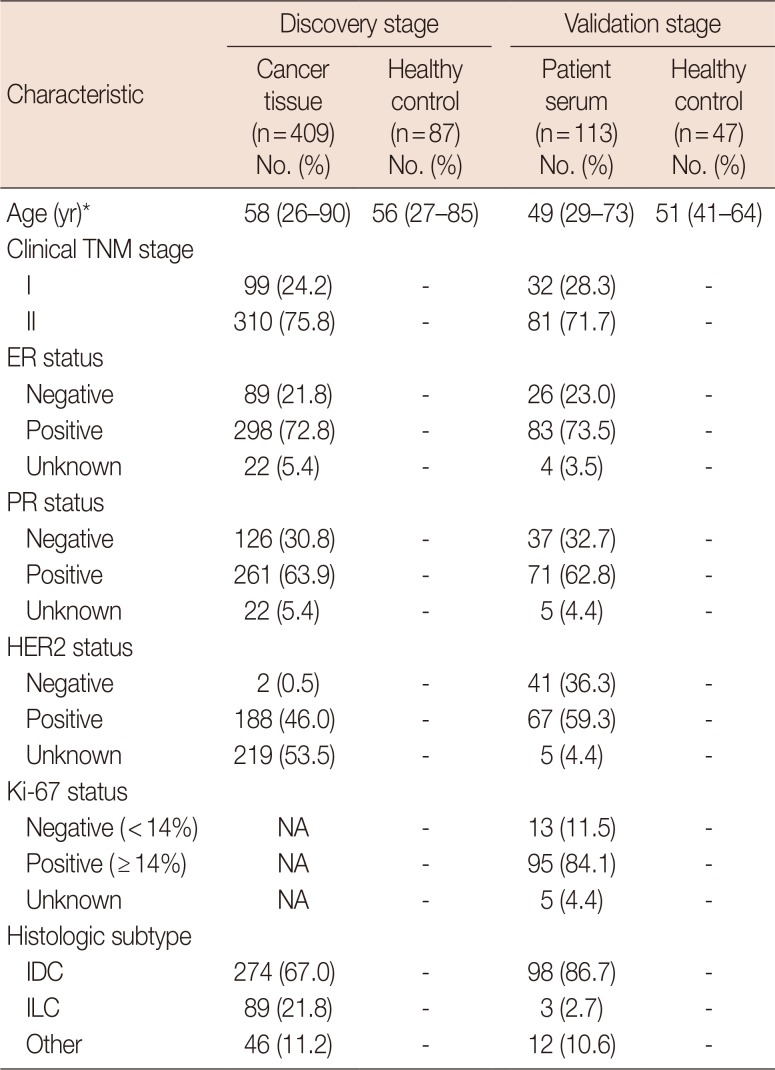
The characteristics of patients enrolled in the present study were summarized in Table 1.
Establishment of expression change based method for signature identification
To concisely identify biomarkers of early stage breast cancer, only data of early stage patients were selected from the complete dataset. Missing expression values were replaced by the stage average value, and miRNAs with data missing rate >10% were eliminated.
In the discovery stage, Student t-test was performed between the expression profiles of early stage patients and healthy controls. p-values were adjusted using the Benjamini-Hochberg procedure. Adjusted p-values <0.05 were considered statistically significant. miRNAs with high expression levels and high expression fold change were preferred to insure detectability and reliability. Consequently, only those miRNAs with control average rpm >100 and absolute fold change >3.5 were further evaluated. Statistical analysis was performed with R software environment (version 3.3.1, 2016) using bayesreg.R script developed by Cyber-T workspace [10].
To identify the most promising prospective signature, all possible combinations of eligible miRNAs in the screening process were considered as potential signatures, and the effectiveness of each signature was measured by Youden Index (specificity+sensitivity−1). The number of half miRNAs in signature was chosen as diagnostic rule. The threshold of normal expression of each miRNA was defined as a certain expression value in healthy controls, which maximized the Youden Index when classifying samples using this miRNA alone (called balanced value in the text).
Comparison with random forest algorithm based method
For evaluation purposes, the expression change (EC)-based method in the present study was compared with a well-designed method, which makes use of the random forest algorithm (RF) [11].
The best results from the identification process were compared with the best signatures identified by the RF-based method using the same data from TCGA. A subset of miRNAs of the same number as the candidates in the EC-based method was selected from the importance matrix of the RF-based method. Secondly, all possible combinations defined from this miRNA subset were considered as potential classifiers, the specificity and sensitivity of which were obtained using the diagnostic rule mentioned in the reference.
The comparison was performed using the following aspects: miRNA candidates, performance of combinations consist of different number miRNA candidates, and characteristics of the top 25 combinations.
Validation of the final signature
Further validation of the best performing signature was conducted with serum data of an independent cohort obtained through reverse transcription quantitative real-time polymerase chain reaction (RT-qPCR). The essential Minimum Information for Publication of RT-qPCR Experiments guidelines were followed during specimen preparation.
In the circulating miRNAs extraction step, according to the manufacturer's instructions of the miRNeasy Serum/Plasma Kit (Qiagen, Duesseldorf, Germany), 3.5 µL Caenorhabditis elegans miR-39 miRNA mimic (1.6×10⁷ copies/µL; Qiagen) was added to each 200 µL serum sample as a normalization control before miRNAs were extracted. Reverse transcription was performed using mir-X miRNA First-Strand Synthesis Kit (Takara, Kusatsu, Japan). RT-qPCR was performed with PowerUp™ SYBR™ Green Master Mix (Thermo Fisher, Waltham, USA) according to the manufacturer's instructions. Most of primers used in qPCR reaction were designed and synthesized by Tiangen Biotech, Co., Ltd. (Beijing, China) according to miRNA sequences. Detailed sequences of the commercial primers are classified due to privacy policy, but the sequence of one published primer for miR-10b-5p we used was ACACTCCAGCTGGGTACCCTGTAGAA [12]. RT-qPCR was performed on Roche LightCycler® 480 System (Roche, Basel, Switzerland).
Data normalization was conducted using the 2−ΔΔCq method {ΔΔCq=[(Cq cancer−Cq reference gene) −mean(Cq control−Cq reference gene)]} for each sample to obtain a relative expression value. Diagnostic rule was the same as described in the EC-based method. Receiver operating characteristic (ROC) curve was obtained to evaluate the performance of the final signature in the validation cohort.
RESULTS
Comparison between different normal expression range defining methods
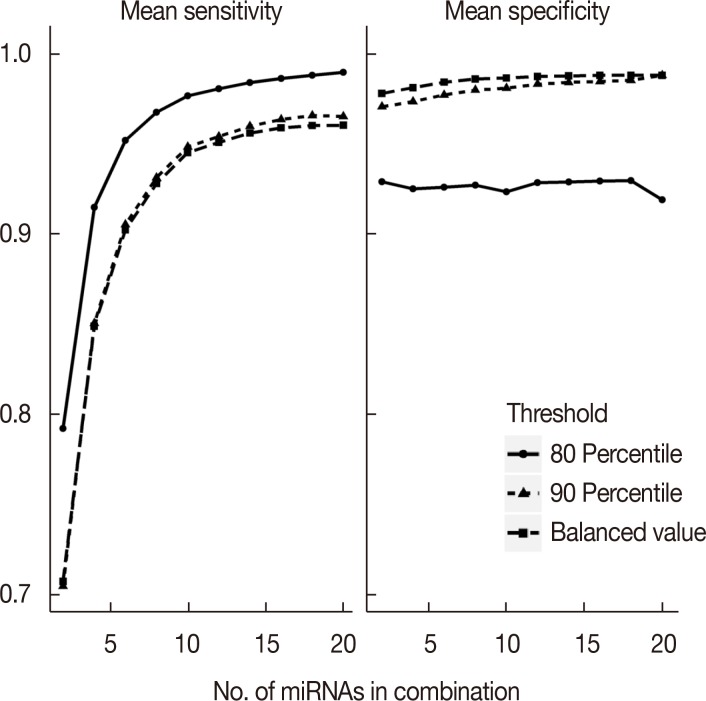
In addition to the balanced value that maximized the Youden Index of each miRNA, the 80th percentile (or 20th, depending on whether the expression level of controls was lower than that of patients) and the 90th percentile (or 10th) of expression values in healthy controls were also taken into consideration when defining the normal expression threshold. A suitable threshold should lead to the majority of the healthy controls having expression in the normal range. To compare these threshold defining methods, signature analysis was conducted using all three methods. Considering the best performance (highest specificity and acceptable sensitivity), we chose the balanced value as the normal range threshold in this study. The comparison is shown in Figure 2.
Tissue-based miRNA candidate selection and comparison with random forest algorithm based method
After tissue profiling data preprocessing, 402 miRNAs were eligible for screening. Most of these were eliminated in the screening process, and 20 miRNAs were ultimately left in the candidate list of the EC-based method. When comparing these candidates to the 20 most important miRNAs from the RF-based method, we found eight common miRNAs. Details are shown in Supplementary Figure 1 (available online).
Next, we compared the performance of the signatures from the 20 eligible candidates in the EC-based method and signatures from the 20 most important miRNAs in the RF-based method. Average performance of signatures composed of equal numbers of miRNAs were compared, and results are shown in Supplementary Figure 2 (available online). Additionally, the top 25 combinations in both methods were compared. The average of miRNA number per combination, specificity, and sensitivity were 6.920, 0.989, and 0.990 for the EC-based method while the values were 6.640, 0.985, and 0.960 for the RF-based method. Specifically, the best combination obtained from the RF-based method consisted of seven miRNAs, of which the specificity and sensitivity were 0.989 and 0.980, respectively. However, the best combination identified using the EC-based method consisted of nine miRNAs, of which the specificity and sensitivity were 0.989 and 0.993 (Supplementary Tables 1 and 2, available online).
Identification of the best combination
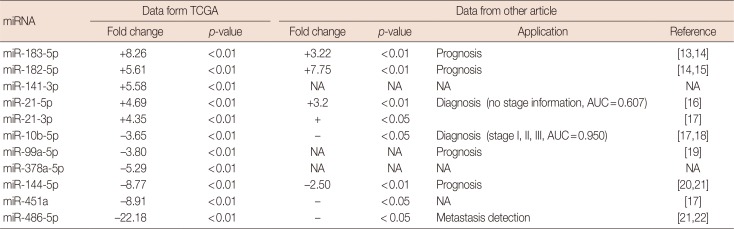
Among all the signatures from 20 eligible candidates in the EC-based method, two tied for the best performance. Both were composed of nine miRNAs, seven of which were in common. In other words, there were 11 miRNAs enrolled in the two best combinations: miR-183-5p, miR-182-5p, miR-141-3p, miR-21-5p, miR-21-3p, miR-10b-5p, miR-99a-5p, miR-378a-5p, miR-144-5p, miR-451a, and miR-486-5p. Result of Student t-test and breast cancer related references of these miRNAs were listed in Table 2 [13141516171819202122].
Validation in serum samples
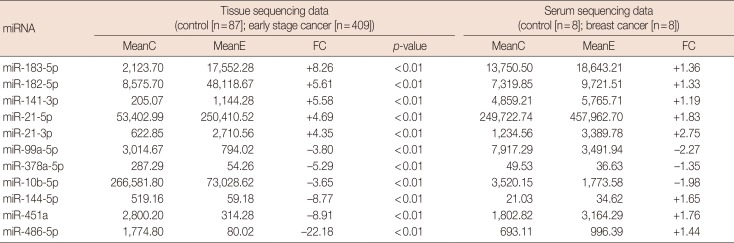
To further narrow the number of miRNAs in the validation stage, the RPM data of a previous study [23], which had performed small RNA-sequencing on serum samples from breast cancer patients, were taken into consideration. Four miRNAs in the best signature (miR-21-5p, miR-21-3p, miR-99a-5p, miR-10b-5p) with great fold changes and high RPM values in serum sequencing data and similar deregulation status as in the tissue samples of TCGA dataset (Table 3) were selected into validation stage. However, although we used two primers designed by Tiangen Biotech Company and one published primer for miR-10b-5p, we were unable to obtain specific and stable amplification results of this miRNA. Therefore, miR-10b-5p was excluded from the final signature temporarily.
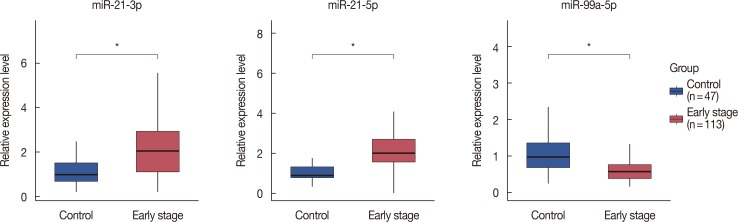
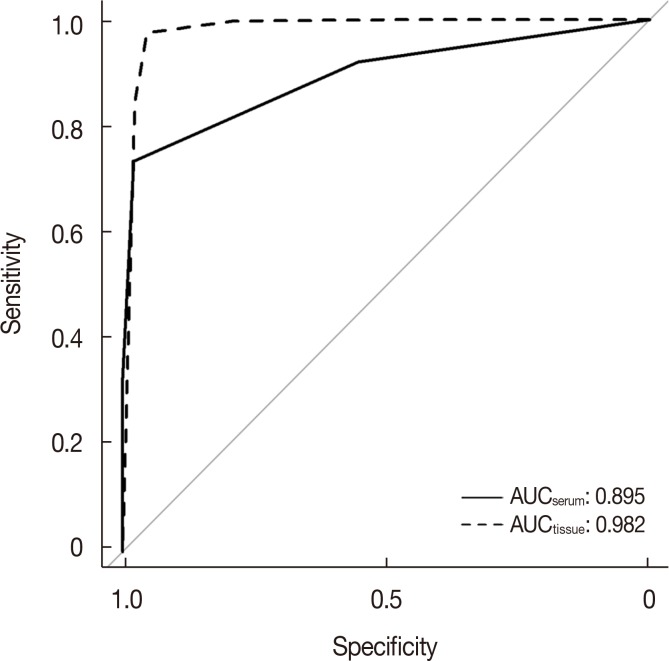
According to the qPCR results, the Cq values of control miRNA among all the samples were stable (22.59±0.77 cycles) and were in a normal range confirmed by the provider. The relative expression levels of the three selected miRNAs remained significantly different between patients and healthy controls. miR-21-5p and miR-21-3p were upregulated while miR-99a-5p was downregulated, which was consistent with the tissue data (Figure 3). Similar expression status of these miRNAs was also found in previous studies [1924]. An area under curve (AUC) of 0.895, diagnostic specificity of 73.5%, and sensitivity of 97.9% were obtained when the 3-miR signature was tested in serum samples, whereas an AUC of 0.982, specificity of 97.6%, and sensitivity of 95.4% were obtained when tested in tissue samples. The high sensitivity and considerable specificity suggested the 3-miR signature was well validated in serum data. ROC is shown in Figure 4.
DISCUSSION
Instead of collecting samples and obtaining data from patients of all stages, the present study made use of a large set of early stage breast cancer miRNA expression profiles from the TCGA database. Since TCGA is one of the largest public molecular data sources which also contains detailed clinical information, such as the TNM stage of patients, this could lead to more reliable and valuable results, particularly in cancer early detection. Moreover, with normalized data from a larger cohort, as well as more detailed and uniform clinical information, we can conduct further studies more easily, such as identifying signatures for cancer subtypes, conducting survival correlation analysis, and so on.
Although serum miRNA profiles were used to identify diagnostic signatures in many other studies [3112526], the present study was designed to identify signatures based on tissue profiles and validate them with serum profiles. Using serum profiles to determine cancer can be challenging; since blood circulates the entire body, factors such as exercise and diet can influence circulating miRNAs. In contrast, tissue miRNA profiles described what exactly happened in the tumor and were minimally affected by irrelevant factors. Though the relationship between expression patterns of tissue miRNA and circulating miRNA is still unclear [12], previously studies [2526] did find miRNAs whose expression deregulation statuses were consistent between tissue samples and serum samples. These findings suggested the expression patterns of circulating miRNAs in cancer patients were somehow influenced by the expression change of miRNAs in tumor tissues. Thus, effective miRNA signatures selected from tissue profiles could also be useful serum miRNA signatures.
Another concern is the expression abundance and the expression fold change of miRNAs in signatures. miRNAs with low expression or little fold change were selected as diagnostic signatures in previous studies [112526] but are impractical in application. In contrast, great fold change and high expression of miRNAs were preferred in the present study because these miRNAs were more likely to be the key factors in oncogenesis and more detectable in the serum samples as biomarkers.
After miR-21-3p, miR-21-5p, and miR-99a-5p were chosen as the final signature, we further investigated the expression levels of these miRNAs in every clinical stage using tissue-derived data from TCGA. Compared to healthy controls, the fold-change values of stage I group to stage III group for miR-21-5p were +4.67, +4.69, +4.67, and +4.01, +4.45, +4.08 for miR-21-3p, and −3.41, −3.94, −3.51 for miR-99a-5p. Adjusted p-values for these results were all less than 0.01. Results of the stage IV group were invalid since the sample size was too small. According to previous studies, increased miR-21, in response to transforming growth factor β1 signaling, is associated with tumor invasion and chemoresistance in vitro [27]. Specifically, overexpression of miR-21-3p could strongly augment L1 cell adhesion molecular expression in renal, endometrial, and ovarian carcinoma-derived cell lines, which promotes cell motility, invasion, chemoresistance and metastasis formation [28]. Upregulated miR-99a could suppress the proliferation, migration and invasion of the MDA-MB-231 breast cancer cells in vitro and inhibited the growth of xeno-transplant tumor in vivo [29]. Although few serum-derived data of these three miRNAs was found, the expression levels of serum circulating miR-21 in different histological tumor grades from a recent study [30] matched our results. These findings suggest the three final miRNAs play an important role in the development of breast cancer and could serve as useful biomarkers for early detection of breast cancer.
It is worth mentioning that majority of the tissue samples used in the present study were donated by Hispanic patients, while all serum samples were from Chinese patients. In the future, more uniform study cohorts should be used when possible. A previous study [25] identified a panel of nine miRNAs (miR-15a, miR-18a, miR-107, miR-133a, miR-139-5p, miR-143, miR-145, miR-365, and miR-425) that can distinguish early stage patients from healthy controls, achieving an AUC of 0.665, sensitivity of 83.3%, and specificity of 41.2% in a validation cohort. Another study [18] showed that a combination of serum miRNAs (miR-145, miR-155, and miR-382) can achieve an AUC of 0.988, sensitivity of 97.6%, and specificity of 100% in cancer detection but this was not validated in an independent cohort. A recent study [26] found a combination of five miRNAs (miR-1246, miR-1307-3p, miR-4634, miR-6861-5p, and miR-6875-5p) from early stage serum samples using microarray profiling, which achieved an AUC of 0.971, sensitivity of 97.3%, and specificity of 82.9%. However, four miRNAs in the combination were unable to be validated by qPCR. All of these study had certain limitations, such as the number of samples in the validation cohort was small or the sensitivity, specificity, and accuracy were not satisfying or not well validated.
In conclusion, the present study established a novel and effective method to identify miRNA signatures for breast cancer early detection based on large scale data from the TCGA database, which could be applied to other cancer types in the future. Furthermore, a prospective biomarker combination of three miRNA (miR-21-5p, miR-21-3p, and miR-99a-5p) for early detection of breast cancer was identified using this method and verified using Chinese clinical serum samples.
 XML Download