

 PDF
PDF ePub
ePub Citation
 Print
Print


INTRODUCTION
MicroRNAs (miRNAs) are small noncoding RNA molecules that modulate gene expression posttranscriptionally by binding to the 3′ untranslated region (3′ UTR) of target messenger RNAs (mRNAs) and leading to their cleavage or translational repression [1]. Depending on the level of matching between the seed sequence in miRNA and the sequence of the 3′ UTR of target mRNAs, miRNAs can have varying levels of control on mRNA expression. Thus, a single miRNA may affect the expression of several mRNA targets and simultaneously control diverse biological processes, including proliferation, migration, differentiation, and cell survival [2].
In 2004, Calin et al. [3] reported that approximately one-half of all miRNAs are located in cancer susceptibility loci. From that report, an increasing number of miRNAs associated with cancers has been reported to have pro- or anti-tumor activity. In breast cancer, miRNAs are known to be involved in several processes that contribute to tumor progression, including self-renewal [4], invasion [5], and metastasis [6]. Epithelial-mesenchymal transition (EMT) is an important mechanism for tumor invasion and metastatic dissemination. As a consequence of EMT, carcinoma cells show loss of E-cadherin as well as increased expression of mesenchymal markers such as vimentin [7]. The molecular and cellular mechanisms underlying EMT are complex [8], and it has been suggested that some miRNAs, such as the miR-200 family, miR-9, and miR-221/222, are involved in the regulation of EMT [791011].
miR-222 belongs to the miR-221/222 family, which is located on the X chromosome, and shares some of its seed sequences with its homologous miRNA, miR-221 [12]. Many studies have reported on the role of miR-222 in cancer development as an oncomiR [13]. An inverse correlation between the expression of miR-222 and the cell cycle inhibitor p27Kip1 has been reported [1415]. Several studies have shown that miR-222 inhibits the translation of estrogen receptor-α (ERα) mRNA and is involved in anti-estrogen resistance [1617]. Stinson et al. [18] reported that transfection of miR-222 promoted EMT in human mammary MCF-10A cells; they also found that miR-222 was overexpressed in basal-like breast cancer cell lines that had undergone EMT.
Based on these findings, we hypothesized that miR-222 expression is associated with the expression of EMT markers and inversely correlates with the expression level of ERα; thus, it may have a prognostic impact in breast cancer. Herein, we analyzed the relationship between the expression level of miR-222 and clinicopathologic features of breast cancer including expression of EMT markers, hormone receptor status, and clinical outcome of the patients.
METHODS
Tissue samples
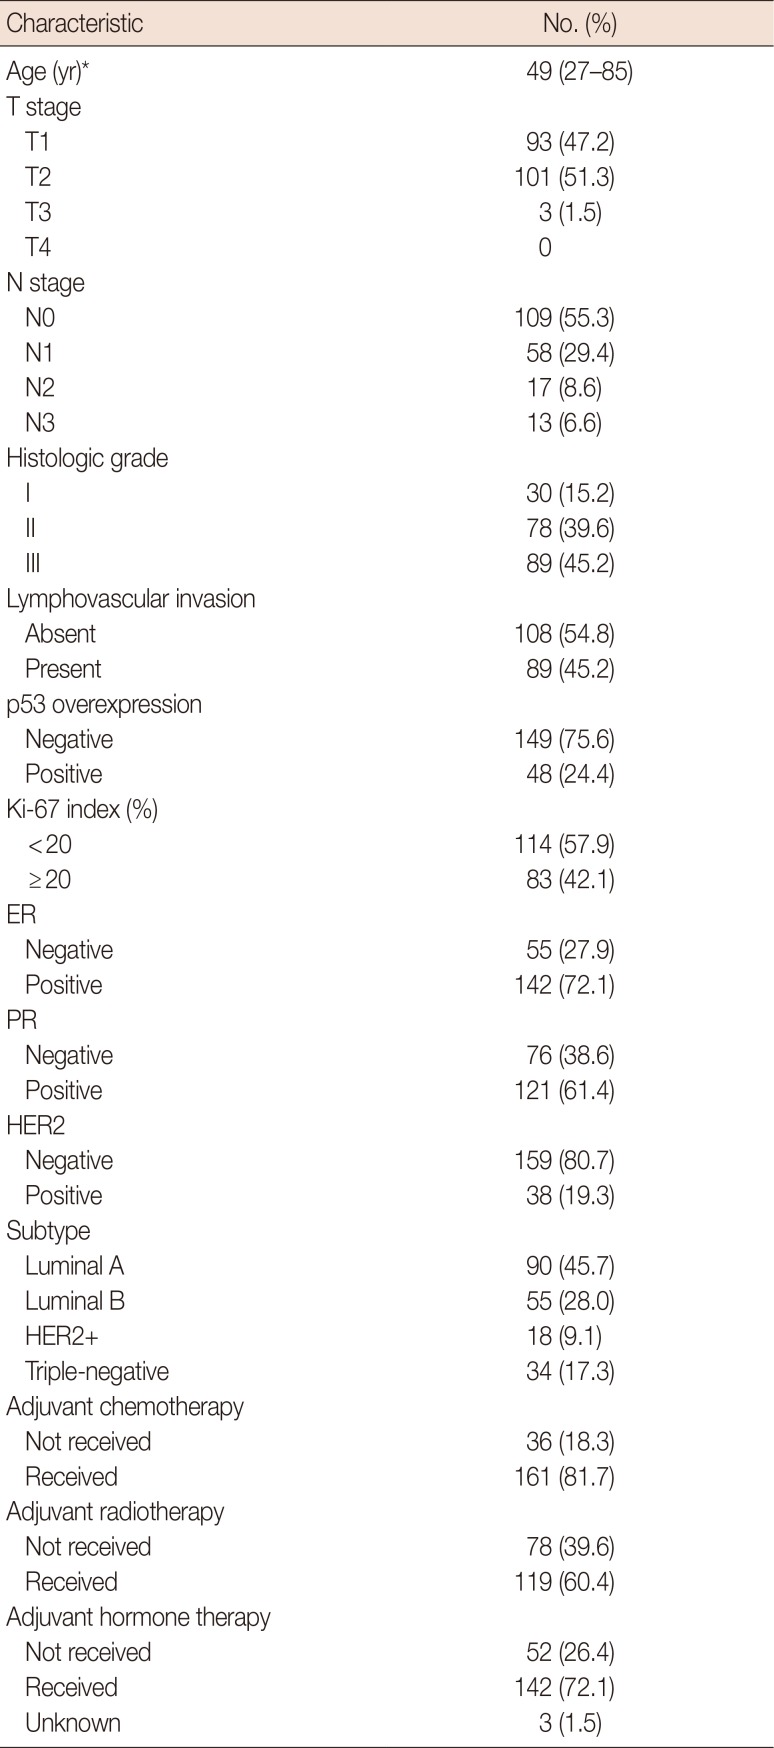
Samples from 197 cases of invasive breast cancer treated at Seoul National University Bundang Hospital from 2003 to 2011 were randomly selected from the archives of the Department of Pathology. Clinicopathologic information was obtained by reviewing medical records, pathology reports, hematoxylin and eosin-stained sections, and immunohistochemical slides for the standard biomarkers. The following histopathologic variables were determined: tumor size, T stage, N stage, histologic subtype (by World Health Organization classification), histologic grade (by the Bloom and Richardson grading system), and lymphovascular invasion. Baseline characteristics of the cases are summarized in Table 1. This study was approved by the Institutional Review Board of Seoul National University Bundang Hospital (protocol number: B-1005/100-303), and informed consent was waived.
Immunohistochemistry
Immunohistochemical staining for EMT markers was performed on tissue microarrays (2-mm diameter, three representative tissue cores). Briefly, tissue microarray sections were cut, dried, deparaffinized, and rehydrated following standard procedures. All sections were subjected to heat-induced antigen retrieval. Immunohistochemical staining was carried out in a BenchMark XT autostainer (Ventana Medical Systems, Tucson, USA) using an UltraView detection kit (Ventana Medical Systems) for vimentin (1:1,200; clone V9, DAKO, Carpinteria, USA), smooth muscle actin (1:100; clone 1A41, DAKO), osteonectin (1:5; clone 15G12, Leica Biosystems, Newcastle, UK), N-cadherin (1:100; clone 3B9, Invitrogen, Waltham, USA), and E-cadherin (1:100; clone NCH-48, DAKO).
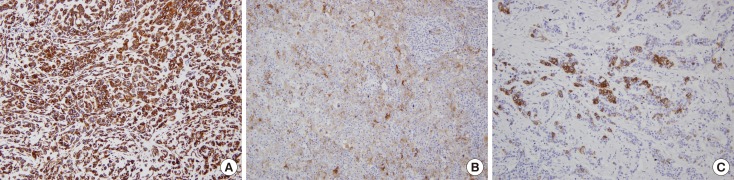
With the exception of E-cadherin, expression of the markers was scored as the percentage of positive tumor cells as follows: 0, no staining or staining in <1% of tumor cells; 1, staining in 1% to <10% of tumor cells; 2, staining in 10% to <25% of tumor cells; 3, staining in 25% to <50% of tumor cells; 4, staining in 50% to <75% of tumor cells; 5, staining in ≥75% of tumor cells (Figure 1). For E-cadherin loss, the same scoring method was applied to tumor cells with a complete loss of membranous staining. For statistical analysis, we coded the expression data for EMT markers into binary categorical variables. Positive staining for each marker was defined according to the distribution of scores for the marker before comparison of the groups, and the same cutoff values (≥10% for vimentin, N-cadherin, and E-cadherin; ≥1% for smooth muscle actin, and osteonectin) were used as in a previous study [19].
RNA isolation, miRNA reverse transcription, and real-time quantitative polymerase chain reaction
Three to five serial sections (8 µm thick) from each representative paraffin block were cut and areas with ≥70% tumor cells were marked and manually dissected. Total RNA was extracted from dissected tissues using the RecoverAll ™ Total Nucleic Acid Isolation Kit (Ambion, Grand Island, USA) according to the manufacturer's instructions. The 7 µL reverse transcription reaction mixture contained 0.15 µL 100 mM dNTPs, 0.19 µL RNase inhibitor (20 U/µL) 1 µL reverse transcriptase (50 U/µL), 1.5 µL 10× reverse transcription buffer, and 4.16 µL H2O. All reagents were purchased from Applied Biosystems, Inc. (Foster City, USA). The reaction mixture was mixed with 5 µL of 10 ng/µL total RNA and 3 µL 5× reverse primer and incubated as follows: 16℃ for 30 minutes, 42℃ for 30 minutes, 85℃ for 5 minutes. For real-time polymerase chain reaction (RT-PCR), we used TaqMan MicroRNA Assays (Applied Biosystems). A mixture of 1 µL 20× TaqMan MicroRNA Assay Primer for hsa-miR-222 (Assay ID 002276) or U6 snRNA (Assay ID 001973), 1.3 µL undiluted cDNA, 10 µL 2× TaqMan Universal PCR Master Mix, and 7.67 µL nuclease-free water was used for RT-PCR. Each RT-PCR was performed on MicroAmp Optical 96-well plates using a 7500 Real-Time PCR System (Applied Biosystems). The reactions incubated at 95℃ for 10 minutes, followed by 50 cycles at 95℃ for 15 seconds, 60℃ for 1 minute. A no enzyme control, which omitted the reverse transcriptase, was used to confirm that the sample was DNA-free. A negative control, containing everything but the template DNA, was included in each plate.
miR-222 expression was calculated using the comparative Ct method (ΔCt). First, we measured the threshold cycle (Ct) of miR-222 and normalized the data by subtracting the Ct value of an endogenous reference (U6 snRNA). For comparison of the ΔCt value of miRNA from breast cancer with that of normal breast tissues, we measured normalized ΔCt values from 10 normal breast tissue samples excised for reduction mammoplasty and subtracted that value from each ΔCt value obtained from a cancer sample (i.e., ΔΔCt=ΔCtmiRNA of cancer − ΔCtmiRNA of normal breast tissue). The formula 2-ΔΔCt was used to compare the relative fold change of miRNA in breast cancer to that of normal controls.
Definition of breast tumor subtypes
Expression of standard biomarkers including ER, progesterone receptor (PR), human epidermal growth factor receptor 2 (HER2), p53, and Ki-67 was evaluated from the whole sections at the time of diagnosis. Breast cancer subtypes were categorized according to the St. Gallen Expert Consensus as follows [20]: luminal A (ER+ and/or PR+, HER2−, Ki-67 <14%), luminal B (ER+ and/or PR+, HER2−, Ki-67 ≥14%; ER+ and/or PR+, HER2+), HER2+ (ER−, PR−, HER2+), and triple-negative (ER−, PR−, HER2−). For ER and PR, expression values were measured in 10% increments and 1% or greater positive staining was considered positive. For HER2, 3+ by immunohistochemistry and/or the presence of gene amplification by fluorescence in situ hybridization was considered positive.
Statistical analysis
Statistical significance of the data was assessed using Statistical Package, SPSS version 15.0 for Windows (SPSS Inc., Chicago, USA). The median value for miR-222 was used as a cutoff value, and the expression level of miR-222 was categorized as low or high. The chi-square test or Fisher exact test was used in analyzing miR-222 expression (low vs. high) with clinicopathologic characteristics of tumors and EMT marker expression. Nonparametric Kruskal-Wallis test and Mann-Whitney U-test were conducted to compare the expression level of miR-222 in relation to breast cancer subtype. Spearman correlation test was used to evaluate the correlation between miR-222 and ER expression. Disease-free survival was analyzed using Kaplan-Meier curves, and the differences were determined using log-rank test. Cox proportional hazard regression model was constructed for multivariate analysis for disease-free survival. The hazard ratio and its 95% confidence interval were calculated for each variable. The p-values less than 0.05 were considered statistically significant, and all reported p-values were two-sided.
RESULTS
Expression of miR-222 in relation to clinicopathologic features of the tumor
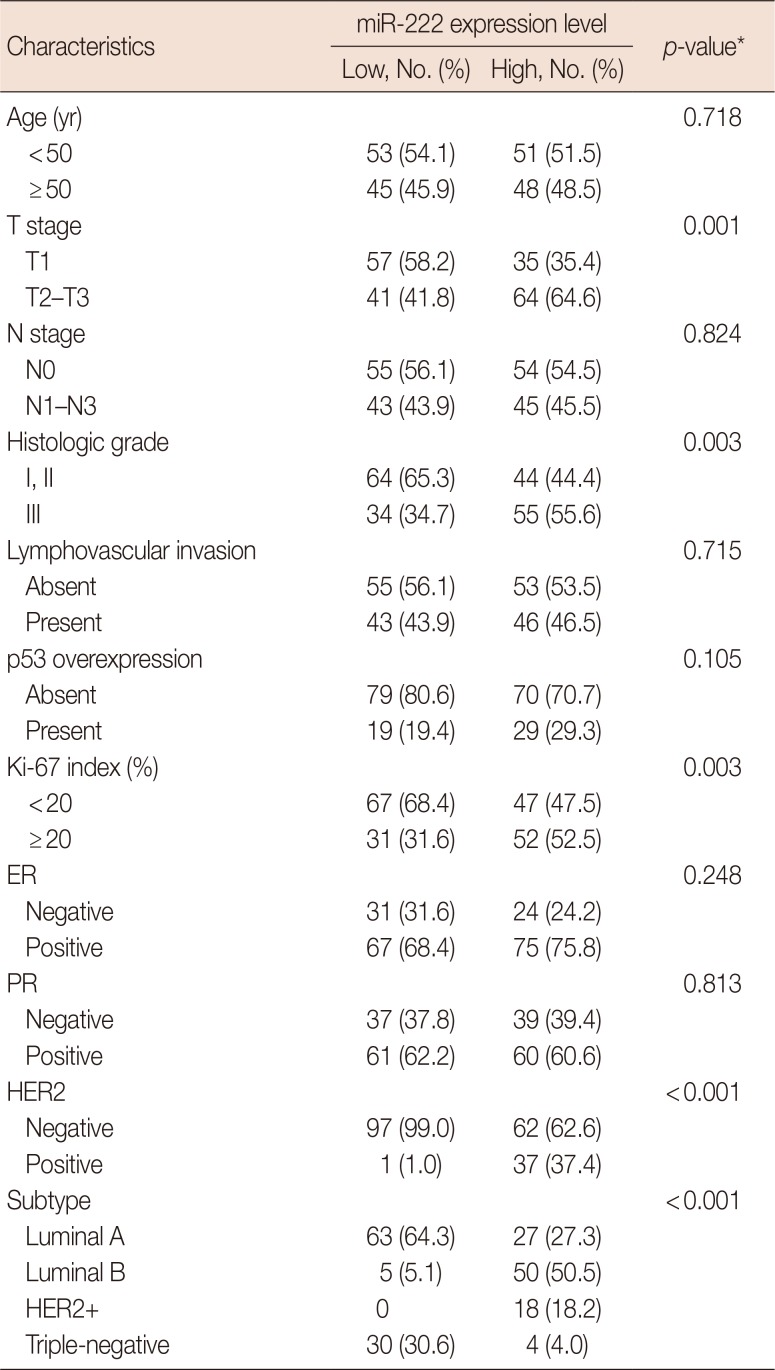
First, we evaluated the relationship between the expression of miR-222 and clinicopathologic features of the tumor (Table 2). High miR-222 expression was associated with high T stage (p=0.001), high histologic grade (p=0.003), high Ki-67 proliferation index (p=0.003), and HER2 gene amplification (p<0.001). However, miR-222 expression level was not associated with ER or PR status.
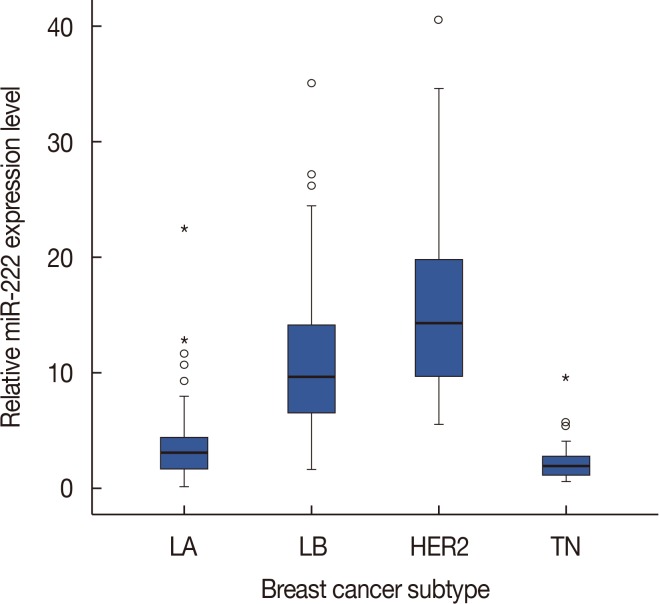
Next, we examined miR-222 expression according to breast cancer subtype. There were significant differences in the expression of miR-222 among the breast cancer subtypes (p<0.001 by chi-square and Kruskal-Wallis tests). miR-222 expression was significantly higher in the luminal B and HER2+ subtypes than in the luminal A and triple-negative subtypes (p<0.001 in all comparisons by Mann-Whitney U-test) (Figure 2). However, there were no differences between the luminal B and HER2+ subtypes.
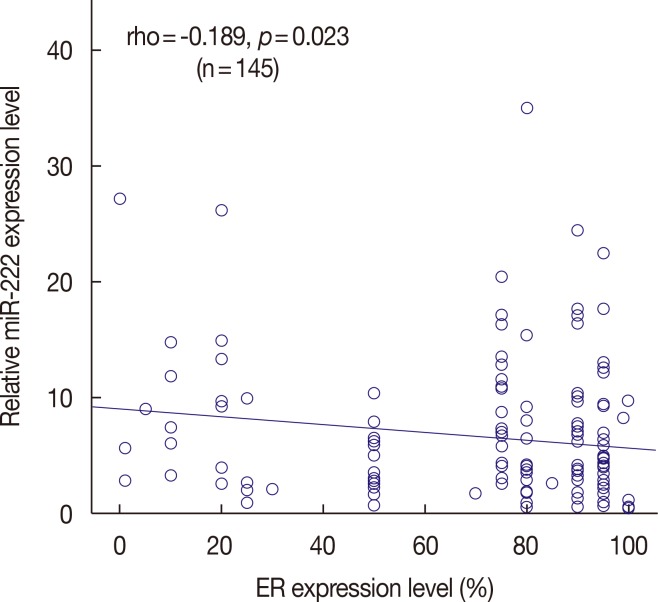
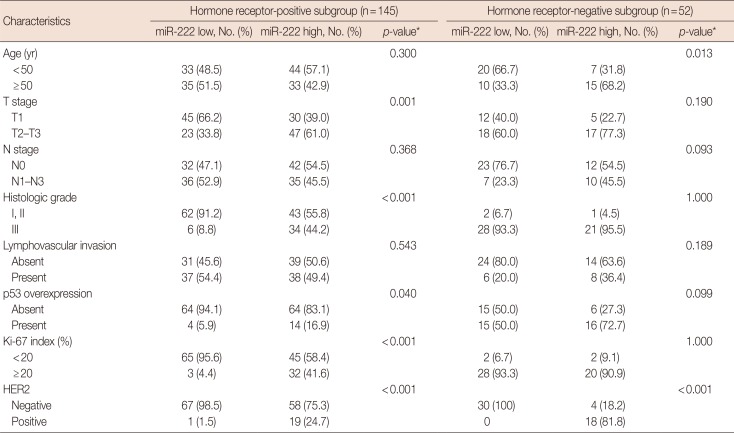
As miR-222 is known to be associated with ERα down-regulation and tamoxifen resistance in breast cancer, we further evaluated the clinicopathologic significance of miR-222 expression according to hormone receptor status (Table 3). In the hormone receptor-positive subgroup, high miR-222 expression was associated with high T stage (p=0.001), high histologic grade (p<0.001), high Ki-67 proliferation index (p<0.001), p53 overexpression (p=0.040), and HER2 gene amplification (p<0.001). Moreover, expression of ER showed an inverse correlation with miR-222 expression in this subgroup (Spearman correlation coefficient rho=−0.189, p=0.023) (Figure 3). However, in the hormone receptor negative subgroup, miR-222 expression showed an association with patient age (p=0.013) and HER2 gene amplification (p < 0.001) only.
Association of EMT marker expression with miR-222 expression
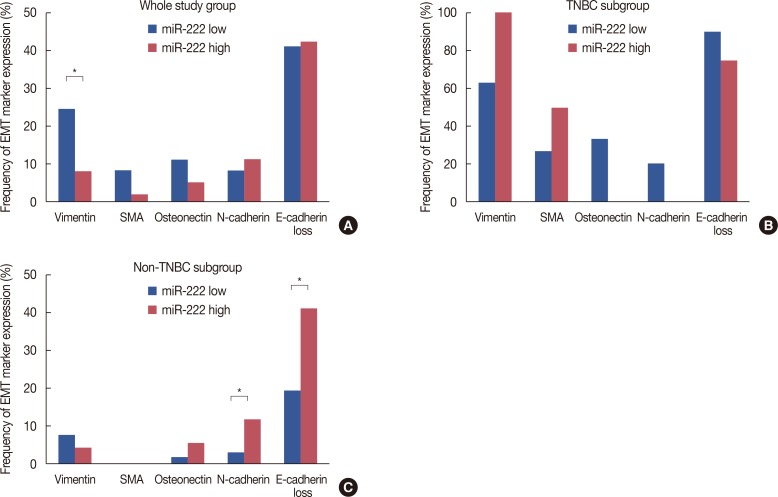
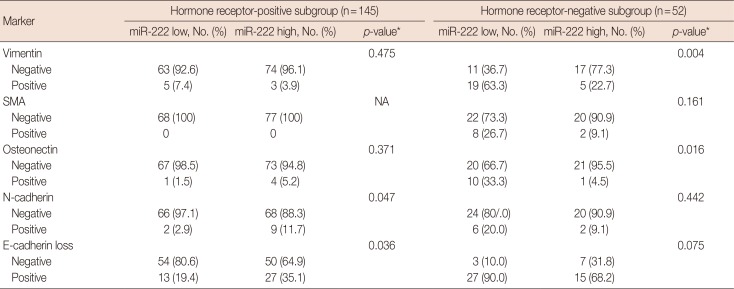
We evaluated the expression of EMT markers according to miR-222 expression (Figure 4). Vimentin expression was more frequent in tumors with low miR-222 expression (below median value) (p=0.002). However, as EMT marker expression is known to occur mostly in triple-negative breast cancer (TNBC) [19], we further analyzed the correlation of EMT marker expression with miR-222 in TNBC versus non-TNBC. While there was no correlation between miR-222 expression and EMT marker expression in the TNBC group, N-cadherin expression (p=0.045) and loss of E-cadherin (p= 0.004) were more frequent in tumors with high miR-222 expression in the non-TNBC group (Figure 4).
We also observed a positive correlation of miR-222 expression level with N-cadherin expression or E-cadherin loss in the hormone receptor-positive subgroup (p=0.047 and p= 0.036, respectively) (Table 4). However, in the hormone receptor-negative subgroup, vimentin and osteonectin expression was more frequent in tumors with low miR-222 expression (p=0.004 and p=0.016, respectively) (Table 4).
miR-222 as an adverse prognostic factor for hormone receptor-positive breast cancer
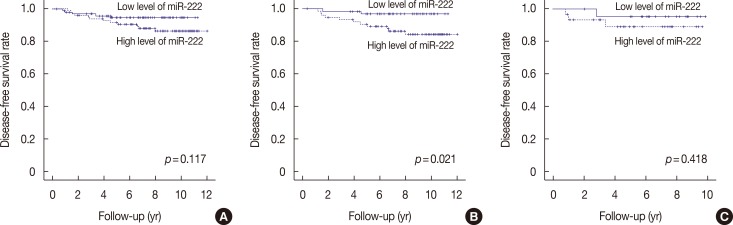
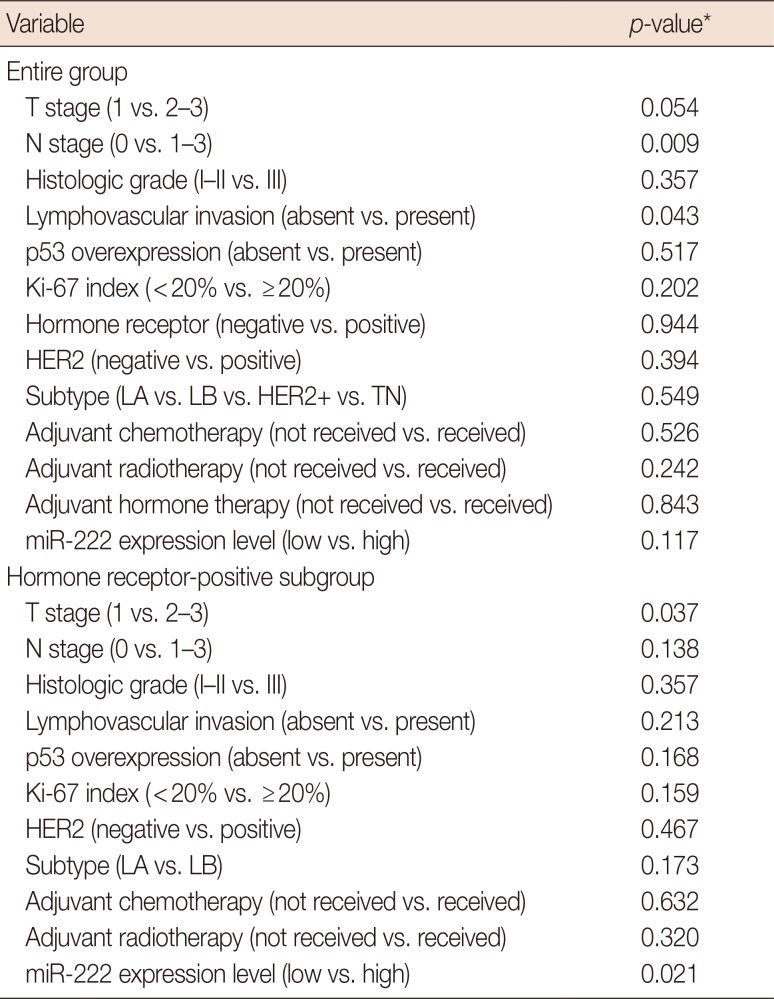
We also investigated the prognostic significance of miR-222 expression (Table 5). The median follow-up period was 7.6 years (range, 0.4–12.0 years), and there were five (2.5%) locoregional recurrences and 12 (6.1%) distant metastases as the first event. Kaplan-Meier survival analysis revealed that nodal metastasis and lymphovascular invasion were significantly associated with poor disease-free survival (p=0.009 and p= 0.043, respectively). T stage tended to be associated with poor clinical outcome (p=0.054). However, a high level (above median value) of miR-222 in the tumor was not a significant prognostic factor in the study group as a whole (p=0.117) (Figure 5A). EMT marker expression was not associated with clinical outcome (data not shown).
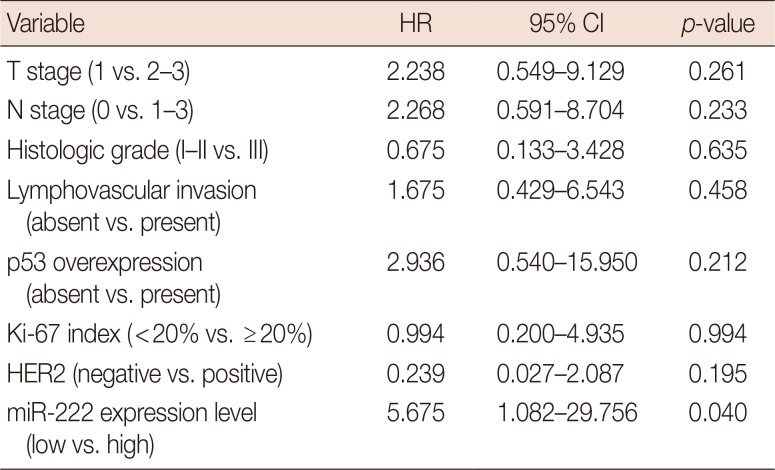
Subgroup analysis by hormone receptor status revealed that high miR-222 expression was significantly associated with poor disease-free survival in the hormone receptor-positive group (p=0.021) (Figure 5B). High T stage was also associated with poor disease-free survival (pT1 vs. pT2–3, p=0.037). In multivariate analyses including all relevant prognostic factors in breast cancer, high miR-222 levels were found to be an independent prognostic factor for poor disease-free survival in the hormone receptor-positive subgroup (p=0.040) (Table 6). However, in the hormone receptor-negative subgroup, there was no correlation between survival and miR-222 levels (p=0.418) (Figure 5C).
Next, we evaluated the relationship between miR-222 expression and tamoxifen resistance. Of the 142 patients receiving adjuvant hormone therapy, 95 patients were treated with tamoxifen. However, in survival analysis, miR-222 expression was not associated with disease-free survival in patients treated with adjuvant tamoxifen (p=0.286).
DISCUSSION
In this study, we showed that miR-222 expression was positively correlated with expression of EMT markers in hormone receptor-positive breast cancers and non-TNBCs. In addition, an inverse correlation was found between the expressions of miR-222 and ER in hormone receptor-positive breast cancers. Finally, a high level of miR-222 expression was identified as an independent adverse prognostic indicator in hormone receptor-positive breast cancers.
To the best of our knowledge, this study is the first to report the prognostic significance of miR-222 expression in hormone receptor-positive breast cancer. Consistent with our findings, high miR-222 expression has been reported as an independent predictor of poor prognosis for patients with pancreatic cancer [21]. Furthermore, overexpression of miR-222 has been reported in several types of cancers, such as colorectal [22] and ovarian [23] cancers, suggesting a role in tumorigenesis.
Although the mechanism by which miR-222 is involved in the progression of breast cancer is not fully elucidated, down-regulation of ERα and promotion of EMT may be involved. The hormone estradiol (E2), which acts by binding to ERα, is required for normal growth and development of the mammary tree [24]. E2/ERα signaling promotes the differentiation of mammary epithelia along a luminal/epithelial lineage [24]. Additionally, E2/ERα signaling antagonizes signaling pathways that lead to EMT. Several studies have shown that miR-222 inhibits the translation of ERα mRNA and is involved in antiestrogen resistance [1617]. However, expression of miR-222 was significantly lower in the triple-negative subtype than in the HER2+ subtype, another ER-negative breast cancer. This finding indicates that there are additional non-miR-222 mechanisms of ER down-regulation in TNBC. Previous studies showing down-regulation of ERα by miR-222 have been conducted using breast cancer cell lines, but their relationship has not been thoroughly studied in human breast cancer samples. In this study, we demonstrated an inverse correlation between the expression of miR-222 and ER in hormone receptor-positive breast cancers samples. However, we did not find a correlation between miR-222 expression and tamoxifen resistance. As there was a limitation in sample size, further large-scale studies are needed to determine whether an association exists in breast cancer samples.
miR-222 was found as a basal-like subtype-specific miRNA, as it was predominantly expressed in basal-like breast cancer cell lines as compared to luminal breast cancer cell lines [1825]. It was reported that miR-222 promotes EMT by targeting tricho-rhino-phalangeal syndrome type 1, a member of the GATA family of transcriptional repressors, which represses the EMT-promoting ZEB2 [18]. EMT marker expression is predominantly found in TNBCs or basal-like breast cancers rather than in the other subtypes [192627]. Thus, we expected that the expression of miR-222 would be increased in TNBC compared to other subtypes and that there would be a positive correlation between the expression of EMT markers and miR-222. However, in this study, miR-222 expression was not high in TNBCs; on the contrary, it was significantly higher in the luminal B and HER2+ subtypes than in the triple-negative subtype, although there was no difference between the luminal A and triple-negative subtypes. Six molecular subtypes have been reported in TNBC, including basal-like 1 (BL1), basal-like 2 (BL2), immunomodulatory, mesenchymal-like (ML), mesenchymal-stem like (MSL), and luminal androgen receptor, with distinct gene expression profiles and canonical pathways, and the ML and MSL subtypes showed high expression of genes associated with EMT [28]. Thus, the discrepant result in this study may reflect the heterogeneity of TNBC. Further studies are needed investigating the correlation of miR-222 expression with TNBC subtypes.
There was no correlation between miR-222 expression and EMT marker expression in the total study group. However, this finding may be biased by the low expression of miR-222 in TNBCs, which frequently show high EMT marker expression. In subgroup analyses, we found a significant correlation between miR-222 expression and N-cadherin expression or loss of E-cadherin expression in non-TNBC and the hor-mone-receptor positive subgroup. Thus, this finding supports the hypothesis that miR-222 is involved in promoting EMT.
miR-222 promotes cell proliferation in many types of can-cers. It has been shown to act as an oncomiR by repressing the cell cycle inhibitor proteins p27Kip1 and p57, leading to augmented proliferation and advancement of clinically aggressive breast cancer [29]. In our study, a significant association was found between the expression of miR-222 and the aggressive features of tumor, such as advanced T stage, high histologic grade, high Ki-67 proliferative index, and HER2 gene amplification. These relationships between miR-222 and aggressive features may contribute to the association of miR-222 with tamoxifen resistance in breast cancer as reported in a previous study [29]. Additionally, HER2 and ER are capable of down-regulating each other, and an inverse correlation between HER2 and ER expression is well documented. Miller et al. [29] showed that expression of miR-222 is notably higher in HER2-positive breast cancer tissues in comparison with HER2-negative tissue samples. Our study also confirmed a significant correlation between the expression of miR-222 and HER2 gene amplification status.
There are some limitations in our study. We anticipated that miR-222 expression level would influence the prognosis of patients with breast cancer across the entire group, irrespective of subtype or hormone receptor status. However, a prognostic value for miR-222 was only found in the hormone-receptor positive group, not in the hormone-receptor negative group. Furthermore, the number of tumor samples used in this study was not large enough. Additionally, the samples were randomly selected; consequently, classic prognostic factors such as high T stage or nodal metastasis were not proven as independent prognostic factors in multivariate survival analyses. Therefore, there may have been selection bias in this study. Further large scaled studies are needed to confirm the prognostic role of miR-222 in breast cancer. As the role of miRNAs in breast cancer progression has been proven, miRNA-based targeted therapies are becoming a novel therapeutic approach for breast cancers. We examined the relationship between the expression of miR-222 and clinicopathologic features in breast cancer. miR-222 is associated with proliferation of breast cancer cells as well as EMT and down-regulation of ER. Importantly, we found that miR-222 is an independent poor prognostic indicator in the hormone receptor-positive subgroup. Therefore, miR-222 may serve as a predictive marker for endocrine therapy resistance and a potential therapeutic target for the treatment of hormone receptor-positive breast cancer.
 XML Download