

 PDF
PDF ePub
ePub Citation
 Print
Print


INTRODUCTION
Breast density is considered to be an independent risk factor for breast cancer. It is estimated that women with an increased breast density have 4 to 6 times higher risk of breast cancer than women with less dense breasts [1,2,3]. The relative risk of cancer related to breast density is greater than most traditional risk factors such as nulliparity and early menarche [4,5]. Recently, mammographic density has also been investigated as a surrogate marker of breast cancer treatment outcomes [6,7,8]. Therefore, assessment of breast density is gaining importance, not only in terms of breast cancer risk, but also for predicting the responsiveness of adjuvant radiotherapy or systemic therapy [9,10].
Traditionally, mammographic density was described through visual evaluation methods such as Wolfe's scale [11], the six-categorical assessment [12], and the four-category tissue composition description of the American College of Radiologists' Breast Imaging Reporting and Data System (BI-RADS) [13,14]. Of these subjective methods, the BI-RADS four-category tissue composition description is still the most commonly used, and it shows consistent association with breast cancer risk [2]. However, it is based on the subjective estimates of the clinician and may not be comparable across different studies. It also subjectively categorizes density patterns instead of quantifying density with continuous variables. A study conducted by Grove et al. [15] found that misclassification of density patterns may lead to a significant underestimation of breast cancer risk. Accordingly, potential objective and quantitative methods for density assessments have become popular.
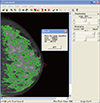
Currently, the computer-assisted thresholding method (Cumulus™; Sunnybrook Health Sciences Centre, Toronto, Canada) (Figure 1) [12], which measures the area of dense tissue and total breast area to calculate the percent density (PD; the dense area expressed as a percentage of the total breast area) is frequently being used as a reliable tool for quantitatively measuring mammographic density, with several studies reporting a significant correlation between PD and breast cancer risk [16,17,18,19]. Despite many advantages, the computer-assisted methods are limited by the fact that, though they are relatively objective and fully quantitative, they are calculated semi-automatically, causing an issue of variability and reproducibility. In addition, previous validation studies on PD used analog film mammograms, which need to be digitized through scanning [20]. Digital mammograms are now more widespread, and density measurement does not require further digitization. However, it has been demonstrated that the PD and absolute dense area tend to be lower when measured in digital mammograms than in analog films [16], which means that the reliability of the PD performed with processed digital mammograms might need additional validation.
The purpose of the present study was to assess the intraobserver reliability of PD performed with digital mammograms alone [18,20,21,22]. In a subgroup analysis, we also sought to determine whether the reliability is consistent regardless of patients' characteristics and the BI-RADS density pattern.
METHODS
Ethics statement
Since this study is a retrospective analysis of follow-up mammography of breast cancer patients, Institutional Review Board of Asan Medical Center approved this study didn't require written or verbal consent.
Subjects and mammograms
This study included 1,496 women with breast cancer who had a breast cancer operation from 2001 to 2003 and were followed for at least 5 years after operation in the Breast and Endocrine Division, Department of Surgery of Asan Medical Center. All mammograms were craniocaudal digital mammograms obtained from unaffected breast 5 years after surgery as a routine surveillance examination. All mammograms were performed with either a Senographe DS or Senographe Essential unit (GE Healthcare, Milwaukee, USA). Mammograms not eligible for density assessment due to multiple granulomas after foreign body injections were excluded.
Measurements and statistical methods
All digital mammograms were reviewed by a single technician (W.J., clinical nurse specialist) who had previous training in density assessment with Cumulus™. She reviewed each mammogram and estimated the PD using the Cumulus™, version 4.2. All images were reassessed by W.J. 1 month later without reference to the previously assigned values and without any patient information. The intrarater agreement of PD was evaluated by the intraclass correlation coefficient (ICC). All patients were grouped based on their clinical variables, which were body mass index (BMI), age, family history of breast cancer, breastfeeding history, and breast area (calculated with Cumulus™), and the ICC of the PD was calculated and compared for each group. BI-RADS density patterns were evaluated by multiple experienced radiologists at the Radiology Unit of Asan Medical Center. The mean and standard deviation (SD) of the PD was compared for each BI-RADS group. The ICC and Student t-test was used for the analysis. For the ICC values, 0.8-1.0 was considered to indicate excellent repeatability, and all tests were two-sided with significance level of p<0.05. All statistical analysis was performed with IBM SPSS statistical software version 19 (SPSS Inc., Chicago,
USA).
RESULTS
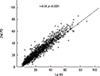
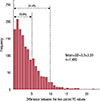
To assess the agreement of the paired PD values, 1,496 digital mammograms were included in the analysis. The correlation between the two independent PD measurements is shown in Figure 2. The ICC was 0.94, which indicates an excellent agreement between the first and second measurements. The discrepancy between the two paired PD measurements is shown in Figure 3. It ranged from 0 to 23.93, and the average was 3.90 (SD=3.39). As seen in the figure, 70.9% of all the discrepancy values belonged to a range of 0 to 5, and 94.4% belonged to a range of 0 to 10.
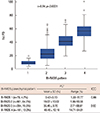
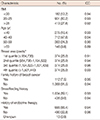
The subgroup analysis of the ICC between the paired PD values is shown in Table 1. All patients were grouped according to their BMI, age, family history of breast cancer, breastfeeding history, breast area, and BI-RADS parenchymal pattern and the ICC was calculated for the PD pairs for each group. The ICC for each group ranged from 0.88 to 0.96, which indicates excellent repeatability in all groups regardless of their characteristics.
The relationship between the BI-RADS pattern and the PD calculated with Cumulus™ is shown in Figure 4. Of the 1,496 patients, 64.2% were estimated to be BI-RADS 2 (n=961), whereas only 4.7% of patients belonged to BI-RADS 1 (n=70). The mean PD values for each BI-RADS group increased as the density patterns indicated denser breasts.
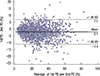
Further analysis was done to identify the characteristic of population with extreme discrepancy between two paired PD values (≥10, n=84). There was no demographic difference between two groups, but group with large discrepancy had a high average PD value with statistical significance (24.7 vs. 31.3, p<0.0001). Figure 5 presents the Bland-Altman plot of PD value and its discrepancy between two paired PD values.
DISCUSSION
In the present study, we demonstrated high intrarater agreement of PD by Cumulus™, particularly when ICC values were used as indicators. The repeatability was consistent, irrespective of various patient variables, such as the BI-RADS parenchymal patterns. The various traditional methods have shown significant correlations with breast cancer risk in many studies, but they have limitations due to their subjective and categorical measurements, which are not optimal for statistical analysis and clinical application. Several studies present the superiority of quantitative methods over qualitative methods for the estimation of breast density and breast cancer risk assessment [17,18,23,24]. Tagliafico et al. [23] reported that automated or semi-automated estimation of breast density eliminates subjectivity, and is more accurate than the BI-RADS quantitative evaluation, and Gram et al. [24] reported that quantitative methods convey additional information on breast cancer risk over the qualitative methods in the classification of mammograms into high- and low-risk groups. In addition, in studies comparing the quantitative assessment of breast density and the qualitative Wolfe classification, the quantitative analysis was proven to have a stronger association with breast cancer [17,18].
Since Cumulus™, which, of several quantitative methods, has recently been gaining popularity, is a semi-automated method that requires a trained specialist, its reliability must be guaranteed regardless of the clinical characteristics and ethnicity of the patients. The present study suggests that Cumulus™, a computer-assisted thresholding method, shows high overall intrarater repeatability, as reported elsewhere [18,20,21,22,25,26] In our subgroup analysis that stratified patients by their variables, such as BMI, age, family history of breast cancer, breastfeeding history, and breast area, PD values showed high intrarater repeatability in all subgroups. Accordingly, Cumulus™, which is not currently routinely used in radiology units, may, given its reliability, be a promising candidate for density assessment.
We hypothesized that the parenchymal density pattern might affect the reliability of Cumulus™, and evaluated its repeatability in both dense and fatty BI-RADS parenchymal pattern groups. We grouped all mammograms into four BI-RADS density patterns, and calculated the mean PD and its variability for each group. As the BI-RADS density pattern indicated more dense breasts, the mean PD value increased, which shows an acceptable correlation between the BI-RADS density pattern and the PD calculated with Cumulus™. Subgroup analysis for reliability after dichotomizing the four BI-RADS patterns into two subgroups demonstrated that the PD values also had a high intrarater repeatability that was irrespective of the BI-RADS parenchymal patterns (Figure 3).
Also there were group of patients with extreme variability between two paired PD values (≥10). Two groups showed no demographic difference, and showed difference only in PD itself. Cumulus™ is semi-automated method which requires a technician to outline each breast parenchyme in green and total breast area in red as shown in Figure 1. From my personal experience with Cumulus™, heterogenous parenchymal pattern might make it difficult to outline its breast parenchyme correctly, which further cause relative variance in its PD value. Therefore to identify which group of patients has a risk of under- or overestimation of its breast density, we might need to concentrate on its parenchymal pattern or characteristics which might cause parenchymal heterogeneity in future study.
This study has valuable clinical implications in several aspects. As mentioned above, all mammograms in the present study, unlike most previous studies performed with scanned analog mammogram images for the evaluation of breast density [20,25,26], were full digital mammograms. To our knowledge, this is the first series to exclusively address the reliability of PD from full digital mammogram images. When breast density is estimated based on Cumulus™ using digital mammograms, the dense area percentage may be lower and more variable that that of scanned film mammograms [16,27], in part due to a better delineation of the breast edge on digital mammograms and an increased nondense area from the image processing algorithms that improve visualization of the skin line and subcutaneous tissues. Therefore, the shift to digital mammography brings new concerns about the reliability of the computer-assisted thresholding method. Our study, with a relatively large sample size, demonstrated that the intrarater repeatability of PD using digital mammograms is highly agreeable and consistent, regardless of patient variables or parenchymal density pattern. Although density measured with Cumulus™ has been considered relatively objective and accurate compared to conventional subjective methods, its use was limited by the need to digitize the film mammograms before they could be read, adding to the resources and time required. Our results suggest that PD calculated with digital mammograms has as high a reliability as scanned mammograms, which has been shown in many previous studies [20,25,26], and both time and resources could be saved.
Interestingly, we identified a small number of populations with extreme discrepancies in the breast density assessment between the two distinct methods: those with high PD values in BI-RADS category 1 and those with extremely low PD values in BI-RADS categories 3 or 4. Fundamentally, the BI-RADS density pattern is a parenchymal pattern analysis, different from the PD, which is a quantification of the absolute amount of dense area and the whole breast area. Nonetheless, it would be interesting to investigate further which subgroup shows the most extreme discrepancy between the two different methods and to determine which method is more accurate in density assessment for certain subgroups.
For the distribution of breast density, the results from this study should be interpreted with caution. The present study does not exactly reflect healthy unaffected Korean female populations since all mammograms in the study were collected from the unaffected breast of breast cancer patients. More than two-thirds of the patients belonged to BI-RADS pattern 1 or 2, indicating a larger proportion of nondense breast compared to that seen in a previous study of Korean populations [28]. This discrepancy and proportionate decrease in dense breast might have been caused by adjuvant hormonal therapy after breast cancer operation, as suggested by other studies [29,30]. This study was not intended to evaluate the distribution of breast density of Korean populations, and thus the results regarding the distribution of breast density in the Korean populations should be interpreted with caution.
In conclusion, our study demonstrated that mammographic PD, based on a semi-automated thresholding method, Cumulus™, and performed with full digital mammography, shows a highly acceptable intrarater agreement, which suggests that PD is a highly reliable quantitative value for breast density assessment regardless of patient variables or parenchymal density patterns.
 XML Download