

 PDF
PDF ePub
ePub Citation
 Print
Print


INTRODUCTION
Breast cancer is the most common cancer of women in Western Europe and North America, and the leading cause of cancer deaths [1]. There have been marked advances in understanding breast cancer carcinogenesis and cancer biology; however, the specific problem of treatment persists. The prognostic factors related to breast cancer are age, nodal status, tumor size, histological tumor grade, steroid hormone (estrogen and progesterone) receptor status, and HER2neu expression. The above factors are currently accepted in clinical practice and have been shown to predict clinical outcome [1,2].
Cancer cell metabolism is characterized by high rates of glucose consumption and glycolysis compared with those of normal cells [3]. Glucose uptake seems to be critical in triggering cellular transformation. Cells that are able to take up glucose do not have to utilize it efficiently by oxidative phosphorylation [1]. Glucose uptake in cancer cells is increased by activation of the oncogene Akt (protein kinase B), which in turn increases the transcription and plasma membrane localization of glucose transporter 1 (GLUT1), a glucose transporter expressed in most cell types [4].
GLUT1, the first member of the GLUT family to be identified, is a high-affinity glucose transporter that regulates glucose uptake [5]. Its expression increases under hypoxia, which creates greater dependence on glycolysis as an energy source [6]. Tumor hypoxia, which is due to proliferation outpacing the blood supply and leads to activation of hypoxia inducible factor (HIF), is certainly responsible for some of the increased glycolysis and glucose consumption observed in cancer cells since HIF activates the transcription of a number of glycolytic genes as well as GLUT1 [7,8]. Increases in glucose consumption help supply the energy that is necessary for tumor cell proliferation and reflect adaptation to the adverse conditions of the tumor environment. The metabolic changes occurring in tumor cells may have prognostic and diagnostic value; although, the metabolic consequences of increased glucose transport are not well understood: GLUT1 expression appears to have clinical significance in several types of tumor [9].
In this study, we examined GLUT1 expression immunohistochemically in a large series of invasive ductal carcinomas, to evaluate the relation between GLUT1 expression and clinicopathological parameters, as well as the impact of GLUT1 expression on survival. In addition, we investigated the correlations between GLUT1 expression and expression of the estrogen receptor (ER), progesterone receptor (PR), and c-erbB-2.
METHODS
Patients and tissue samples
We enrolled a consecutive series of 276 patients with invasive ductal carcinoma. All were diagnosed and treated in Hanyang University Hospital between August 2000 and January 2009. The mean age was 50 years. The patients were followed up for a mean period of 60 months. Of the tumors, 45 were histologic grade 1, 156 were histologic grade 2, and 75 were histologic grade 3. In addition, 18 samples of normal breast tissue, 14 of ductal hyperplasia, 55 of ductal carcinoma in situ, and 58 of lymph node metastasis, were randomly selected to examine the evolution of GLUT1 expression in multistep carcinogenesis. All tissue samples were formalin-fixed and paraffin embedded. Hematoxylin-eosin (H&E) slides, pathology reports, and other medical records were reviewed to confirm the diagnoses as well as to establish the clinicopathologic parameters of the tumors, such as age, tumor size, histological grade, lymphatic invasion, perineural invasion, lymph node metastasis, perinodal tumor extension, and patient survival.
Ethics approval
The materials in our study are human breast cancer samples, which are products of surgical operation for cancer treatment. Moreover, our study contains no private information on patients. Therefore, our study has no problems in causing any ethical issue or encroachment of human rights.
Tissue microarray construction
Tissue microarrays (TMA) were constructed from archival formalin-fixed, paraffin-embedded tissue blocks using a manual tissue arrayer (Quick-Ray Manual Tissue Microarrayer; Unitma Co., Ltd., Seoul, Korea). As described [10], areas of each sample rich in tumor cells were identified by light microscopy of H&E stained sections for use in the tissue microarrays. Tissue cylinders with a diameter of 2 mm were punched from a previously marked area of each block (donor block) and transferred to a recipient block. This resulted in 6×10 arrays for sets of 60 cases.
Immunohistochemical staining
For immunohistochemical staining, serial 4 µm sections were cut with a Leica microtome and transferred to adhesive-coated slides. The TMA slides were dewaxed by heating at 55℃ for 30 minutes, followed by three washes of 5 minutes each with xylene. The sections were rehydrated by a series of 5 minutes washes in 100%, 90%, 70% ethanol and phosphate buffered saline (PBS). Antigen was retrieved by heating the samples in a microwave for 4 minutes 20 seconds at full power in 250 mL of 10 mM sodium citrate (pH 6.0), and endogenous peroxidase activity was blocked with 0.3% hydrogen peroxide for 20 minutes. Primary mouse monoclonal anti-GLUT1 antibody (ab40084; Abcam, Cambridge, UK) was diluted 1:250 with goat serum. Primary mouse monoclonal anti-ER antibody (Novocastra Laboratories, Newcastle, UK) was diluted 1:50 with goat serum. Primary mouse monoclonal anti-PR antibody (Novocastra Laboratories) was diluted 1:100 with goat serum. Primary mouse monoclonal anti-c-erbB-2 antibody (Novocastra Laboratories) was diluted 1:800 with goat serum. After incubation with the primary antibodies at room temperature for 1 hour, the sections were washed with PBS three times for 2 minutes each, and incubated with biotinylated goat anti-mouse secondary antibody for 30 minutes (DAKO, Carpinteria, USA). After three more washes, horseradish peroxidase-streptavidin (DAKO) was added to the sections for 30 minutes, followed by another three washes. The samples were developed with 3,3'-diaminobenzidine substrate (Vector Laboratories, Burlington, Canada) for 1 minute and counter-stained with Mayer's hematoxylin. They were then dehydrated and sealed with cover slips. Negative controls were performed by omitting primary antibodies.
Interpretation of immunohistochemical staining
GLUT1 expression was evaluated semi-quantitatively by two independent pathologists (Han H and Paik SS) without knowledge of clinical outcomes. The GLUT1 immunostaining was semiquantified by grading the proportion of cells that were GLUT1-positive, as described previously [11]: grade 0, negative (no positive cells); grade 1, low positive (less than 10% are); grade 2, moderate positive (10-50% positive cells); and grade 3, high positive (more than 50% positive cells). For purposes of statistical analysis, a cut-off value of 10% was adopted. If the proportion of GLUT1 positive cells was <10%, the sample was classified as GLUT1 negative, and if it was >10%, it was classified as GLUT1 positive.
Hormone receptor status (ER and PR) was decided on the basis of American Society of Clinical Oncology/College of American Pathologists (ASCO/CAP) guidelines for ER/PR testing in breast cancer [12]. If ≥1% of tumor cell nuclei were immunoreactive, it was classified as ER/PR positive.
We classified c-erbB-2 expression into four levels according to the ASCO/CAP guidelines for c-erbB-2 testing in breast cancer [13]. Briefly, a score of 0 was given to those specimens showing no staining. A score of 1+ was given to specimens with weak, incomplete membrane staining in any proportion of tumor cells. A score of 2+ was given to specimens showing complete membrane staining that is either non-uniform or weak in intensity but with obvious circumferential distribution in at least 10% of tumor cells. Finally, a score of 3+ was given to specimens showing uniform intense membrane staining of >30% of invasive tumor cells. Only c-erbB-2 staining evaluated as 3+ was rated positive. Where assessments disagreed, the relevant slides were reinvestigated by the two pathologists with a multi-head microscope, and agreement was reached.
Statistical analysis
Statistical analysis was performed with SPSS software version 15.0 (SPSS Inc., Chicago, USA). The chi-square test for linear trend and Fisher's exact test were used to examine the association between GLUT1 expression and clinicopathological parameters including age, histologic grade, T category, N category, American Joint Committee on Cancer (AJCC: 7th edition, 2002) stage, lymphatic invasion, perinodal tumor extension, and expression of ER, PR, and c-erbB-2. The Kaplan-Meier method was used to calculate overall survival and disease-free survival. Univariate survival analysis with the log-rank test was used to compare the survival rates of the patient subgroups. Multivariate survival analysis with the Cox proportional hazards regression model was used to evaluate independent prognostic factors: p<0.05 was considered significant.
RESULTS
Patterns of GLUT1 expression in breast tissues
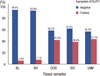
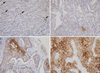
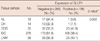
GLUT1 expression was evaluated in 18 cases of normal breast tissue, 14 cases of ductal hyperplasia, 55 cases of ductal carcinoma in situ, 276 cases of invasive ductal carcinoma, and 58 cases of lymph node metastasis. As expected, erythrocyte membranes were strongly GLUT1-positive. Various grades of membrane GLUT1 expression were observed, some with and some without cytoplasmic expression. GLUT1 expression was significantly higher in ductal carcinoma in situ, invasive ductal carcinoma, and lymph node metastasis than in normal breast tissue and ductal hyperplasia (p=0.002) (Table 1, Figure 1). Representative photomicrographs of GLUT1 immunostaining in the invasive ductal carcinomas are shown in Figure 2.
Correlations between GLUT1 expression and clinicopathologic parameters in invasive ductal carcinoma
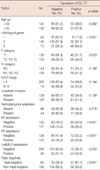
To assess the clinicopathologic significance of the GLUT1 expression, we evaluated the correlation between GLUT1 expression and clinicopathologic parameters in the 276 invasive ductal carcinomas. We found that positive GLUT1 expression was correlated with more aggressive behavior: it was associated with higher histologic grade (p<0.001), larger tumor size (p=0.025), absence of ER (p<0.001), absence of PR (p<0.001), and triple-negative phenotype (p<0.001) (Table 2).
Correlations between GLUT1 expression and overall survival and disease-free survival
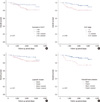
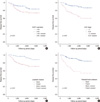
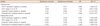
We examined the impact of GLUT1 expression on patient survival. As we anticipated, we found that GLUT1 expression, AJCC stage, lymphatic invasion, and perinodal tumor extension had significant impacts on overall and disease-free survival in univariate and/or multivariate analyses (Table 3). Thus, GLUT1 expression was significantly correlated with poor overall survival (p=0.017, log-rank test) and lower disease-free survival (p=0.021, log-rank test) in univariate analysis. In multivariate survival analysis with the Cox proportional hazards model, GLUT1 expression was an independent prognostic factor of overall survival and disease-free survival (p=0.017 and p=0.019, respectively). Kaplan-Meier survival curves revealed significant differences in patient survival according to GLUT1 expression, AJCC stage, lymphatic invasion, and perinodal tumor extension (Figures 3, 4).
DISCUSSION
In the present study we investigated the expression of GLUT1 in 18 normal breast tissues, 14 ductal hyperplasias, 55 ductal carcinomas in situ, 276 invasive ductal carcinomas, and 58 lymph node metastases, and evaluated the correlations between clinicopathologic parameters and patient survival in the patients with invasive ductal carcinomas. GLUT1 expression was markedly higher in ductal carcinoma in situ, invasive ductal carcinoma, and lymph node metastasis than in normal breast tissue and ductal hyperplasia. It was correlated with higher histologic grade, larger tumor size, absence of ER, absence of PR, and triple-negative phenotype. In addition, there were significant associations between GLUT1 expression and overall survival and disease-free survival in patients with invasive ductal carcinomas.
Glucose metabolism and utilization is increased in many malignant tumors [14-16]. The increased GLUT1 expression in neoplastic tissue reflects increased glycolytic metabolism and is also observed under conditions that induce greater dependence on glycolysis as an energy source, such as ischemia or hypoxia [17,18]. Constitutive upregulation of glycolysis requires additional adaptations, resistance to apoptosis and upregulation of certain membrane transporters [19]. The need for increased glucose uptake is achieved by upregulation of glucose transporters in the plasma [20]. Activation of GLUT1 expression is a feature of the malignant phenotypes of a variety of cancers, and has been shown to be associated with malignant transformation [14]. GLUT1 is widely distributed in both fetal and adult tissues and its expression is altered in human breast carcinomas [21].
Recently, Chen et al. [22] described the GLUT1 expression patterns in various breast tissues including normal, ductal hyperplasia, atypical ductal hyperplasia, ductal carcinoma in situ, and invasive ductal carcinoma. They demonstrated that GLUT1 expression was completely absent in normal breast tissue, ductal hyperplasia, and atypical ductal hyperplasia, but was expressed in 56.8% (25/44) of ductal carcinomas in situ and 44.1% (26/59) of invasive ductal carcinomas. Hao et al. [23] had also shown the GLUT1 expression in the breast malignancies. In their immunohistochemical study, 58.8% (47/80) of the breast carcinoma cases including ductal carcinoma in situ and invasive carcinoma displayed the GLUT1 expression; whereas, benign lesions consisting of 20 cases of fibroadenoma and 20 cases of usual ductal hyperplasia exhibited no immunoreactivity for GLUT1. In the present work, we demonstrated GLUT1 expression in 5.6% (1/18) of normal breast tissue samples and 7.1% (1/14) of ductal hyperplasias, 41.8% (23/55) of ductal carcinomas in situ, and 38.4% (106/276) of invasive ductal carcinomas. We also assessed GLUT1 expression in 58 lymph node metastases, 43.1% (25/58) of which were GLUT1 positivity. The slight differences in frequencies of GLUT1 expression in the studies may be due to differences in the numbers of cases examined and the cut-off values employed. For instance, in the report of Chen et al. [22], staining of GLUT1 was scored as positive when membrane staining was seen in >1% of tumor cells; whereas, we used a cut-off value of >10%. In these studies, GLUT1 expression was significantly higher in ductal carcinoma in situ, invasive ductal carcinoma, and lymph node metastasis than in normal tissue and ductal hyperplasia. This suggests that GLUT1 expression plays an important role in malignant transformation of the breast.
GLUT1, as a prognostic marker, has been explored somewhat in breast cancer [22-30]. Some studies have reported correlations between GLUT1 expression and clinicopathological parameters of breast cancers. Kang et al. [24] demonstrated that the frequency of GLUT1 expression was correlated with higher nuclear grade (p<0.001), absence of ER (p=0.002), and absence of PR (p=0.001). Pinheiro et al. [25] reported significant associations between GLUT1 expression and high grade of tumors (p=0.0014), basal-like subtype (p=0.0008), absence of PR (p=0.0162), presence of vimentin (p=0.0033), and Ki-67 expression (p=0.0339). Ravazoula et al. [26] and Kim et al. [27] showed that the increase of GLUT1 expression rates was correlated to the high histological grade of the breast carcinomas. Similarly, Ahn et al. [28] found that the positive GLUT1 expression was significantly related to tumor size (p=0.003) and histological grade (p<0.001) of the invasive breast carcinomas. In contrast, Kuo et al. [29] found that there was no significance between GLUT1 expression and clinicopathological characteristics including patients' age, tumor size, nuclear grade of tumor cells, lymph node metastasis, and ER and PR status. They concluded that their exceptional results were probably caused by the small number of the population, no more than 39 cases of breast malignancies. In our study, GLUT1 expression was positively correlated with higher histologic grade (p<0.001), greater tumor size (p=0.025), absence of ER (p<0.001), absence of PR (p<0.001), and triple-negative phenotype (p<0.001). These results suggest that breast tumors with glycolytic phenotypes are more aggressive.
The correlation between GLUT1 expression and survival in breast cancer has been little explored. Kang et al. [24] found that the mean overall survival times of GLUT1-positive and -negative patients were 48.7±2.2 and 56.1±1.3 months, respectively (p=0.043) and that their mean disease-free survival times were 47±2.4 and 54.3±1.3 months, respectively (p=0.017). Ahn et al. [28] suggested that the expression of GLUT1 has a significant relationship with the patients' survival. In their study, the mean overall survival time of the GLUT1-positive group was 115 months, and that of the GLUT1-negative group was 149 months (p=0.006). On the contrary, Pinheiro et al. [25] found no significant difference in patients' survival between the positive and negative patients. In our case, patients with GLUT1 expression had poorer overall survival and disease-free survival (p=0.017 and p=0.021, respectively, log-rank test) in univariate survival analysis, and GLUT1 expression was an independent prognostic factor of overall survival and disease-free survival (p=0.017 and p=0.019, respectively) in multivariate survival analysis with the Cox proportional hazards model. Further, we found close correlations between patients' survival and AJCC stage, lymphatic invasion, and perinodal tumor extension in univariate and multivariate analyses. Interestingly, perinodal tumor extension was associated with poorer overall survival and disease-free survival (p=0.001 and p<0.001, respectively, log-rank test) in univariate survival analysis.
In conclusion, our findings indicate that GLUT1 expression plays an important role in malignant transformation in breast cancer, and may be a predictor of aggressive phenotype and poor prognosis.
 XML Download