

 PDF
PDF ePub
ePub Citation
 Print
Print


INTRODUCTION
Acquiring patient data, including facial images of the head and neck region, is an integral step in the diagnosis, treatment planning, and evaluation of orthodontic treatment and orthognathic surgery. Traditionally, information regarding soft tissues has been recorded in the form of photographs taken from various angles. Two-dimensional (2D) photogrammetry is a convenient and economical way of capturing and archiving facial images. However, it has several limitations. First, it offers limited angles. Second, since it is influenced by both the photographing angle and the distance, the results are often inconsistent. Furthermore, it does not permit linear measurements between landmarks and therefore offers only proportional data regarding the facial soft tissues. Direct anthropometry was developed to overcome these drawbacks and to allow linear measurements. However, even this method has its disadvantages, such as prerequisite training on live subjects and multiple timeconsuming direct measurements during examination.1
Advances in cone-beam computed tomography (CBCT) have facilitated the recording of facial integumental data. CBCT has gained popularity because of its low dose of radiation, relatively high speed, and small unit size compared to conventional computed tomography (CT). In fact, it has become a routine examination for the diagnosis and planning of orthognathic surgeries. However, CBCT does not record the texture or color of soft tissues.2
Three-dimensional (3D) photogrammetry is currently commercially available in a variety of imaging systems and provides an alternative method of obtaining and recording facial integumental data. It offers many advantages over traditional methods: the quantification of angles, surface areas, and volumes, in addition to linear distances; user-guided interactive landmark localization; the potential for extracting x, y, and z coordinate data for a wide variety of statistical shape analyses; and the speed with which images can be stored in a permanent archival record of a subject's face.3 A major reason for using 3D digital photogrammetry is the ability to capture surface data in high-resolution color at relatively fast speeds, a considerable advantage when working with young or developmentally impaired subjects.4,5,6
Based on the method of scanning, available systems can be divided into two types: laser surface scanning and, more recently, light emitting diode (LED) white light scanning. Since LED white light is innocuous to the human body, a range of devices using this light have flooded the market, and these differ considerably in terms of cost, capture method, imaging hardware, and software. Additionally, based on the method of data capture, there are two types of devices that use LED white light; stereo-photogrammetry and structured-light systems. In stereo-photogrammetry, two or more cameras obtain the images from slightly different angles, and, by triangulation, match the corresponding features between the images to construct the 3D surface.5 In a structured-light system, a 3D scanner projects patterns of light and acquires the distortions of patterns to calculate the 3D coordinates of details on the object's surface.
In the past, studies of the accuracy and precision of 3D scanners that use LED white light have focused on devices that use stereo-photogrammetry for data capturing.3,7,8,9,10 Furthermore, there have been few studies evaluating the precision and accuracy of systems that use structured light scanning, such as the Morpheus 3D® scanner (Morpheus Co., Seoul, Korea).
The Morpheus 3D® scanner is an example of a 3D photogrammetry imaging device that uses a structuredlight scanning system. It has gained popularity due to its small size (dimensions: H × W × D, 390 × 140 × 240 mm), ease of use, and ability to acquire data rapidly (0.8 seconds). However, little is known about the accuracy and precision of this device. Before any system can be implemented in quantitative studies of patient populations, errors in producing and measuring images must be evaluated. A study that evaluates the accuracy and precision of such a device on human subjects, under realistic conditions of data collection, is required in order to accurately determine the impact of various sources of error, including those caused by biological variation, on the measures collected.3 Therefore, this study aims to evaluate the accuracy and precision of 3D facial scanning, specifically the linear accuracy of 3D facial scanning between the virtual imaging and direct integumental measurements, by the Morpheus 3D® scanner. In this study, accuracy is defined as the extent of deviation when comparing measurement values between direct anthropometry and the Morpheus 3D® system, and precision is defined as the absolute difference between repeated measurements of the same entity.
MATERIALS AND METHODS
Study sample
The sample comprised a total of 30 subjects aged 24 to 34 years (mean, 29.0 ± 2.5 years). Twenty of the 30 participants were male. All the subjects were healthy and morphologically normal.
Data acquisition
3D surface data were acquired at the Department of Orthodontics, School of Dentistry, Kyung Hee University, following approved IRB protocols (IRB No: KHDIRB 1310-1). Twenty-one landmarks were labeled on the face of each subject using a sharpened eyeliner pencil (Figure 1). Since direct labeling of the exocanthion (Ex) and endocanthion (En) with a marker would have been too invasive, the nearest points on the skin from the actual landmarks were labeled instead. Except for "ch" and "Lal-4," the linear distances were based on the standard anthropometric landmarks defined by Farkas.11 We defined the chelion (ch) as the most lateral aspect of the vermilion border of the corner of the subject's mouth. We defined "La1-4" as points located 5 cm above the right Ex, right En, left En, and left Ex to evaluate linear measurements on the subject's forehead. The landmarks used in this study are presented in Table 1.
Three-dimensional facial images were then taken with the Morpheus 3D® scanner. An LED white light was used as the light source in the imaging unit, providing a manufacturer's accuracy of less than 0.1 mm. The entire scanning procedure took approximately 0.8 seconds. Patients sat with natural head positions and reposed lips (Figure 2). For each subject, three images were taken from three different horizontal angles (the front, right, and left sides at an angle of 45°) and then merged into a single 3D facial image.
Sixteen direct measurements using a digital caliper were made between the landmarks on each subject's face. The same measurements were then made on the 3D facial images using the Morpheus 3D "line length" tool, which enables measurements of the direct distance between two points. A single trained observer obtained all the measurements.
To investigate the precision, defined in this study as the absolute difference between repeated measurements of the same subject, one additional set of facial images was taken from all 30 subjects. Additional sets of measurements were directly drawn on the faces and on the 3D facial images. These were recorded separately to ensure that the observer was blinded to prior results.
Data analysis
Accuracy
To determine the accuracy of the Morpheus 3D® scanner, the mean value of the two measurements derived from the two sets of 3D images of each subject was compared to the mean of those obtained with the digital caliper. Prior to analysis, the Shapiro-Wilk test for data normality was performed on each variable. For normally distributed measurements, the Student t -test was performed. For other measurements, the nonparametric Wilcoxon signed rank test for paired data was used to compare the means. Additionally, the difference between the mean caliper and mean photogrammetry values was reported in order to provide directional information. All tests were performed using SPSS software version 12.0 (SPSS Inc., Chicago, IL, USA).
Precision
To quantify precision, two sets of measurements taken with each method were compared using three different precision estimates; mean absolute difference (MAD), relative error magnitude (REM), and technical error of measurement (TEM). MAD is a commonly reported precision estimate.12,13 The advantages of MAD include the simplicity in its calculation, the ease with which it can be interpreted for comparative purposes, and its lack of dependence on size measurements.13
To obtain the REM, the MAD for a given variable was divided by its grand mean, and this result was then multiplied by 100. Therefore, the REM represents an estimate of the error magnitude, expressed as a percentage, relative to the size of the measurement. In terms of reliability, a smaller percentage represents a more precise measurement. REM is analogous to a coefficient of variation, in which the standard deviation is divided by the mean. It is important because error magnitude scores alone can be misleading.14
Finally, the TEM is a standard-deviation-like estimate of error magnitude expressed in the original units of measurement. When there are two measurements involved, the formula for TEM is as follows:
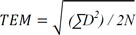
D is the difference between the first and second measurements, and N represents the number of individuals measured. Similar to the MAD, smaller TEM values represent more precise measurements.3
RESULTS
Accuracy
When direct caliper measurements were compared with those derived from the Morpheus 3D® system, five of the 16 possible anthropometric variables were found to be significantly different (Table 2). Those variables were Ex-Ex, En-En, N-Pn, Pn-Sn, and Stm-B'. There were four variables that showed differences more than or equal to 1 mm: Ex-Ex (1.1 mm), Rt.Tra-Ck (1.0 mm), Lt.Tra-Ck (1.1 mm), and La1-La2 (1.0 mm). The differences of all variables ranged from 0.4 mm to 1.1 mm. The average value of the differences for all variables was 0.75 mm.
Precision
Precision was very high in both methods, with error magnitudes under 0.5 mm (Table 3). The mean of MADs for all variables derived from 3D photogrammetry was 0.38 mm, which is similar to that for direct anthropometry (0.31 mm). In the 3D photometry, REM ranged from 0.30% to 2.44% and TEM ranged from 0.25 mm to 0.42 mm.
DISCUSSION
The objective of this study was to verify the linear accuracy and precision of virtual imaging and direct integumental measurements obtained from facial scanning by the Morpheus 3D® scanner. The results suggest a fairly good congruence between mean measurement values derived from the 3D photographs and calipers. Although the means of five of the 16 variables differed significantly (p < 0.05) from each other, the magnitude of these differences was typically less than 1 mm (Table 2). In fact, of all the 16 variables considered, the greatest difference between the means was 1.1 mm in Ex-Ex and Lt.Tra-Ck. Moreover, in 12 of the 16 cases, the mean differences were less than 1 mm. These results alone suggest that data derived from the Morpheus 3D® system is highly accurate, especially when compared with analogous data derived from direct anthropometry.
It was difficult for the subjects to relax their facial expressions during measurements of the actual distances between the landmarks dotted near the eyes, such as Ex and En, and the subjects usually constricted the muscles around the eyes as the digital caliper approached. The authors assume that this may have contributed to a mean difference greater than 1 mm in the case of Ex-Ex. On the other hand, En-En distances are relatively shorter than Ex-Ex and are thus less likely to be influenced by changes in facial expression.
Other than Ex-Ex and Lt.Tra-Ck, the measurements in which the magnitude of difference was greater than or equal to 1 mm were Rt.Tra-Ck (1.0 mm), and La1-La2 (1.0 mm), although these differences were not statistically significant. The common feature of these is that at least one of the landmarks is located close to the integration line (Figure 3). In the Morpheus 3D® system, three images (front, right, and left) of each subject are taken individually using a single scanner. These are then combined into a single composite image through registration and integration processes (Figure 4). During these processes, when the images are connected, overlapped areas are removed. If a landmark was located in an integration area, this point would be doubled or would occasionally disappear (Figure 3). We believe that this may have caused an increased magnitude of differences. However, despite this, the overall magnitude of differences was less than 1.0 mm on average.
Determination of the level of precision is critical since increased measurement errors can generate misleading results, especially when comparing groups.15 Almost all the measurements derived from the 3D photographs consistently demonstrated high precision (Table 3). This suggests that the Morpheus 3D® system produces very precise linear facial measurements. The result of the precision estimates showed that the precision level of the 3D photographs was comparable to that of the direct measurements. This demonstrates that the Morpheus 3D® system allows users to repeatedly obtain linear measurements from 3D images with high reproducibility. Based on our results, the errors encountered were associated with landmarks that were located close to the integration line. Occasionally, distortion of images was observed. However, little is known about errors associated with the integration process of the Morpheus 3D® system. Further studies are required to investigate the circumstances under which and the degree to whichthis type of error takes place. Measuring and comparing curved distances on the surface of the actual human face with 3D surface data may disclose the extent of errors associated with the integration line. In addition, superimposition of the surface data acquired from CBCT and Morpheus 3D® scanners may be used to disclose further differences.
CONCLUSION
This study examined the accuracy and precision of a series of standard linear facial measurements obtained by a 3D photogrammetric device designed by the Morpheus Company. The results indicate that the linear measurements obtained using the Morpheus 3D® scanner had high levels of precision and a fairly good congruence with traditional anthropometry, and the average value of the differences was less than 1 mm.


 XML Download