

 PDF
PDF ePub
ePub Citation
 Print
Print


INTRODUCTION
Conventionally, gypsum-based study models have been used as study models for orthodontic diagnosis or for recording treatment changes. However, they have shortcomings related to storage, because they are heavy and bulky, and retrieval problems, as they are subject to fracture and degradation. One solution may be digital storage, which enhances the ease of storage and facilitates easier access and transfer of the records. In cases where physical storage is needed, the solution may be replacement of plaster models with models fabricated using three-dimensional (3D) additive or subtractive rapid prototyping (RP) methods. While the additive RP method is a process of producing a 3D solid object using additive incremental layering, subtractive RP is a process that removes material from a larger piece of material by milling, turning/lathing, or drilling.
To make dental models using the subtractive RP process, a digital impression system and a computerized numeric control (CNC) milling machine can be used together. The iTero® (iTero; Align Technology, Inc., San Jose, CA, USA), a combination of a digital impression system and a CNC milling machine, can produce a polyurethane (PUT) dental model duplicating the patient's dental arch features, which is beneficial for treatment and storage because it is extremely strong, lightweight, and resistant to abrasion.1 In orthodontic practice, a scanning machine can be used to fabricate an Invisalign® (Align Technology, Inc.) clear aligner product to improve accuracy and patient communication, and to streamline work flow and reduce aligner delivery time.2
In maxillofacial surgery practice, stereolithographic models produced by the additive RP method and 3D computed tomography (CT) have been applied as an adjunct to treatment and planning of surgery. Barker et al.3 compared dried skull and duplicated stereolithographic models and reported a mean difference of 0.85 mm, and Kragskov et al.4 found 0.3-0.8-mm differences between 3D CT scan images and stereolithographic models. Recently, Cuperus et al.5 performed a study, which compared human skulls, digital images, and stereolithographic models, and concluded validity of the models.
Conversely, Lill et al.6 applied subtractive RP based on 3D CT images and reported a mean difference of 1.5 mm between PUT models and dried skull bone. Numerous studies have assessed the accuracy of 3D digital models compared to conventional stone models for orthodontic use, and most have reported smaller linear measurements for digital models, with small differences which could be acceptable for clinical use.7,8,9,10,11,12,13 However, studies on the accuracy and precision of dental arch RP models are scarce. As far as we know, only one study has compared stone, digital, and duplicated dental arch models by the additive RP method; Keating et al.14 assessed models and concluded that the detail and accuracy of RP models may not be sufficient for clinical application, while digital models and plaster models showed good agreement.
This study aimed to evaluate the accuracy and precision of PUT dental arch models fabricated using the 3D subtractive RP method with an oral scanning technique, by comparing the linear measurements of PUT models and conventional plaster models (gold standard).
MATERIALS AND METHODS
Preparing models for the experiment
Ten plaster models were duplicated using a selected standard master model by conventional impression, and 10 PUT models were duplicated using the 3D subtractive RP method with an oral scanner. The selected master model was a standard upper dental arch model reproducing natural teeth without missing teeth or prostheses (500B-1; Nissin Dental Products, Inc., Kyoto, Japan), which was expected to reduce possible errors in the scanning procedure. To duplicate 10 plaster models, a mold was fabricated using additive silicon rubber Deguform® (DeguDent GmbH, Hanau-Wolfgang, Germany). After coating the inside of the mold with wetting agent (Picosilk®; Renfert, Hilzingen, Germany), type IV dental plaster (GC Fujirock® EP; GC Corp, Leuven, Belgium) was mixed with water by directed water/powder ratio for 30 minutes, and inserted using a vibrator in order to avoid formation of air bubbles. The plaster models were removed from the mold after 1 hour and incubated at 22℃ and 45% humidity for 24 hour. To duplicate PUT models, a full arch digital impression was constructed by integrating several scanned images obtained from occlusal, buccal, and mesial sides and 45° angulated lingual and distal sides using the iTero? intraoral scanner. After confirming the completeness of the digital model, the PUT models were fabricated using a computer numerical control (CNC) milling machine (Haas VF-2TR; Haas Automation Inc., Oxnard, CA, USA).
Measurement procedure
A non-contact white light scanner (Identica; Medit Co. Ltd., Seoul, Korea) was used to scan the entire surface of the 20 dental arch models. Models were positioned on a rotary stage and digital images of the full dental arch were obtained in the same way. The data were imported into the Delcam Copycad® (Delcam Plc, Birmingham, UK) and designated linear measurements were obtained between points on the x, y, and z-axes. One week after the first measurements were taken, a second set of measurements were taken to assess intra-examiner reliability.
Measurement of models
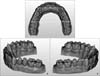
Measurements were evaluated in terms of x, y, and z-axes. In accordance with Creed et al.,15 six points were selected: a and b, the cusp tips of the right and left canines; c and d, the mesiobuccal cusp tips of the right and left first molars; and e and f, the deepest point of the gingival margin of the right and left canines (Figure 1).
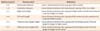
The following linear measurements on the upper dental arch were surveyed (Table 1):
From the cusp tip of the right canine to that of the left canine (a to b)
From the mesiobuccal cusp tip of the right first molar to that of the left first molar (c to d)
From the cusp tip of the canine to the mesiobuccal cusp tip of the first molar on the same side (right side a to c, left side b to d)
From the cusp tip to the deepest point of the buccal gingival margin, right and left canines (a to e and b to f, respectively)
Virtual x, y and z-axes were assumed as described in Alcan et al.16 The x and y-axes corresponded to the buccal-lingual and anterior and posterior on an axial plane when the model was positioned with the occlusal plane oriented in the upper direction. The z-axis was defined as the axis perpendicular to the x and y-axes, similar to the height of the teeth (Figure 1).
The measuring procedure was performed on 10 virtual stone models and 10 virtual PUT models by two trained examiners independently, to enable assessment of inter-examiner variability. One week after the main measuring procedure, one of two examiners repeated the same measuring procedure to evaluate intra-examiner variability.
Estimation of accuracy and precision
In the context of this study, accuracy refers to the degree of closeness of measurements of a dimension to that dimension's actual (true) value, and precision refers to the degree to which repeated measurements under unchanged conditions yield the same results. Accuracy was assessed using mean difference between two measurements, under the assumption that the conventional method using stone models, the gold standard, represents the "true" value. Precision was examined using four values evaluating different aspects of agreement: (1) measurement error (ME) as calculated via Dahlberg's formula17; (2) relative measurement error (RME), the percentage value of the ME divided by the mean of two measurements, to assess precision accounting for the measuring unit of the object in order to enhance comparability18; (3) the limit of agreement (LoA) devised by Bland and Altman,19 representing 95% of actual values in the interval; and (4) the intra-class coefficient (ICC). Graphic assessment of agreement between two measurements was performed using the Bland-Altman plot.19 ME, RME, and LoA were calculated using the following formulas:
Repeatability was evaluated in terms of intra-examiner variability, and reproducibility was assessed in terms of inter-examiner and inter-method variability.
RESULTS
Repeatability of measurements, intra-examiner variability
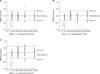
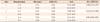
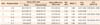
Intra-examiner variability was expressed as ME, RME, LoA and ICC (Table 2). ME ranged from 0.3 mm to 0.74 mm. With regard to intra-examiner variability, the smallest RME of 1.09% was found for the linear distance between c and d (x-axis), while the largest RME of 4.53% was found for the z-axis (b-f). LoA ranged from -0.21 mm to 0.73 mm. All of the ICC values were close to or over 0.8. The Bland-Altman plot showed random dispersion and most observations were located inside the interval of the LoA (Figure 2A).
Reproducibility, inter-examiner variability
Inter-examiner variability is summarized in Table 3. ME ranged from 0.35 mm to 0.78 mm. Similar to the results of inter-examiner variability, the smallest RME of 1.38% was found for the linear distance between c and d (x-axis), while the largest RME of 3.95% was found for the z-axis (b-f). LoA ranged from -0.17 mm to 0.73 mm. The ICC values ranged from 0.75 to 0.81. The Bland-Altman plot showed random dispersion and most observations were located inside the interval of the LoA, with only a few exceptions (Figure 2B).
Reproducibility, inter-method variability
Table 4 shows the inter-method variability comparing conventional stone models and PUT models. The mean difference between stone and PUT models ranged from 0.07 mm to 0.33 mm. ME ranged from 0.60 mm to 1.77 mm. The smallest RME of 2.21% was found for the linear distance between c and d (x-axis), while the largest RME of 7.60% was found for the y-axis (a-c). ICC values ranged from 0.93 to 0.96. The Bland-Altman plot showed random dispersion and most observations were located inside the interval of the LoA (Figure 2C).
DISCUSSION
The purpose of this study was evaluation of the accuracy and precision of PUT dental arch models fabricated by 3D subtractive RP methods with an intraoral scanning technique. Assessing the accuracy and precision of the PUT models entails evaluation of two subsequent procedures: oral scanner and subtractive RP technology. Differences in linear measurements between the PUT models and stone models ranged from 0.07 mm to 0.33 mm, which is relatively small compared to the results of some previous studies using RP models, which have reported linear differences of 0.3-1.5 mm.3,4,5,6 Particularly, compared to a study using subtractive RP reported by Lill et al.6 showing 1.5-mm differences, it may be postulated that the accuracy of the subtractive RP method has improved greatly in the last 10 years. Other indices assessing agreement showed good precision of the subtractive RP method: ME ranged from 0.7 mm to 1.77 mm, all of the RME percentages were less than 8%, and all of the ICC values were greater than 0.93. Further, the assessment of intra- and inter-examiner variability suggested consistency of the measuring procedure. As far as we know, this is the first study assessing the accuracy and precision of 3D subtractive RP dental models.
Dahlberg's formula has been used the most frequently in assessing precision in orthodontic studies. BeGole21 reported that Dahlberg's formula had been used in 56% of reliability/error tests among 203 articles in major orthodontic journals published in 1997. The merits of Dahlberg's formula include that the original unit is preserved, and interpretation can be relatively easy because its form is similar to that of standard errors. However, a shortcoming of it may be that there is no standard of acceptable ranges because units of measurements are quite different in different cases. Therefore, we introduced the RME, the percentage of ME of the mean linear measures, to enable direct comparison between measurements with different units. In accordance with Henriksen et al.,18 we deemed that the acceptable range included values below 8%.
Many previous studies7,9,11,12,13,22,23,24 have adopted the paired t-test to assess whether mean differences between two corresponding measurements are statistically significant, and have mistakenly interpreted the results as evidence of agreement. According to Linnet,25 the paired t-test should not be applied uncritically to method comparison data, and the test should only be applied when graphic display suggests a systematic constant difference. Similarly, Donatelli and Lee26 showed typical examples of erroneous conclusions that may be reached via the paired t-test in the context of the Bland-Altman plot.
In this study, linear measurements of PUT models tended to be smaller than those of stone models. One of the reasons for the discrepancy may be related to the geometry of milling burs, including their diameter, and the milling direction. As Reich et al.27 suggested, the diameter of the milling bur may determine the smallest grindable radius, and therefore excessive removal may have occurred on line angles or complicated occlusal surfaces, while more exact removal is expected on flat axial surfaces. Possible errors may arise in the complicated procedure of intra-oral scanning, which requires integration of several oral images taken repeatedly. The iTero® digital impression system used in this study is based on the theory of parallel confocal: a beam of light emitted through a small hole is reflected by the target surface and moves toward the wand. The iTero® system projects 100,000 beams of red light and converts the reflected light into digital data, and therefore it produces accurate imaging data. Another advantage of the system is that there is no need for a reflecting agent powder as the laser can reflect off all oral structures.28
The additive RP method has been more frequently used in craniofacial and maxillofacial fields, owing to its advantages in fabricating physical models with complex structures and cavities as compared to the subtractive RP method. The quality of milled models has historically been poor because soft and brittle PUT foam was used, and there was limited development of the milling machine.6,29 However, the recent use of high strength PUT blocks and multiple-axis milling machines enables production of a variety of complex geometries from a vast array of materials.30 Further studies are required incorporating patients under clinical conditions as subjects, that may involve missing or malpositioned teeth and fixed dental prostheses, because this study was limited to the use of a standard master model and duplicated sample models, in a laboratory setting.
CONCLUSION
We concluded that based on this study, the accuracy and precision of PUT dental models in evaluating the performance of oral scanner and subtractive RP technology was acceptable. Owing to recent improvements in block material and CNC milling machines, the subtractive RP method may now be a good choice for dental arch models.

 XML Download