

 PDF
PDF ePub
ePub Citation
 Print
Print


INTRODUCTION
Orthodontic diagnosis and treatment planning have generally been based on hard-tissue relationships and Angle's classification of malocclusion. However, the facial appearance is as important as the occlusal relationship. Given that the soft tissue reflects the hard-tissue changes achieved by orthodontic treatment, orthodontists must also consider the limitations of the facial soft tissue as well as its appearance.1
The facial soft tissue varies according to gender, age, race, and nutritive conditions. Information on the average facial soft-tissue thickness is important for evaluating the facial soft tissue. The facial soft-tissue thickness can be measured by several methods. For example, it can be measured at landmarks on the head and neck by probing on deceased individuals. However, this method is limited by sample size. Further, Simpson and Henneberg reported that preservative treatment increases the actual measurement by 50 - 60%.2 Doubts have also been raised about measurement errors due to soft-tissue shrinkage by dehydration in the early stage of death, inappropriate needle positioning, and angulation of the underlying bony surface. Moreover, soft-tissue differences by age, gender, body type, and so on are difficult to evaluate even with an adequate number of samples because of the excessive time and human resources required.3
Cephalometric analysis of the facial soft-tissue thickness does not permit evaluation of disharmony in horizontal relationships such as facial asymmetry and incorporates errors during the two-dimensional measurement of three-dimensional (3D) facial and cranial structures.4,5 Ultrasound is simple and inexpensive, requires no radiation exposure, and can be performed with the patient seated.
High-resolution imaging methods such as computed tomography (CT) and magnetic resonance imaging (MRI) allow the capture and modification of cross-sectional images of complex anatomical structures and thus enable 3D soft-tissue measurement. Although MRI has the advantages of no radiation exposure and simple observation of the soft tissue, the patient must remain immobile for over 10 minutes. CT involves radiation exposure and high cost, but it enables quantitative evaluation of the hard and soft tissues, prevents superimposition of anatomical structures, and allows observation of deeper regions by modification of the Hounsfield unit (HU). Especially, hard- and soft-tissue measurements on 3D models reconstructed from CT images show only 0.83% and 1.78% error rates, respectively; therefore, nearly accurate measurement is possible. Furthermore, CT permits easier and faster measurement of the soft-tissue thickness in different areas than the conventional method.6
In patients with facial asymmetry and severe class II or III malocclusion, the soft tissue becomes asymmetrical because of the underlying skeletal shape. When visualized treatment objectives is conducted in the procedure for planning orthognathic surgery, the ratio of the soft-tissue transition to the hard-tissue change is generally calculated. However, because the soft tissue is also influenced by functional factors such as the thickness and stretchability of the musculature, precise analysis of the soft-tissue characteristics is required to predict the surgical outcomes.
The purpose of this study was to standardize the facial soft-tissue characteristics of South Korean adults according to gender by measuring the soft-tissue thickness of young men and women with normal facial profiles using 3D reconstructed models.
MATERIALS AND METHODS
Subjects
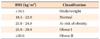
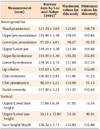
One hundred thirty-five students of Dankook University underwent oral examinations and model and facial analyses. The subjects of this study were 40 young adults (22 men and 18 women) (Table 1). The inclusion criteria were as follows: (1) age in the twenties; (2) no congenital facial deformities such as cleft palate and cleft lip; (3) normal body mass index (BMI) according to the International Obesity Taskforce (IOTF) classification (Table 2)7; (4) no severe anterior protrusion and facial asymmetry; (5) both overjet and overbite within 7 mm; and (6) ideal soft-tissue profile according to Lundström ratio analysis8 and the Lee and Nahm average data for Koreans9 (Tables 3 and 4).
Every subject gave written informed consent for participation, and the Institutional Review Board of Dankook University approved the study design (No. H-0905/012/001).
CT imaging
For CT imaging (Somatom Emotion 6: six channels, 400 V, 50 Hz; Siemens AG, Munich, Germany), each subject was positioned with the Frankfurt horizontal (FH) plane perpendicular to the floor. The axis of the imaging unit was set according to the midsagittal plane and scanning of the craniofacial region including the maxilla and mandible was performed. The exposure conditions were 0° gantry angulation, 120 kV, auto mA, 0.625 - 1.25 mm slice thickness, slice pitch 3, 4-second scanning time, and 250 mm field of view.
3D reconstruction
The scans were saved in Digital Imaging and Communications in Medicine (DICOM) format, transferred to a personal computer, and reconstructed with a 3D image-segmentation program (Mimics 10.01; Materialise, Leuven, Belgium). The software uses the existing coronal view to create cross-sections in the sagittal and frontal views. The HU, which expresses the gray scale, was adjusted for each tissue in the CT system: 443 - 3,027 HU for the hard tissue and -700 - 225 HU for the soft tissue. The 3D volume rendering was performed by triangulation (Figure 1).
Measurements
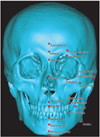
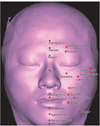
Bony landmarks were marked on the 3D reconstructed hard-tissue model (Figure 2) and the closest soft-tissue landmarks were determined in the sagittal view (Table 5 and Figure 3). A single examiner performed all the measurements by using the measurement tool in the Mimics program. To determine the measurement reliability, the soft-tissue thickness at each landmark was measured twice and the intraobserver difference (first measurement - second measurement) was recorded.
Statistical analysis
The SPSS 12.0 program for Windows (SPSS Inc., Chicago, IL, USA) was used for statistical analysis. Descriptive statistics (means, standard deviations, and minimum and maximum values) were calculated. The Mann-Whitney U-test was used to compare the soft-tissue thickness between the male and the female subjects. The paired t-test was used for analyzing the reproducibility of the measurements (Table 6).
RESULTS
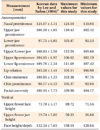
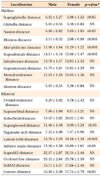
Table 7 shows the mean facial soft-tissue thickness at different landmarks according to gender. The men had significantly thicker soft tissue at the supraglabella, nasion, rhinion, mid-philtrum, supradentale, and supraglenoid points. The soft tissue of the female subjects was significantly thicker at the lateral orbit, inferior malar, and gonion points.
DISCUSSION
As the demand for facial esthetics increases, the paradigm of orthodontic treatment is shifting from hard-tissue-based treatment to soft-tissue-based treatment. The facial characteristics cannot be predicted solely on the basis of the hard tissue; therefore, the soft tissue must also be considered during facial analysis.
CT imaging shows the 3D cross-sections and volume of craniofacial regions without magnification and distortion, which makes it a very useful diagnostic method. Cone-beam CT, which has recently been introduced in dentistry, is interesting because of the low radiation exposure and low cost. However, its main limitations when compared with conventional CT are the lack of a soft-tissue window, lack of precise HU, and high image noise.10 Therefore, in the present study, multidetector CT imaging was used for precise 3D reconstruction of the facial soft tissue, reducing measurement errors.11
An inclusion criterion in this study was a normal facial profile, which is a vague concept compared with normal occlusion. Previous studies did not have a clear definition of the normal facial profile and included only subjective assessments categorized on the basis of occlusion or presence of deformity. Further, studies using cephalometric analysis evaluated mainly skeletal relationships and analysis of facial harmony showed wide deviations and insufficient aspect. Therefore, evaluation of the soft tissue is necessary to establish criteria for esthetic facial shapes. Lundström et al.8 evaluated soft-tissue esthetics with ratios by using the lateral view of radiographs obtained in the natural head position and clinical photographs to measure the distances from the true vertical line passing through the porion to various landmarks on the soft-tissue profile. In this regard, evaluation by ratios rather than absolute values is reasonable because ratios are unaffected by the absolute size of individuals and effective for comparing entities with wide variation.12 In this study, we utilized the Lundström ratio analysis method8 for the measurements and referenced the ideal range for normal Korean adults from the Lee and Nahm study9 to exclude subjectivity.
Previous studies involving CT images established soft-tissue landmarks first and measured the perpendicular distances to the underlying bony surface or used 3D reconstructed hard-tissue models and transparent 3D reconstructed soft-tissue models to measure the distance between points.13 However, soft-tissue landmarks lack anatomical reference points and include too many variables, which limit reproducibility. Therefore, we established the hard-tissue landmarks first and determined the corresponding soft-tissue landmarks as the closest points after confirmation on cross-sectional images in the frontal, sagittal, and coronal views.
Studies of the soft-tissue thickness have also been performed in other countries and races.14,15 From the racial viewpoint, African-American individuals reportedly have thicker facial soft tissue than do biracial people in both the genders, and the soft-tissue thickness of biracial men and women is quite different from that of White American individuals. Another study suggested that the soft-tissue thickness of Saudi Arabian people differs from that of causasians.16 Furthermore, northwest Indian individuals reportedly show soft-tissue differences compared with African-American and biracial South African, European American, and Japanese people.17 However, as the landmarks used for the measurements differ according to the study, comparability of the previous results is limited. Future research should discriminate racial differences after standardization of soft-tissue landmarks.
In general, the skin of women lacks collagen synthesis and facilitated synthesis of hyaluronic acid due to estrogen. On the other hand, men tend to have thicker skin because testosterone facilitates collagen synthesis. In this study, the men and women showed significant differences in the facial soft-tissue thickness. The normal body weight of men includes 9 - 18% subcutaneous fat, and 14 - 20% of the normal body weight of women comprises subcutaneous fat. This difference in subcutaneous fat can affect the facial soft-tissue thickness as well. In the face, the cheek, cheek-to-eye, cheek-to-lower mandibular border, and chin tip-to-neck regions generally contain the most amount of subcutaneous fat. These regions are termed as the buccal fat pad, infraorbital eye bag, and wattle of the anterior neck, respectively. The soft-tissue thickness at the lateral orbit, inferior malar, and gonion points in our study corresponds to the major areas of facial subcutaneous fat; the chin tip-to-neck region was not investigated because of the lack of landmarks.
Knowledge of the gender differences in adipose tissue are important for predicting variations and evaluating the prognosis of orthodontic treatment or orthognathic surgery. More esthetic results are achievable by considering the mean thickness of the facial soft tissue in treatment planning. In general, the soft-tissue thickness tends to increase with increasing weight, especially in the cheek and mandibular regions except for the nasion, pogonion, menton, maxillare, and zygion areas.18,19 Moreover, according to Kim et al.,3 the facial soft tissue tends to be thicker in men than in women, especially in the subnasale area. On the other hand, Codinha18 suggested that men generally have thicker soft tissue but women have thicker soft tissue in the cheek area. With regard to age, some landmarks show weak correlation, mainly because wrinkles form due to decreased skin elasticity from aging. Sahni et al.17 suggested that wrinkles in skin are related to the soft-tissue thickness because of reduced skin elasticity and decreased collagen thickness. Until now, studies concerning age and facial tissue have shown limited evidence of differences between adults and children. The subject age in this study was limited to the twenties to minimize variables such as wrinkles and because the twenties are the most sensitive age group for facial esthetics. Moreover, nutritive conditions can affect the facial soft-tissue thickness, because of the fat found in the infraorbital, zygomatic, and malar regions. To reduce the influence of nutritive conditions, we measured the BMI of the subjects. The BMI is an indicator of body fat and the most widely used index to check obesity. We selected subjects within the normal range of BMI for Asia proposed by the IOTF.7
According to Kohn et al.,20 measurements using 3D images of the craniofacial region involve three types of errors: errors in the formation of digital images, errors in the identification of proper landmarks, and software manipulation error by the examiner while establishing landmarks where the z-axis should be considered. In this study, to reduce measurement errors, the landmarks were chosen in the most magnified images, subtle positional differences were minimized, and the landmarks were checked in the frontal and sagittal views. Especially for bilateral structures, any differences in the spatial positions were checked. If a difference was noted, the average measurement was calculated from the average of the left and right values.
Future studies should focus on further landmark establishment and measurement, thus providing additional information on the mean facial soft-tissue thickness of individuals with normal features and the related differences according to age and gender. Standardization of the measurements by using a larger sample size would help to detail the facial soft-tissue characteristics of South Korean people and assist studies in anthropology and prediction of changes in facial shape in Koreans. Furthermore, investigations using different image reconstruction intervals and slice thicknesses are warranted to standardize the exposure conditions for accurate measurement of the facial soft-tissue thickness.
CONCLUSION
The facial soft-tissue thickness of South Korean adults with normal facial profiles varies in different facial areas according to gender. The supraglabella, nasion, rhinion, mid-philtrum, supradentale, and supraglenoid regions seem to have thicker soft tissue in men and the soft-tissue in the lateral orbit, inferior malar, and gonion regions tends to be thicker in women. The present results would help in orthodontic diagnosis and treatment planning and provide a suitable reference to predict the outcomes of orthognathic surgery.


 XML Download