Journal List > Endocrinol Metab > v.35(1) > 1144259

Hong, Park, and Rhee: Machine Learning Applications in Endocrinology and Metabolism Research: An Overview

Abstract

Machine learning (ML) applications have received extensive attention in endocrinology research during the last decade. This review summarizes the basic concepts of ML and certain research topics in endocrinology and metabolism where ML principles have been actively deployed. Relevant studies are discussed to provide an overview of the methodology, main findings, and limitations of ML, with the goal of stimulating insights into future research directions. Clear, testable study hypotheses stem from unmet clinical needs, and the management of data quality (beyond a focus on quantity alone), open collaboration between clinical experts and ML engineers, the development of interpretable high-performance ML models beyond the black-box nature of some algorithms, and a creative environment are the core prerequisites for the foreseeable changes expected to be brought about by ML and artificial intelligence in the field of endocrinology and metabolism, with actual improvements in clinical practice beyond hype. Of note, endocrinologists will continue to play a central role in these developments as domain experts who can properly generate, refine, analyze, and interpret data with a combination of clinical expertise and scientific rigor.

INTRODUCTION

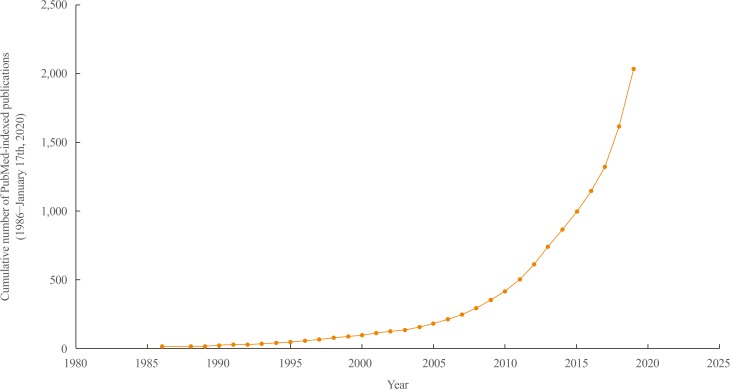
The use of machine learning (ML) applications in various fields of health research are rapidly expanding, and ML has the potential to improve the current health system and clinical practice. In endocrinology and metabolism research, the number of publications on ML has exponentially increased, reaching roughly 2,000 publications by the end of the last decade (PubMed query: Search ((((((“Machine Learning”[Mesh]) OR “Artificial Intelligence”[Mesh]) OR “Deep Learning”[Mesh])) OR (((machine learning [Title/Abstract]) OR artificial intelligence[Title/Abstract]) OR deep learning[Title/Abstract]))) AND ((((((((endocrinology[Title/Abstract]) OR diabetes[Title/Abstract]) OR pituitary[Title/Abstract]) OR thyroid[Title/Abstract]) OR adrenal gland[Title/Abstract]) OR osteoporosis[Title/Abstract])) OR ((((((“Endocrinology”[Mesh]) OR “Diabetes Mellitus”[Mesh]) OR “Pituitary Gland”[Mesh]) OR “Thyroid Gland”[Mesh]) OR “Adrenal Glands” [Mesh]) OR “Osteoporosis”[Mesh])); search date: January 1st, 1986 to January 17th) (Fig. 1). The accumulation of structured or unstructured medical data, the exponential growth of available computing power, and the availability of useful open resources for implementing ML have contributed to the expanding ML applications in health care. In this review, a brief overview of the basic concepts of ML, exemplary studies of ML applications in endocrinology research, and related perspectives will be provided for endocrinologists and clinical practitioners who are becoming interested in the principles of ML.

MACHINE LEARNING: A BRIEF INTRODUCTION

Artificial intelligence, machine learning, and deep learning

The terms “artificial intelligence (AI),” “ML,” and “deep learning” are often used concomitantly and sometimes interchangeably in the medical literature. The U.S. Food and Drug Administration defined AI as “the science and engineering of making intelligent machines, especially intelligent computer programs,” based on the definition proposed by McCarthy [12]. Learning and reasoning are the main functions that intelligence refers to in this context, although intelligence more broadly includes self-awareness, introspection, action, heuristics, and practical knowledge [1]. ML is defined as an “AI technique that can be used to design and train software algorithms to learn from and act on data,” as a subset of AI. Therefore, all ML counts as AI, but not all AI involves ML. Deep learning, also known as deep neural networks, refers to a subset of ML algorithms implemented by stacked multilayer neural networks, mimicking the neural architecture of the human brain. As noted in a summary report from the Third Annual Machine Learning for Health Workshop held in December 2018, traditional technical researchers and communities appear to favor the term “ML” when describing the methodology underlying their work. However, clinicians tend to prefer using “AI” as an umbrella term in the medical literature, and this discrepancy might need to be resolved in order to remove potential terminological barriers and to prevent unnecessary confusion among research communities [3].

Machine learning algorithms and performance metrics

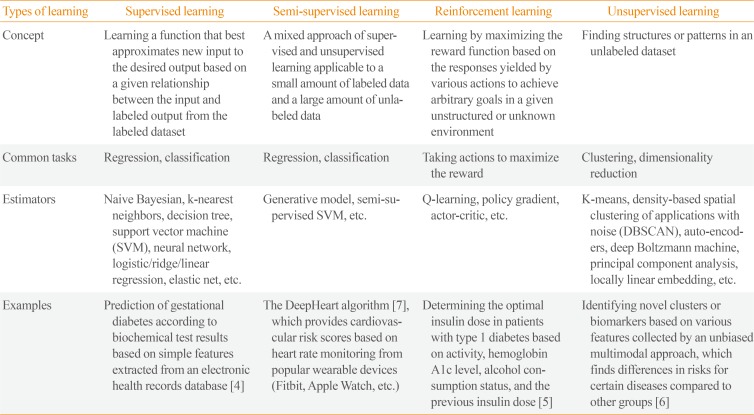
ML algorithms can be classified into four main categories: supervised, semi-supervised, unsupervised, and reinforcement learning (Table 1) [4567]. Supervised learning requires a labeled dataset with output mapped to input to train a function. The goal of supervised learning is to derive a function that infers the most desired output for new input from the previously labeled dataset. Unsupervised learning explores structures or patterns in unlabeled datasets to achieve clustering or dimensionality reduction. Semi-supervised learning is a blend of those two approaches that is suitable for datasets with a small amount of labeled data and extensive unlabeled data. Reinforcement learning is suitable for finding optimal actions in an unstructured and complex environment by maximizing the cumulative rewards from actions taken in that environment. Unlike supervised learning, which is based on prior knowledge of input-output mapping at the start, a reinforcement learning function evolves sequentially by collecting information on every action-response relationship during the task. Although some guidance on selecting an estimator can be obtained from a so-called “cheat-sheet” for initial ML estimators (scikit-learn; https://scikit-learn.org/stable/tutorial/machine_learning_map/index.html), a one-size-fits-all approach may not be applicable in most cases. Estimators are often chosen through an iterative process that takes into account the quantity, structure, and extendibility of the dataset, the characteristics of the research hypothesis or problems, the performance of trained functions, and researchers' experiences and intuition (Fig. 2). Choosing the performance metrics that best suit the research purpose is another task that needs to be carefully accomplished after establishing an ML model (Supplemental Table S1) [891011].

MACHINE LEARNING APPLICATIONS IN ENDOCRINOLOGY AND METABOLISM

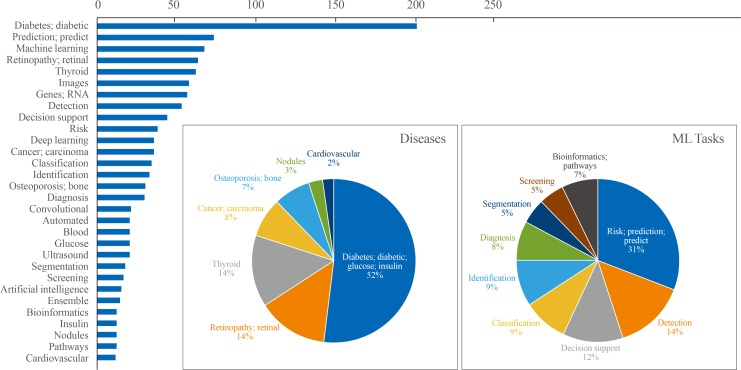
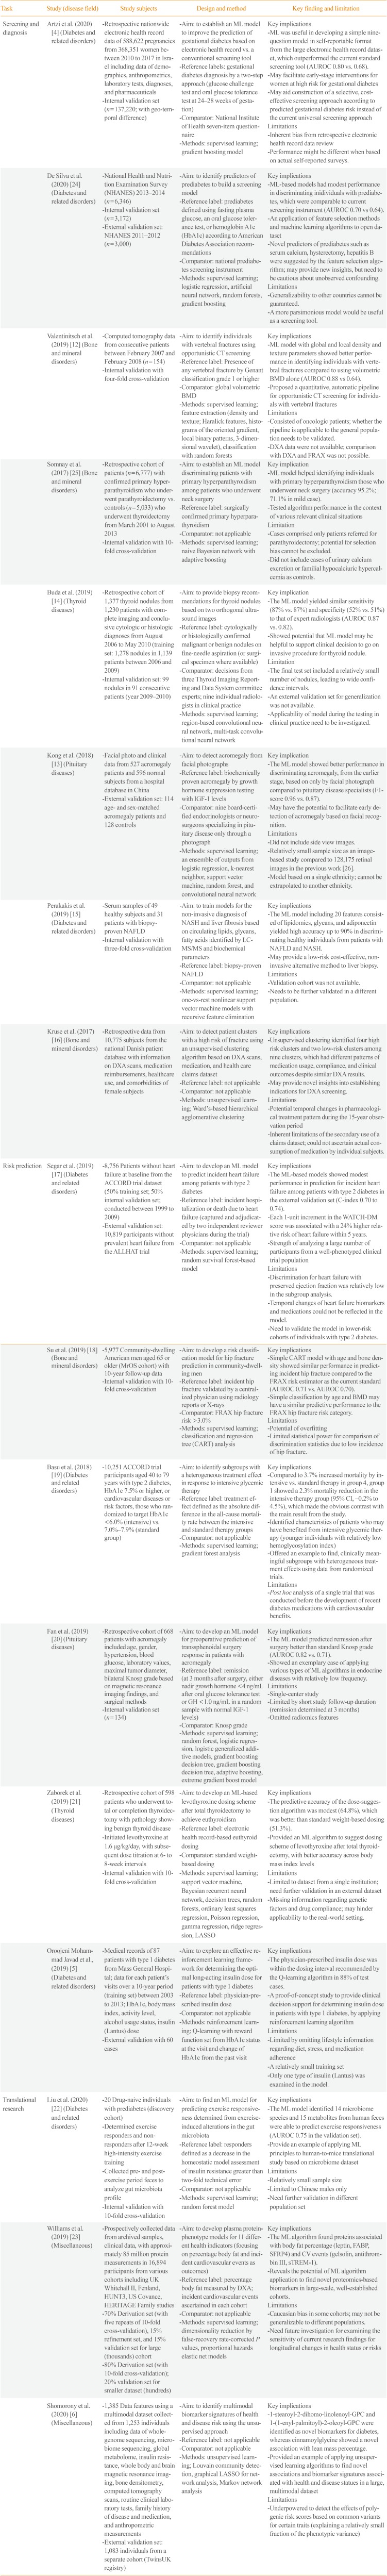
Results of the text analysis on the titles of literature were presented as Fig. 3. The titles of 611 studies (English language, human study, not a review or meta-analysis) published within the last 5 years were parsed to count the frequency of words that appeared. Among a total of 2,115 words, the top 30 words with high frequency were analyzed. Among diseases, ‘diabetes’ or ‘diabetic’ appeared most frequently among the top 30 words (52%), followed by retinopathy (14%), thyroid (14%), carcinoma (8%), and osteoporosis (7%). Regarding ML tasks, ‘risk prediction’ or ‘predict’ accounted for 31%, and the composite of ‘detection,’ ‘classification,’ ‘identification,’ and ‘diagnosis’ reached up to 40%, followed by ‘segmentation’ (5%) or ‘bioinformatics’ (7%). In this section, studies were summarized to present some exemplary cases in utilizing ML applications in the endocrinology and metabolism field. Seventeen studies were arbitrarily chosen on the basis of (1) the balance between disease fields (diabetes, thyroid, pituitary, and bone and mineral disorders), (2) inclusion of at least one study which illustrates the various types of ML applications (supervised, unsupervised, and reinforcement learning), and (3) the publication date within last 3 years. The research topics were categorized into screening and diagnosis, risk prediction, and translational research based on frequently appeared ML tasks from text analysis (Fig. 3), with subcategories that were not mutually exclusive in some cases. It should be noted that the selected studies might not be sufficient to reflect an entire trend of ML applications in the endocrinology field, but it can provide practical examples for understanding the utility of ML algorithms applied to various fields of endocrine researches. The details of the reviewed studies are summarized in Table 2 [456121314151617181920212223242526].

Screening and diagnosis

Improvement of screening strategies

The development of efficient screening tools for endocrine disorders may have clinical impacts, both in terms of improved prognoses of individual patients through disease detection at an earlier stage and the cost-effective allocation of public health resources by focusing on individuals with a high risk of disease and avoiding unnecessary testing in low-risk groups. Researchers have sought to determine whether ML algorithms are able to provide a better way of screening for various endocrine diseases. Artzi et al. [4] provided an excellent example of applying the principles of ML to find useful screening tools for gestational diabetes based on a sizeable electronic health record (EHR) database. EHR data of 588,622 pregnancies from 368,351 women collected at the nationwide level in Israel between 2010 and 2017 were used to train an ML model to predict the risk of gestational diabetes. Among 2,355 candidate features, the researchers developed a simple model consisting of only nine self-reportable questions (without previous laboratory results in some cases) based on a gradient boosting model, which showed fair discriminatory performance (area under the receiver operating characteristic curve, 0.80 vs. 0.68 for the conventional glucose challenge test at 24 to 28 weeks of gestation) even at an earlier time point relative to the initiation of pregnancy. Medical image data have the potential to provide features suitable for the opportunistic screening of endocrine disorders. Valentinitsch et al. [12] trained an ML model to identify individuals with prevalent vertebral fractures based on non-fractured vertebral regions in computed tomography scans taken for various purposes. By combining global and local density and texture parameters, the ML model outperformed volumetric bone mineral density (BMD) alone in discriminating the presence of vertebral fractures, suggesting the potential of a semi-automated pipeline for the opportunistic screening of individuals with a high risk of fracture. Kong et al. [13] developed an ML model to detect facial features from photos of patients with acromegaly, and their model may have the potential to help the detection of acromegaly at an earlier stage.

Facilitating the diagnostic workflow

Tackling the gray area of diagnostic uncertainty with new modalities has always been an important task for clinicians. Asymptomatic hyperparathyroidism can be challenging to identify without a high index of suspicion because it involves subtle biochemical changes and its phenotype overlaps with those of primary osteoporosis and other rare mineral disorders, including familial hypocalciuric hypercalcemia [27]. Somnay et al. [25] trained an ML model to identify patients with primary hyperparathyroidism among patients who underwent neck surgery, including thyroidectomy or parathyroidectomy, although relatively low performance was shown for mild disease. Several studies have shown that ML could support the decision process of whether to perform an invasive biopsy on a thyroid nodule based on ultrasonography, with good classification performance similar to that of radiology experts; therefore, ML classifications might potentially provide guidance to operators during data acquisition and measurement [1428]. A well-validated, accurate, non-invasive ML model may have the potential to replace standard invasive diagnostic modalities for certain diseases. For instance, the global burden of nonalcoholic fatty liver disease (NAFLD) is rapidly growing, but invasive liver biopsy remains the gold standard for diagnosing NAFLD and nonalcoholic steatohepatitis. Perakakis et al. [15] developed a support vector machine-based model to classify NAFLD based on features obtained from the lipidomic, glycomic, and liver fatty acid analysis of serum samples. For the presence of liver fibrosis, a parsimonious exploratory model with 10 lipid species showed high accuracy (up to 98%), suggesting the possibility of a targeted lipidomic approach as an alternative non-invasive diagnostic tool, although the model needs to be further validated in other ethnicities and individuals with a milder spectrum of liver diseases [29].

Finding novel disease clusters and associations

Although unsupervised learning has been utilized less often than supervised learning for diagnosis and screening, it may be helpful to find novel clusters and associations within a given dataset. Kruse et al. [16] applied unsupervised hierarchical agglomerative clustering to find groups with high and low risks of fracture in women from a national Danish patient database based on BMD, medication reimbursement, anthropometric characteristics, and comorbidities. Among the nine clusters that were identified, four clusters classified as corresponding to a high risk of fracture showed heterogeneous compliance to antiresorptive treatments, even with a similar distribution of BMD. The age of 60 years was the earliest time point that allowed a clear discrimination between high and average fracture risk. Altogether, that study provided novel insights regarding characteristics related to compliance with bone medications and the optimal age to recommend dual-energy X-ray absorptiometry screening.

Risk prediction

Clinical outcomes

Accurately predicting clinical outcomes enables an individualized approach to treatment strategy and monitoring. The Weight, Age, hyperTension, Creatinine, High-density lipoprotein cholesterol, Diabetes control, and Myocardial infarction (WATCH-DM) score was developed to predict heart failure risk among patients with type 2 diabetes using ML algorithms based on the Action to Control Cardiovascular Risk in Diabetes (ACCORD) trial dataset, and showed good predictive performance with an external validation set (the Antihypertensive and Lipid-Lowering Treatment to Prevent Heart Attack Trial [ALLHAT]) [17]. Su et al. [18] found that a simple model including only age and BMD selected by classification and regression tree analysis performed similarly to Fracture Risk Assessment Tool (FRAX) categories as a reference tool for predicting incident hip fracture in a large cohort of community-dwelling older men.

Treatment responses

ML principles can be used to find specific subgroups with a heterogeneous response to treatment. Basu et al. [19] re-analyzed the ACCORD trial data to find subgroups with different treatment effects in response to intensive glucose control compared to standard therapy. Although intensive glucose control was associated with increased mortality in the ACCORD trial published in 2008, their post hoc analysis identified that a subgroup of patients experienced a survival benefit from intensive treatment, and the proportion of patients in the subgroup that made the main contribution to increased mortality in the trial was relatively small. This study provides an example of the utility of ML in dissecting treatment responses, with the potential for a more tailored approach both for interpreting results from previous trials and for applying therapeutic strategies according to individual status. For the prediction of treatment response in patients with acromegaly, anthropometric and biochemical data with imaging features were combined in an ML model that achieved better prognostication than the reference prediction tool [20]. Good ML models may have the potential to provide guidance for dose adjustment, particularly in patients with chronic conditions requiring the indefinite replacement of certain hormones, as in patients who receive thyroid hormone replacement after total thyroidectomy or in type 1 diabetes patients who receive insulin replacement. Zaborek et al. [21] built a supervised ML model to guide levothyroxine dose adjustment, which showed a fair improvement of predictive accuracy compared to the current standard of weight-based dosing. A reinforcement training algorithm has been applied to guide the optimal dosing of long-acting insulin in patients with type 1 diabetes [5]. Although the results are preliminary, these studies illustrate the ongoing efforts made by endocrinology researchers to improve patient care by achieving better predictions of the disease course and response to treatment.

Translational research

ML algorithms have become a crucial methodology in translational research with the rise of the multi-omics approach, which produces abundant datasets with numerous features to be accounted for. Liu et al. [22] used an ML algorithm to find key microbiota species and metabolites highly related to exercise responsiveness in humans. Human exercise responders and non-responders had different patterns of exercise-induced alterations in the gut microbiota, and fecal microbial transplantation from responders to mice conferred the benefits of exercise on insulin sensitivity. A random forest algorithm was used to select 19 features (14 species and 15 metabolites) showing a major difference between the exercise-responsive and nonresponsive groups among thousands of microbiota species and metabolites, and these features have the potential to be utilized as biomarkers for personalized responses to exercise. Another study aimed to discover proteomics-based biomarkers for 11 health outcomes, including percentage body fat, lean mass, current smoking, and risk of incident cardiovascular outcomes [23]. By combining large, well-established, community-based cohort databases and samples, the authors took a comprehensive approach to find highly predictive proteins and related models using elegant ML-based techniques, although the actual applicability of these findings needs to be validated in long-term studies in different populations. Unsupervised learning was also applied to find significant associations and interactions among multimodal datasets, providing novel insights for potential metabolite biomarkers of diabetes and sarcopenia [6].

CONCLUSIONS

High-quality ML-based endocrinology research, like research in other medical fields, requires a clear, testable hypothesis based on unmet clinical needs, combined with access to a dataset that provides sufficient information to solve the problem. As Kim et al. [30] clearly addressed in a previous issue of this journal, the ability to access a large volume of medical data itself does not necessarily enable (or mandate) an ML-based approach due to the inherently unrefined, heterogeneous nature of most current medical datasets. Well-designed, timely study designs based on clinical expertise, an emphasis on using a standardized approach to control data quality (beyond a focus on data quantity alone and methodological complexity), collaboration and open communication between clinical domain experts and ML engineers, developing interpretable ML models in contrast to the black-box nature of some algorithms, and creating a supportive environment with input from government, profit or non-profit sectors, study participants, and patients are the core prerequisites for the promising changes that are expected in clinical practice in the field of endocrinology and metabolism through the convergence of artificial and human intelligence [31]. The role of endocrinologists as domain experts will remain crucial for achieving these prerequisites by examining the true clinical impact of flourishing ML-based research products in prospective studies and by ensuring the scientific rigor needed to the benefits of this convergence for patients who suffer from endocrine diseases.

ACKNOWLEDGMENTS

This work was supported by a grant of the Korea Health Technology R&D Project through the Korea Health Industry Development Institute (KHIDI), funded by the Ministry of Health & Welfare, Republic of Korea (grant number: HI18C0474). We thank Minheui Yu and Doori Cho, the members of the SENTINEL (Severance ENdocrinology daTa scIeNcE pLatform) team for technical assistance in searching and summarizing the relevant literature (4-2018-1215).

Notes

CONFLICTS OF INTEREST: No potential conflict of interest relevant to this article was reported.

References

1. McCarthy J. From here to human-level AI. Artif Intell. 2007; 171:1174–1182.
crossref
2. McCarthy J. What is artificial intelligence? [Internet]. Stanford: Stanford University;2007. cited 2020 Feb 24. Available from: http://www-formal.stanford.edu/jmc/whatisai/.
3. Beaulieu-Jones B, Finlayson SG, Chivers C, Chen I, McDermott M, Kandola J, et al. Trends and focus of machine learning applications for health research. JAMA Netw Open. 2019; 2:e1914051. PMID: 31651969.
crossref
4. Artzi NS, Shilo S, Hadar E, Rossman H, Barbash-Hazan S, Ben-Haroush A, et al. Prediction of gestational diabetes based on nationwide electronic health records. Nat Med. 2020; 26:71–76. PMID: 31932807.
crossref
5. Oroojeni Mohammad Javad M, Agboola SO, Jethwani K, Zeid A, Kamarthi S. A reinforcement learning-based method for management of type 1 diabetes: exploratory study. JMIR Diabetes. 2019; 4:e12905. PMID: 31464196.
crossref
6. Shomorony I, Cirulli ET, Huang L, Napier LA, Heister RR, Hicks M, et al. An unsupervised learning approach to identify novel signatures of health and disease from multimodal data. Genome Med. 2020; 12:7. PMID: 31924279.
crossref
7. Ballinger B, Hsieh J, Singh A, Sohoni N, Wang J, Tison GH, et al. DeepHeart: semi-supervised sequence learning for cardiovascular risk prediction [Internet]. arXiv;2018. cited 2020 Feb 24. Available from: https://arxiv.org/abs/1802.02511.
8. Dinga R, Penninx BW, Veltman DJ, Schmaal L, Marquand AF. Beyond accuracy: measures for assessing machine learning models, pitfalls and guidelines. bioRxiv. 2019; 743138. DOI: 10.1101/743138.
crossref
9. Handelman GS, Kok HK, Chandra RV, Razavi AH, Huang S, Brooks M, et al. Peering into the black box of artificial intelligence: evaluation metrics of machine learning methods. AJR Am J Roentgenol. 2019; 212:38–43. PMID: 30332290.
crossref
10. Saito T, Rehmsmeier M. The precision-recall plot is more informative than the ROC plot when evaluating binary classifiers on imbalanced datasets. PLoS One. 2015; 10:e0118432. PMID: 25738806.
crossref
11. Chicco D, Jurman G. The advantages of the Matthews correlation coefficient (MCC) over F1 score and accuracy in binary classification evaluation. BMC Genomics. 2020; 21:6. PMID: 31898477.
crossref
12. Valentinitsch A, Trebeschi S, Kaesmacher J, Lorenz C, Loffler MT, Zimmer C, et al. Opportunistic osteoporosis screening in multi-detector CT images via local classification of textures. Osteoporos Int. 2019; 30:1275–1285. PMID: 30830261.
crossref
13. Kong X, Gong S, Su L, Howard N, Kong Y. Automatic detection of acromegaly from facial photographs using machine learning methods. EBioMedicine. 2018; 27:94–102. PMID: 29269039.
crossref
14. Buda M, Wildman-Tobriner B, Hoang JK, Thayer D, Tessler FN, Middleton WD, et al. Management of thyroid nodules seen on US images: deep learning may match performance of radiologists. Radiology. 2019; 292:695–701. PMID: 31287391.
crossref
15. Perakakis N, Polyzos SA, Yazdani A, Sala-Vila A, Kountouras J, Anastasilakis AD, et al. Non-invasive diagnosis of non-alcoholic steatohepatitis and fibrosis with the use of omics and supervised learning: a proof of concept study. Metabolism. 2019; 101:154005. PMID: 31711876.
crossref
16. Kruse C, Eiken P, Vestergaard P. Clinical fracture risk evaluated by hierarchical agglomerative clustering. Osteoporos Int. 2017; 28:819–832. PMID: 27848006.
crossref
17. Segar MW, Vaduganathan M, Patel KV, McGuire DK, Butler J, Fonarow GC, et al. Machine learning to predict the risk of incident heart failure hospitalization among patients with diabetes: the WATCH-DM risk score. Diabetes Care. 2019; 42:2298–2306. PMID: 31519694.
crossref
18. Su Y, Kwok TC, Cummings SR, Yip BH, Cawthon PM. Can classification and regression tree analysis help identify clinically meaningful risk groups for hip fracture prediction in older American men (the MrOS cohort study)? JBMR Plus. 2019; 3:e10207. PMID: 31687643.
crossref
19. Basu S, Raghavan S, Wexler DJ, Berkowitz SA. Characteristics associated with decreased or increased mortality risk from glycemic therapy among patients with type 2 diabetes and high cardiovascular risk: machine learning analysis of the ACCORD trial. Diabetes Care. 2018; 41:604–612. PMID: 29279299.
crossref
20. Fan Y, Li Y, Li Y, Feng S, Bao X, Feng M, et al. Development and assessment of machine learning algorithms for predicting remission after transsphenoidal surgery among patients with acromegaly. Endocrine. 2020; 67:412–422. PMID: 31673954.
crossref
21. Zaborek NA, Cheng A, Imbus JR, Long KL, Pitt SC, Sippel RS, et al. The optimal dosing scheme for levothyroxine after thyroidectomy: a comprehensive comparison and evaluation. Surgery. 2019; 165:92–98. PMID: 30413325.
crossref
22. Liu Y, Wang Y, Ni Y, Cheung CK, Lam KS, Wang Y, et al. Gut microbiome fermentation determines the efficacy of exercise for diabetes prevention. Cell Metab. 2020; 31:77–91. PMID: 31786155.
crossref
23. Williams SA, Kivimaki M, Langenberg C, Hingorani AD, Casas JP, Bouchard C, et al. Plasma protein patterns as comprehensive indicators of health. Nat Med. 2019; 25:1851–1857. PMID: 31792462.
crossref
24. De Silva K, Jonsson D, Demmer RT. A combined strategy of feature selection and machine learning to identify predictors of prediabetes. J Am Med Inform Assoc. 2020; 27:396–406. PMID: 31889178.
crossref
25. Somnay YR, Craven M, McCoy KL, Carty SE, Wang TS, Greenberg CC, et al. Improving diagnostic recognition of primary hyperparathyroidism with machine learning. Surgery. 2017; 161:1113–1121. PMID: 27989606.
crossref
26. Gulshan V, Peng L, Coram M, Stumpe MC, Wu D, Narayanaswamy A, et al. Development and validation of a deep learning algorithm for detection of diabetic retinopathy in retinal fundus photographs. JAMA. 2016; 316:2402–2410. PMID: 27898976.
crossref
27. Eastell R, Brandi ML, Costa AG, D'Amour P, Shoback DM, Thakker RV. Diagnosis of asymptomatic primary hyperparathyroidism: proceedings of the Fourth International Workshop. J Clin Endocrinol Metab. 2014; 99:3570–3579. PMID: 25162666.
crossref
28. Akkus Z, Cai J, Boonrod A, Zeinoddini A, Weston AD, Philbrick KA, et al. A survey of deep-learning applications in ultrasound: artificial intelligence-powered ultrasound for improving clinical workflow. J Am Coll Radiol. 2019; 16(9 Pt B):1318–1328. PMID: 31492410.
crossref
29. Katsiki N, Gastaldelli A, Mikhailidis DP. Predictive models with the use of omics and supervised machine learning to diagnose non-alcoholic fatty liver disease: a “non-invasive alternative” to liver biopsy? Metabolism. 2019; 101:154010. PMID: 31711877.
crossref
30. Kim HS, Kim DJ, Yoon KH. Medical big data is not yet available: why we need realism rather than exaggeration. Endocrinol Metab (Seoul). 2019; 34:349–354. PMID: 31884734.
crossref
31. Topol EJ. High-performance medicine: the convergence of human and artificial intelligence. Nat Med. 2019; 25:44–56. PMID: 30617339.
crossref

SUPPLEMENTARY MATERIAL

Supplemental Table S1

Commonly Used Machine Learning Performance Metrics for Binary or Multiclass Classifications [891011]
enm-35-71-s001.pdf
Fig. 1

The increasing trend in the number of artificial intelligence or machine learning-related publications per year in the endocrinology and metabolism field. The included publications were confined to PubMed-indexed records until the search date (January 17th, 2020), with combinations of search terms including machine learning, artificial intelligence, deep learning, endocrinology, metabolism, diabetes, pituitary, thyroid, adrenal gland, and osteoporosis, using PubMed query as follows: search ((((((“Machine Learning”[Mesh]) OR “Artificial Intelligence”[Mesh]) OR “Deep Learning”[Mesh])) OR (((machine learning[Title/Abstract]) OR artificial intelligence[Title/Abstract]) OR deep learning[Title/Abstract]))) AND ((((((((endocrinology[Title/Abstract]) OR diabetes[Title/Abstract]) OR pituitary[Title/Abstract]) OR thyroid[Title/Abstract]) OR adrenal gland[Title/Abstract]) OR osteoporosis[Title/Abstract])) OR ((((((“Endocrinology”[Mesh]) OR “Diabetes Mellitus”[Mesh]) OR “Pituitary Gland”[Mesh]) OR “Thyroid Gland”[Mesh]) OR “Adrenal Glands”[Mesh]) OR “Osteoporosis”[Mesh])).

enm-35-71-g001
Fig. 2

A brief workflow of machine learning-based medical research.

enm-35-71-g002
Fig. 3

Top 30 frequently appeared words in the titles of machine learning (ML)-based endocrinology studies between 2015 and 2019. Among a total of 2028 literatures searched by PubMed querya on Jan 17th, 2020, text analysis was performed with nouns and adjectives parsed from the titles of 611 studies (English language, human study without review or meta-analysis) published within last 5 years. Cumulative counts of appearance of top 30 words were plotted as horizontal bar plot. Frequently appeared diseases and ML tasks were plotted as pie charts separately. aPubMed query: (Search ((((((“Machine Learning”[Mesh]) OR “Artificial Intelligence”[Mesh]) OR “Deep Learning”[Mesh])) OR (((machine learning[Title/Abstract]) OR artificial intelligence[Title/Abstract]) OR deep learning[Title/Abstract]))) AND ((((((((endocrinology[Title/Abstract]) OR diabetes[Title/Abstract]) OR pituitary[Title/Abstract]) OR thyroid[Title/Abstract]) OR adrenal gland[Title/Abstract]) OR osteoporosis[Title/Abstract])) OR ((((((“Endocrinology”[Mesh]) OR “Diabetes Mellitus”[Mesh]) OR “Pituitary Gland”[Mesh]) OR “Thyroid Gland”[Mesh]) OR “Adrenal Glands”[Mesh]) OR “Osteoporosis”[Mesh])).

enm-35-71-g003
Table 1

Machine Learning Algorithms

enm-35-71-i001
Types of learning Supervised learning Semi-supervised learning Reinforcement learning Unsupervised learning
Concept Learning a function that best approximates new input to the desired output based on a given relationship between the input and labeled output from the labeled dataset A mixed approach of supervised and unsupervised learning applicable to a small amount of labeled data and a large amount of unlabeled data Learning by maximizing the reward function based on the responses yielded by various actions to achieve arbitrary goals in a given unstructured or unknown environment Finding structures or patterns in an unlabeled dataset
Common tasks Regression, classification Regression, classification Taking actions to maximize the reward Clustering, dimensionality reduction
Estimators Naive Bayesian, k-nearest neighbors, decision tree, support vector machine (SVM), neural network, logistic/ridge/linear regression, elastic net, etc. Generative model, semi-supervised SVM, etc. Q-learning, policy gradient, actor-critic, etc. K-means, density-based spatial clustering of applications with noise (DBSCAN), auto-encoders, deep Boltzmann machine, principal component analysis, locally linear embedding, etc.
Examples Prediction of gestational diabetes according to biochemical test results based on simple features extracted from an electronic health records database [4] The DeepHeart algorithm [7], which provides cardiovascular risk scores based on heart rate monitoring from popular wearable devices (Fitbit, Apple Watch, etc.) Determining the optimal insulin dose in patients with type 1 diabetes based on activity, hemoglobin A1c level, alcohol consumption status, and the previous insulin dose [5] Identifying novel clusters or biomarkers based on various features collected by an unbiased multimodal approach, which finds differences in risks for certain diseases compared to other groups [6]
Table 2

Summary of Recent Studies Related to Machine Learning Applications in the Endocrinology Field

enm-35-71-i002
Task Study (disease field) Study subjects Design and method Key finding and limitation
Screening and diagnosis Artzi et al. (2020) [4] (Diabetes and related disorders) - Retrospective nationwide electronic health record data of 588,622 pregnancies from 368,351 women between 2010 to 2017 in Israel including data of demographics, anthropometrics, laboratory tests, diagnoses, and pharmaceuticals - Aim: to establish an ML model to improve the prediction of gestational diabetes based on electronic health record vs. a conventional screening tool Key implications
- Internal validation set (n=137,220; with geo-temporal difference) - Reference labels: gestational diabetes diagnosis by a two-step approach (glucose challenge test and oral glucose tolerance test at 24–28 weeks of gestation) - ML was useful in developing a simple nine-question model in self-reportable format from the large electronic health record dataset, which outperformed the current standard screening tool (AUROC 0.80 vs. 0.68).
- Comparator: National Institute of health seven-item questionnaire - May facilitate early-stage interventions for women at high risk for gestational diabetes
- Methods: supervised learning; gradient boosting model - May aid construction of a selective, cost-effective screening approach according to predicted gestational diabetes risk instead of the current universal screening approach
Limitations
- Inherent bias from Retrospective electronic health record data review
- Performance might be different when based on actual self-reported surveys.
De Silva et al. (2020) [24] (Diabetes and related disorders) - National Health and Nutrition Examination Survey (NHANES) 2013–2014 (n=6,346) - Aim: to identify predictors of prediabetes to build a screening model Key implications
- Internal validation set (n=3,172) - Reference label: prediabetes defined using fasting plasma glucose, an oral glucose tolerance test, or hemoglobin A1c (HbA1c) according to American diabetes Association recommendations - ML-based models had modest performance in discriminating inidividuals with prediabetes, which were comparable to current screening instrument (AUROC 0.70 vs 0.64).
- External validation set: NHANES 2011–2012 (n=3,000) - Comparator: National prediabetes screening instrument - An application of feature selection Methods and machine learning algorithms to open dataset
- Methods: supervised learning; logistic regression, artificial neural network, random forests, gradient boosting - Novel predictors of prediabetes such as serum calcium, hysterectomy, hepatitis B were suggested by the feature selection algorithm; may provide new insights, but need to be cautious about unobserved confounding.
Limitations
- Generalizability to other countries cannot be guaranteed.
- A more parsimonious model would be useful as a screening tool.
Valentinitsch et al. (2019) [12] (Bone and mineral disorders) - Computed tomography data from consecutive patients between February 2007 and February 2008 (n=154) - Aim: to identify individuals with vertebral fractures using opportunistic CT screening Key implications
- Internal validation with four-fold cross-validation - Reference label: Presence of any vertebral fracture by Genant classification grade 1 or higher - ML model with global and local density and texture parameters showed better performance in identifying individuals with vertebral fractures compared to using volumetric BMD alone (AUROC 0.88 vs 0.64).
- Comparator: global volumetric BMD - Proposed a quantitative, automatic pipeline for opportunistic CT screening for individuals with vertebral fractures
- Methods: supervised learning; feature extraction (density and texture; Haralick features, histograms of the oriented gradient, local binary patterns, 3-dimensional wavelet), classification with random forests Limitations
- Consisted of oncologic patients; whether the pipeline is applicable to the general population needs to be validated.
- DXA data were not available; comparison with DXA and FRAX was not possible.
Somnay et al. (2017) [25] (Bone and mineral disorders) - Retrospective cohort of patients (n=6,777) with confirmed primary hyperparathyroidism who underwent parathyroidectomy vs. controls (n=5,033) who underwent thyroidectomy from March 2001 to August 2013 - Aim: to establish an ML model discriminating patients with primary hyperparathyroidism among patients who underwent neck surgery Key implication
- Internal validation with 10-fold cross-validation - Reference label: surgically confirmed primary hyperparathyroidism - ML model helped identifying individuals with primary hyperparathyroidism those who underwent neck surgery (accuracy 95.2%; 71.1% in mild case).
- Comparator: not applicable - Tested algorithm performance in the context of various relevant clinical situations
- Methods: supervised learning; naive Bayesian network with adaptive boosting Limitation
- Cases comprised only patients referred for parathyroidectomy; potential for selection bias cannot be excluded.
- Did not include cases of urinary calcium excretion or familial hypocalciuric hypercalcemia as controls.
Buda et al. (2019) [14] (Thyroid diseases) - Retrospective cohort of 1,377 thyroid nodules from 1,230 patients with complete imaging and conclusive cytologic or histologic diagnoses from August 2006 to May 2010 (training set: 1,278 nodules in 1,139 patients between 2006 and 2009) - Aim: to provide biopsy recommendations for thyroid nodules based on two orthogonal ultrasound images Key implication
- Internal validation set: 99 nodules in 91 consecutive patients (year 2009–2010) - Reference label: cytologically or histologically confirmed malignant or benign nodules on fine-needle aspiration (or surgical specimen where available) - The ML model yielded similar sensitivity (87% vs. 87%) and specificity (52% vs. 51%) to that of expert radiologists (AUROC 0.87 vs. 0.82).
- Comparator: decisions from three Thyroid Imaging Reporting and Data System committee experts; nine individual radiologists in clinical practice - Showed potential that ML model may be helpful to support clinical decision to go on invasive procedure for thyroid nodule.
- Methods: supervised learning; region-based convolutional neural network, multi-task convolutional neural network Limitation
- The final test set included a relatively small number of nodules, leading to wide confidence intervals.
- An external validation set for generalization was not available.
- Applicability of model during the testing in clinical practice need to be investigated.
Kong et al. (2018) [13] (Pituitary diseases) - Facial photo and clinical data from 527 acromegaly patients and 596 normal subjects from a hospital database in China - Aim: to detect acromegaly from facial photographs Key implication
- External validation set: 114 age- and sex-matched acromegaly patients and 128 controls - Reference label: biochemically proven acromegaly by growth hormone suppression testing with IGF-1 levels - The ML model showed better performance in discriminating acromegaly, from the earlier stage, based on only by facial photograph compared to pituitary disease specialists (F1-score 0.96 vs. 0.87).
- Comparator: nine board-certified endocrinologists or neurosurgeons specializing in pituitary disease only through a photograph - May have the potential to facilitate early detection of acromegaly based on facial recognition.
- Methods: supervised learning; an ensemble of outputs from logistic regression, k-nearest neighbor, support vector machine, random forest, and convolutional neural network Limitations
- Did not include side view images.
- Relatively small sample size as an image-based study compared to 128,175 retinal images in the previous work [26].
- Model based on a single ethnicity; cannot be extrapolated to another ethnicity.
Perakakis et al. (2019) [s15] (Diabetes and related disorders) - Serum samples of 49 healthy subjects and 31 patients with biopsy- proven NAFLD - Aim: to train models for the non-invasive diagnosis of NASH and liver fibrosis based on circulating lipids, glycans, fatty acids identified by LC-MS/MS and biochemical parameters Key implications
- Internal validation with three-fold cross-validation - Reference label: biopsy-proven NAFLD - The ML model including 20 features consisted of lipidomics, glycans, and adiponectin yielded high accuracy up to 90% in discriminating healthy individuals from patients with NAFLD and NASH.
- Comparator: not applicable - May provide a low-risk cost-effective, non-invasive alternative method to liver biopsy.
- Methods: supervised learning; one-vs-rest nonlinear support vector machine models with recursive feature elimination Limitations
-Validation cohort was not available.
- Needs to be further validated in a different population.
Kruse et al. (2017) [16] (Bone and mineral disorders) - Retrospective data from 10,775 subjects from the national Danish patient database with information on DXA scans, medication reimbursements, healthcare use, and comorbidities of female subjects - Aim: to detect patient clusters with a high risk of fracture using an unsupervised clustering algorithm based on DXA scans, medication, and health care claims dataset Key implications
- Reference label: not applicable - Unsupervised clustering identified four high risk clusters and two low-risk clusters among nine clusters, which had different patterns of medication usage, compliance, and clinical outcomes despite similar DXA results.
- Comparator: not applicable - May provide novel insights into establishing indications for DXA screening.
- Methods: unsupervised learning; Ward's-based hierarchical agglomerative clustering Limitations
- Potential temporal changes in pharmacological treatment pattern during the 15-year observation period
- Inherent limitations of the secondary use of a claims dataset; could not ascertain actual consumption of medication by individual subjects.
Risk prediction Segar et al. (2019) [17] (Diabetes and related disorders) - 8,756 Patients without heart failure at baseline from the ACCORD trial dataset (50% training set; 50% internal validation set; conducted between 1999 to 2009) - Aim: to develop an ML model to predict incident heart failure among patients with type 2 diabetes Key implications
- External validation set: 10,819 participants without prevalent heart failure from the ALLHAT trial - Reference label: incident hospitalization or death due to heart failure (captured and adjudicated by two independent reviewer physicians during the trial) - The ML-based models showed modest performance in prediction for incident heart failure among patients with type 2 diabetes in the external validation set (C-index 0.70 to 0.74).
- Comparator: not applicable - Each 1-unit increment in the WATCH-DM score was associated with a 24% higher relative risk of heart failure within 5 years.
- Methods: supervised learning; random survival forest-based model - Strength of analyzing a large number of participants from a well-phenotyped clinical trial population
Limitations
- Discrimination for heart failure with preserved ejection fraction was relatively low in the subgroup analysis.
- Temporal changes of heart failure biomarkers and medications could not be reflected in the model.
- Need to validate the model in lower-risk cohorts of individuals with type 2 diabetes.
Su et al. (2019) [18] (Bone and mineral disorders) - 5,977 Community-dwelling American men aged 65 or older (MrOS cohort) with 10-year follow-up data - Aim: to develop a risk classification model for hip fracture prediction in community-dwelling men Key implications
- Internal validation with 10-fold cross-validation - Reference label: incident hip fracture validated by a centralized physician using radiology reports or X-rays - Simple CART model with age and bone density showed similar performance in predicting incident hip fracture compared to the FRAX risk estimator as the current standard (AUROC 0.71 vs. AUROC 0.70).
- Comparator: FRAX hip fracture risk >3.0% - Simple classification by age and BMD may have a similar predictive performance to the FRAX hip fracture risk category.
- Methods: supervised learning; classification and regression tree (CART) analysis Limitations
- Potential of overfitting
- Limited statistical power for comparison of discrimination statistics due to low incidence of hip fracture.
Basu et al. (2018) [19] (Diabetes and related disorders) - 10,251 ACCORD trial participants aged 40 to 79 years with type 2 diabetes, HbA1c 7.5% or higher, or cardiovascular diseases or risk factors, those who randomized to target HbA1c <6.0% (intensive) vs. 7.0%–7.9% (standard group) - Aim: to identify subgroups with a heterogeneous treatment effect in response to intensive glycemic therapy Key implications
- Reference label: treatment effect defined as the absolute difference in the all-cause mortality rate between the intensive and standard therapy groups - Compared to 3.7% increased mortality by intensive vs. standard therapy in group 4, group 1 showed a 2.3% mortality reduction in the intensive therapy group (95% CI, –0.2% to 4.5%), which made the obvious contrast with the main result from the study.
- Comparator: not applicable - Identified characteristics of patients who may have benefited from intensive glycemic therapy (younger individuals with relatively low hemoglycosylation index)
- Methods: supervised learning; gradient forest analysis - Offered an example to find, clinically meaningful subgroups with heterogeneous treatment effects using data from randomized trials.
Limitations
- Post hoc analysis of a single trial that was conducted before the development of recent diabetes medications with cardiovascular benefits.
Fan et al. (2019) [20] (Pituitary diseases) - Retrospective cohort of 668 patients with acromegaly included age, gender, hypertension, blood glucose, laboratory values, maximal tumor diameter, bilateral Knosp grade based on magnetic resonance imaging findings, and surgical methods - Aim: to develop an ML model for preoperative prediction of transsphenoidal surgery response in patients with acromegaly Key implications
- Internal validation set (n=134) - Reference label: remission (at 3 months after surgery, either nadir growth hormone <4 ng/mL after oral glucose tolerance test or GH <1.0 ng/mL in a random sample with normal IGF-1 levels) - The ML model predicted remission after surgery better than standard Knosp grade (AUROC 0.82 vs. 0.71).
- Comparator: Knosp grade - Showed an exemplary case of applying various types of ML algorithms in endocrine diseases with relatively low frequency.
- Methods: supervised learning; random forest, logistic regression, logistic generalized additive models, gradient boosting decision tree, gradient boosting decision tree, adaptive boosting, extreme gradient boost model Limitations
- Single-center study
- Limited by short study follow-up duration (remission determined at 3 months)
- Omitted radiomics features
Zaborek et al. (2019) [21] (Thyroid diseases) - Retrospective cohort of 598 patients who underwent total or completion thyroidectomy with pathology showing benign thyroid disease - Aim: to develop an ML-based levothyroxine dosing scheme after total thyroidectomy to achieve euthyroidism Key implications
- Initiated levothyroxine at 1.6 μg/kg/day, with subsequent dose titration at 6- to 8-week intervals - Reference label: electronic health record-based euthyroid dosing - The predictive accuracy of the dose-suggestion algorithm was modest (64.8%), which was better than standard weight-based dosing (51.3%).
- Internal validation with 10-fold cross-validation - Comparator: standard weight-based dosing - Provided an ML algorithm to suggest dosing scheme of levothyroxine after total thyroidectomy, with better accuracy across body mass index levels
- Methods: supervised learning; support vector machine, Bayesian recurrent neural network, decision trees, random forests, ordinary least squares regression, Poisson regression, gamma regression, ridge regression, LASSO Limitations
- Limited to dataset from a single institution; need further validation in an external dataset
- Missing information regarding genetic factors and drug compliance; may hinder applicability to the real-world setting.
Oroojeni Mohammad Javad et al., (2019) [5] (Diabetes and related disorders) - Medical records of 87 patients with type 1 diabetes from Mass General Hospital; data for each patient's visits over a 10-year period (training set) between 2003 to 2013; HbA1c, body mass index, activity level, alcohol usage status, insulin (Lantus) dose - Aim: to explore an effective reinforcement learning framework for determining the optimal long-acting insulin dose for patients with type 1 diabetes Key implications
- External validation with 60 cases - Reference label: physician-prescribed insulin dose - The physician-prescribed insulin dose was within the dosing interval recommended by the Q-learning algorithm in 88% of test cases.
- Comparator: not applicable - A proof-of-concept study to provide clinical decision support for determining insulin dose in patients with type 1 diabetes, by applying reinforcement learning algorithm
- Methods: reinforcement learning; Q-learning with reward function set from HbA1c status at the visit and change of HbA1c from the past visit Limitations
- Limited by omitting lifestyle information regarding diet, stress, and medication adherence
- A relatively small training set
- Only one type of insulin (Lantus) was examined in the model.
Translational research Liu et al. (2020) [22] (Diabetes and related disorders) - 20 Drug-naive individuals with prediabetes (discovery cohort) - Aim: to find an ML model for predicting exercise responsiveness determined from exercise-induced alterations in the gut microbiota Key implications
- Determined exercise responders and non- responders after 12-week high-intensity exercise training - Reference label: responders defined as a decrease in the homeostatic model assessment of insulin resistance greater than two-fold technical error - The ML model identified 14 microbiome species and 15 metabolites from human feces were able to predict exercise responsiveness (AUROC 0.75 in the validation set).
- Collected pre- and post- exercise period feces to analyze gut microbiota profile - Comparator: not applicable - Provide an example of applying ML principles to human-to-mice translational study based on microbiome dataset
- Internal validation with 10-fold cross-validation - Methods: supervised learning; random forest model Limitations
- Relatively small sample size
- Limited to Chinese males only
- Need further validation in different population set
Williams et al. (2019) [23] (Miscellaneous) - Prospectively collected data from archived samples, clinical data, with approximately 85 million protein measurements in 16,894 participants from various cohorts including UK Whitehall II, Fenland, HUNT3, US Covance, HERITAGE Family studies - Aim: to develop plasma protein-phenotype models for 11 different health indicators (focusing on percentage body fat and incident cardiovascular events as outcomes) Key implications
- 70% Derivation set (with five repeats of 10-fold cross-validation), 15% refinement set, and 15% validation set for large (thousands) cohort - Reference label: percentage body fat measured by DXA; incident cardiovascular events ascertained in each cohort - The ML algorithm found proteins associated with body fat percentage (leptin, FABP, SFRP4) and CV events (gelsolin, antithrombin III, sTREM-1).
- 80% Derivation set (with 10-fold cross-validation); 20% validation set for smaller dataset (hundreds) - Comparator: not applicable - Reveals the potential of ML algorithm application to find novel proteomics-based biomarkers in large-scale, well-established cohorts.
- Methods: supervised learning; dimensionality reduction by false-recovery rate-corrected P values, proportional hazards elastic net models Limitations
- Caucasian bias in some cohorts; may not be generalizable to different populations.
- Need future investigation for examining the sensitivity of current research findings for longitudinal changes in health status or risks
Shomorony et al. (2020) [6] (Miscellaneous) - 1,385 Data features using a multimodal dataset collected from 1,253 individuals including data of whole- genome sequencing, microbiome sequencing, global metabolome, insulin resistance, whole body and brain magnetic resonance imaging, bone densitometry, computed tomography scans, routine clinical laboratory tests, family history of disease and medication, and anthropometric measurements - Aim: to identify multimodal biomarker signatures of health and disease risk using the unsupervised approach Key implications
- External validation set: 1,083 individuals from a separate cohort (TwinsUK registry) - Reference label: not applicable - 1-stearoyl-2-dihomo-linolenoyl-GPC and 1-(1-enyl-palmitoyl)-2-oleoyl-GPC were identified as novel biomarkers for diabetes, whereas cinnamoylglycine showed a novel association with lean mass percentage.
- Comparator: not applicable - Provided an example of applying unsupervised learning algorithms to find novel associations and biomarker signatures associated with health and disease statues in a large, multimodal dataset
- Methods: unsupervised learning; Louvain community detection, graphical LASSO for network analysis, Markov network analysis Limitations
- Underpowered to detect the effects of polygenic risk scores based on common variants for certain traits (explaining a relatively small fraction of the phenotypic variance)

ML, machine learning; AUROC, area under the receiver operating characteristic curve; CT, computed tomography; BMD, bone mineral density; DXA, dual-energy X-ray absorptiometry; IGF-1, insulin-like growth factor-1; NAFLD, nonalcoholic fatty liver disease; NASH, nonalcoholic steatohepatitis; LC-MS/MS, liquid chromatography-mass spectrometry; ACCORD, Action to Control Cardiovascular Risk in Diabetes; ALLHAT, Antihypertensive and Lipid-Lowering Treatment to Prevent Heart Attack Trial; WATCH-DM, Weight, Age, hyperTension, Creatinine, High-density lipoprotein cholesterol, Diabetes control, and Myocardial infarction; MrOS, The Osteoporotic Fractures in Men; FRAX, Fracture Risk Assessment Tool; CI, confidence interval; GH, growth hormone; LASSO, least absolute shrinkage and selection operator; HUNT3, the third Nord-Trøndelag Health Study; HERITAGE, HEalth, RIsk factors, exercise Training And GEnetics; FABP, fatty-acid-binding proteins; SFRP4, Secreted frizzled-related protein 4; CV, cardiovascular; sTREM-1, soluble triggering receptor expressed on myeloid cells-1; GPC, glycerophosphocholine.

TOOLS
Similar articles