

 PDF
PDF Citation
 Print
Print


INTRODUCTION
Ovarian cancer is the sixth most common cancer in women and leading cause of death in gynecologic malignancies [1]. Most women with advanced ovarian cancer experience recurrence within 5 years of diagnosis, despite previously achieving complete remission [2]. To evaluate treatment responses, various surveillance methods have been proposed [3]. In previous studies, serial monitoring of cancer antigen 125 (CA 125) levels showed a sensitivity of 79%–95% and positive predictive value close to 100% [456]. However, CA 125 has some disadvantages, such as non-specificity for cancer and the inability to conduct evaluation in real-time. Nearly 50% of the ovarian cancer patients with normal CA 125 levels following chemotherapy have persistent disease [7]. To overcome these limitations, liquid biopsy has recently attracted attention as a tool for less invasive, real-time monitoring [8]. In the field of liquid biopsy, circulating tumor cells are exceedingly rare in general solid tumors [9]. In contrast, circulating tumor DNA (ctDNA) in plasma contains tumor-specific mutations, microsatellite instability, loss of heterozygosity, and DNA methylation [101112]. The half-life of cell-free DNA (cfDNA) in the circulation is between 16 minutes and 2.5 hours and can provide ‘real-time’ information regarding cancer genomic alterations during treatment and follow-up [1314]. Previously published literature described the utility of ctDNA for rapid and accurate monitoring of treatment response in other solid tumors, such as colorectal, breast, skin, and lung cancers [1516171819]. However, unlike other cancers, ovarian, fallopian tube, and primary peritoneal carcinomas are typically diagnosed in advanced stages and metastatic tumors often exhibit heterogeneity. Therefore, it is necessary to study the efficacy of ctDNA surveillance methods for ovarian cancer. According to integrated genomic analyses of ovarian carcinoma in The Cancer Genome Atlas (TCGA) project, TP53 mutation (TP53mut) was found in 94.6% of high-grade serous ovarian cancer (HGSOC) patients and is a potential target mutation for surveillance [20].
In this study, we investigated the relationship between TP53mut in primary tumor tissue and ctDNA in the plasma of patients with HGSOC and assessed the clinical efficacy and utility of ctDNA compared to conventional CA 125 for treatment response monitoring during the initial treatment of ovarian cancer.
MATERIALS AND METHODS
1. Ethics and consent
This study included patients enrolled in the prospective study ‘p53 mutations in circulating cell-free tumor DNA of patients with ovarian cancer,’ which was approved by the Institutional Review Board (IRB) at the Asan Medical Center (IRB No. 2013-0572). All patients provided written informed consent for participation in the study and for use of their tissues and blood samples.
2. Study design and patients
1) Patient enrollment and sample collection
In total, 102 patients suspected of ovarian cancer were enrolled in this study from July 2013 to July 2017 at a single institution, Asan Medical Center in Korea. Other inclusion criteria were patients over the age of 18 years, patients who were scheduled for surgery for pelvic mass, and patients who agreed to venous blood collection before surgery. Exclusion criteria were patients who underwent surgical or open biopsy for any reason within the past 28 days, patients with clinically significant medical problems, patients without confirmed HGSOC, patients with metastatic ovarian cancer, patients who received more than 450 mL of blood transfusions within 28 days of the screening day, and patients who died before the 6th administration of chemotherapy.
After being enrolled in the study, 15 mL of whole blood was collected before surgery. DNA was immediately extracted from the plasma or stored at −20°C for several days. Tumor tissues were obtained in the sterile tube at the time of surgery and immediately frozen and stored at −80°C until DNA was extracted. In cases in which sufficient fresh-frozen tissues were not obtained, DNA was extracted with paraffin blocks (formalin-fixed paraffin embedded [FFPE]).
2) Treatment
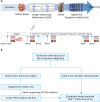
Within 3–6 weeks after surgery, a dose of 175 mg/m2 paclitaxel or 260 mg/m2 Genexol PM and a dose of 5 areas under curve of carboplatin were administered as an intravenous infusion in patients diagnosed with HGSOC. The treatment was repeated every 21 days and delayed in cases of unacceptable toxicities. Chemotherapy was administered for 6 consecutive cycles and then continued until achieving a complete response or disease progression if there was a remnant tumor. Serial blood samples (10 mL) were collected and monitored after the first, second, and sixth cycles of chemotherapy and three months after the end of chemotherapy (Fig. 1A).
3) Tumor tissue DNA extraction and genomic sequencing
DNA extraction from fresh frozen tissue or FFPE tissue: DNA of fresh frozen tissue obtained during surgery was extracted according to the user manual using a QIAamp® DNA Mini Kit (Qiagen, Hilden, Germany). From FFPE tissue, tumor DNA was extracted using a RecoverAll™ total nucleic acid isolation kit (Ambion, Carlsbad, CA, USA).
DNA quantification and genome sequencing: The concentration of extracted DNA was measured using a Nanodrop ™ 2000 spectrophotometer (Thermo Fisher, Waltham, MA, USA). Genomic sequence analysis was performed by Sanger sequencing. Primers corresponding to exons 2–11 of the TP53 gene were prepared and amplified by polymerase chain reaction (PCR). DNA sequencing was performed using an Applied Biosystems 3730 DNA Analyzer (Applied Biosystems, Foster City, CA, USA). Twelve target regions of TP53mut and the primers used in this study are summarized in Supplementary Tables 1 and 2.
4) Circulating cfDNA extraction
Separation of cfDNA from plasma: cfDNA was separated from 1 to 5 mL plasma using a circulating nucleic acid kit (Qiagen) according to the manual. The extracted cfDNA was completely dried in a vacuum concentrator (Eppendorf, Hamburg, Germany) and then dissolved again in a volume of 10 µL.
cfDNA concentration measurement: Extracted cfDNA was assayed using Qubit® dsDNA HS assay kit (Life Technologies, Carlsbad, CA, USA) to detect only double-stranded DNA. The values were measured using a Qubit® 3.0 fluorometer.
6) CA 125 assay
CA 125 levels were monitored at each cycle. The CA 125 test was performed with an Architect i2000 immunoassay analyzer (Abbott Laboratories, Abbott Park, IL, USA). The reagents were assayed using the ARCHITECT CA125 II assay (Abbott Laboratories).
7) Computed tomography (CT) imaging analysis
Tumor status was assessed by CT scanning after every three cycles of chemotherapy and assessed when signs of disease progression were observed. All CT images were interpreted by experts in radiology and total tumor volume was calculated. Treatment response was assessed according to the response evaluation criteria in solid tumors (RECIST criteria version 1.1) [23].
3. Statistical analysis
Analysis of mutation results in cfDNA was performed using QuantaSoft Software (Bio-Rad). The correlation between tumor volume and TP53MAC and CA 125 was confirmed by linear regression analysis. Changes in TP53MAC and CA 125 values according to the treatment duration were compared using a generalized linear mixed model. In addition, Kaplan-Meier analysis was used to confirm the correlation between time to progression (TTP) and changes in ctDNA and CA 125 at 3 months after chemotherapy. All statistical analyses were performed using SPSS software, version 21.0 (SPSS, Inc., Chicago, IL, USA).
RESULTS
1. Study patients and treatments
Fig. 1B shows the flow of patients in this study. In total, 102 patients with ovarian tumor and suspicious malignancy were assessed. Post-operative diagnosis of 102 suspected ovarian cancer patients are summarized in Supplementary Table 3. In total, 61 patients were eligible for the study based on the criteria and the total follow-up period was 1,489 months (range, 5.6–50.1 months). All patients underwent primary surgery and subsequently received chemotherapy.
2. TP53mut identification and concordance with plasma samples
Direct sequencing analysis of 103 tumor tissues from 61 HGSOC patients confirmed TP53muts in 41 patients (67.2%). The TP53muts identified in 41 patients with HGSOC are summarized in Supplementary Table 4. In total, 52 TP53muts were identified in 41 patients, and 7 patients had TP53muts at 2 different sites and 2 patients had TP53muts at 3 different sites. All these patient-specific somatic mutations were detected in the plasma cfDNA of 38 patients (concordance 100%), except for two patients who were unable to produce a probe and one whose manufactured probe did not function. Among the 41 patients with TP53mut, 13 patients were excluded from tumor response assessment for the following reasons: withdrawal of participation, follow-up loss or early death (n=7), coding silent (n=2), mutation in the site where the probe could not be made (n=2), manufactured probe did not function (n=1), and non-specific mutation (n=1). As a result, 28 patients were monitored for changes according to treatment course for TP53mut ctDNA and CA 125.
3. Baseline characteristics and TP53MAC value
Baseline characteristics of these patients are summarized in Table 1. Stage III and IV were the most common in the initial International Federation of Gynecology and Obstetrics (FIGO) stage, and the mean values of preoperative TP53MAC in stage III and IV patients were 12.2 and 45.3 copies/µL, respectively. Optimal debulking surgery was performed in 60.7% of the patients. The mean value of postoperative TP53MAC and reduction rate compared to preoperative values in patients with optimal debulking surgery and sub-optimal debulking surgery were 1.0 copies/µL and 92.9% and 9.3 copies/µL and 73.9%, respectively. Linear regression analysis was conducted to identify the correlation between tumor volume with preoperative TP53MAC and CA 125. However, both preoperative TP53MAC (adjusted R-square=−0.005) and CA 125 (adjusted R-square=0.0307) showed no correlation with tumor volume. Complete remission was obtained in 75% of the patients after initial chemotherapy, but recurrence occurred in 67.9% of the patients within the study period. The median TTP was 16.9 months and median progression-free survival was 22.7 months in all patients.
Table 1
Baseline characteristics of patients with TP53mut ctDNA and CA 125 monitoring (n=28)
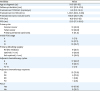
Values are presented as median (interquartile range) or number (%).
CA 125, cancer antigen 125; CR, complete response; ctDNA, circulating tumor DNA; FIGO, International Federation of Gynecology and Obstetrics; PD, progressive disease PFS, progression-free survival; PR, partial response; SD, stable disease; TP53MAC, TP53 mutant allele count; TP53mut, TP53 mutation; TTP, time to progression.
4. ctDNA for treatment response monitoring
Supplementary Fig. 1 is an example of ctDNA and CA 125 monitoring in the P-0005 patient. The TP53-R175H mutation was detected by direct sequencing of ovarian tissue specimens. The same mutation was also detected in plasma sample taken before surgery in the patient. Changes in TP53mut ctDNA and CA 125 levels according to treatment course are shown in this graph, and TP53MAC shows that the value was decreased to 0, unlike that of CA 125.
Supplementary Fig. 2 shows the changes in TP53MAC levels according to treatment progress in each patient. The white part indicates that samples were not collected at an appropriate time or the sample could not be measured correctly because of insufficient sample volume or errors in the experimental procedure. Overall, TP53MAC was significantly reduced by treatment course, indicating that TP53MAC is useful for treatment response monitoring in ovarian cancer. In addition, TP53MAC, which showed a decreasing tendency, was increased in some patients after 3 months from the end of treatment compared to those immediately after chemotherapy. This increase may be related to the resumption of proliferation of remnant cancer cell after the end of chemotherapy.
5. Comparison of ctDNA and CA 125 in treatment response monitoring and its association with TTP
Table 2 shows the percentage changes in the TP53MAC mean value at each treatment course relative to the pre-operative value using the generalized linear mixed model. As the treatment course progressed, both markers significantly decreased based on the treatment response. The p-value was determined by comparing the 2 markers at each time point and there was no significant difference in the rate of decrease between the 2 markers, except after the first chemotherapy.
Table 2
Percentage changes in TP53MAC mean value at each treatment courses relative to pre-operative value

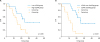
Fig. 2 shows the correlation between TTP and values of ctDNA after 3 months of chemotherapy using Kaplan-Meier analysis. As shown in Supplementary Fig. 1 above, some patients showed increases in TP53MAC at 3 months after the end of treatment compared to those immediately after chemotherapy. Therefore, we performed the analysis by dividing the patients into a low TP53MAC group (<0.2 copies/µL, n=13) and high TP53MAC group (≥0.2 copies/µL, n=14) based on the TP53MAC value at 3 months after the end of chemotherapy, except for one patient whose value was not measured. The analysis showed that there was a significant difference in TTP between the 2 groups (p=0.038). In Univariable analysis, there was no statistically significant correlation between pretreatment clinicopathologic variables and low TP53MAC group and high TP53MAC group (Supplementary Table 5). Among the 27 patients, 12 had more than 2-fold higher TP53MAC levels at 3 months after chemotherapy compared to those immediately after chemotherapy. We performed the analysis by dividing the patients into a TP53MAC doubling group and non-doubling group and there was a significant difference in TTP between the two groups (p=0.001). The probability of recurrence within 12 months after the end of chemotherapy was 6.7% in the TP53MAC non-doubling group and 58.3% in the TP53MAC doubling group. CA 125 levels were also analyzed in the same manner. However, unlike TP53MAC, only 8 patients had CA 125 levels that were more than 2-fold higher at 3 months after chemotherapy compared to those immediately after chemotherapy and there was no significant difference in TTP between the two groups (p=0.674).
Fig. 2
Kaplan-Meier plots for change in ctDNA after 3 months of chemotherapy. (A) Kaplan-Meier curve showing TTP for patients with ctDNA levels <0.2 or ≥0.2 copies/µL at 3 months after the end of chemotherapy. (B) Kaplan-Meier curve showing TTP for patients whose ctDNA levels at 3 months after chemotherapy had not doubled or had doubled compared to those immediately after chemotherapy.
CA 125 = cancer antigen 125; ctDNA, circulating tumor DNA; TTP, time to progression.
DISCUSSION
In this study, direct sequencing analysis of tumor tissues revealed TP53muts in 67.2% of the patients. This is a low value compared to the TP53mut detection rate previously reported in the TCGA data. The actual tumor weight in the tumor specimens used in the analysis of this experiment was unknown. To obtain accurate test results, at least 1 cm of the cancer portion is required for the tumor specimen. The actual tumor volume used in the test may be low, which may have resulted in a low detection rate. Differences in ethnicity may have affected the TP53mut rate. In addition, the TP53mut detection rate varied depending on the number of tumor specimens examined. In the test results, an average of 1.3 TP53mut was detected in a 1 site test, 1.7 TP53mut in a 2-site test, and 2.1 TP53mut in a 3-site test. Therefore, it is recommended that all sites removed by surgery be examined to increase the TP53mut detection rate and reflect heterogeneity between the different sites.
All patient-specific tissue mutations were detected in the plasma cfDNA of patients, showing 100% concordance. This suggests that TP53mut ctDNA monitoring is a useful monitoring technique for the treatment of almost patients with TP53mut in tumors.
We performed linear regression analysis to confirm the correlation between tumor volume and preoperative TP53MAC, but found no significant correlation. Previous studies reported a correlation between the concentration of ctDNA in the plasma and tumor size [2425]. ctDNA is thought to be released from cancer cells by apoptosis, necrosis, and active release [2627]. Ovarian cancer has a variety of phenotypes, including main pelvic mass or predominantly lymph node metastasis or peritoneal carcinomatosis, and this difference in the disease pattern and location of the tumor affect the degree of ctDNA release into the blood. And peritoneal seeding less than 1 cm is frequently observed in ovarian cancer patients that cannot be measured sufficiently by CT imaging. These factors may explain why there was no statistically significant correlation between the tumor volume and preoperative level of ctDNA.
In Supplementary Fig. 2, TP53MAC was significantly reduced by treatment, indicating that TP53mut ctDNA is useful for treatment response monitoring. Additionally, compared to CA 125 at each time point during treatment, there was no significant difference in the rate of decrease between the 2 markers.
There was no correlation between preoperative TP53MAC and TTP. It is likely because of differences in resectability (degree of debulking surgery). The mean value of postoperative TP53MAC in patients with optimal debulking surgery was much lower than in patients with sub-optimal debulking surgery. This result emphasizes the importance of a surgeon's efforts to achieve optimal debulking.
We found a significant correlation with TTP when divided into two groups according to the TP53MAC value at 3 months after the end of chemotherapy. In addition, some patients showed more than 2-fold increased TP53MAC levels at 3 months after the end of chemotherapy compared to the levels immediately after chemotherapy, and these patients showed poor prognosis. This means that the TP53MAC value at 3 months after the end of chemotherapy reflects the residual tumor burden and regrowth after the end of treatment. Unlike TP53MAC, CA 125 monitoring did not show this trend and this advantage of TP53mut ctDNA monitoring will help to predict the prognosis and detect relapse earlier after treatment.
Some previous studies have reported the detection of tumor-specific TP53 somatic mutations in ctDNA of patients with epithelial ovarian cancer. Otsuka et al. [28] first studied TP53muts in ovarian cancer and showed TP53mut in cancer tissue in only 44% of the patients and only two cases were detected in ctDNA in preoperative plasma. Swisher et al. [29] found TP53muts in tumors of 50% of the epithelial ovarian cancer patients and identified the corresponding ctDNA in blood and peritoneal fluid in 30% of the patients. In that study, the presence of ctDNA was an independent predictor of survival (p=0.02). Pereira et al. [30] studied gynecologic cancer patients, including 22 ovarian cancer and 4 tubal cancer patients. The detection rate of TP53mut was 66% in all patients with gynecologic cancers. ctDNA was detected in 93.8% of the patients for whom probes were designed and showed that undetectable levels of ctDNA at 6 months after treatment were associated with better prognosis. This result is consistent with our findings that ctDNA levels at 3 months after the end of treatment were associated with TTP. In a recent study of relapsed ovarian cancer, pretreatment ctDNA levels and the extent of ctDNA decrease after chemotherapy were significantly associated with TTP [31]. In the case of recurrent cancer, the proportion of chemo-sensitive cells was greatly different depending on the case. Most initially diagnosed cancer has a large portion of chemo-sensitive cells in the tumor and the degree of debulking has a significant impact on the extent of ctDNA decrease. In addition, the recurrent case showed a similar disseminated pattern, but the various dissemination types can affect the degree of ctDNA release in the initially diagnosed case. Therefore, the change in ctDNA at the initial stage of treatment is highly dependent on the patient in the initially diagnosed case. Therefore, a better approach for initial diagnosis of ovarian cancer is to pay attention to changes in ctDNA levels at the end-point of treatment and after several months, which fully reflect the effects of surgery and chemotherapy.
This is the first study on the efficacy of ctDNA monitoring as a treatment response monitoring tool for initial treatment after initial diagnosis of ovarian cancer, but not in recurrent cases. We demonstrated the efficacy of personalized ctDNA monitoring as a tumor-specific biomarker in the initial treatment of ovarian cancer. In addition, we found that ctDNA monitoring is more useful for prognosis prediction compared to the conventional marker CA 125.
This study had some limitations. Only one patient enrolled in this study died within the study period and the relationship with overall survival was not known. Another limitation is that some data was missing in the ctDNA analysis. Even in specimens obtained from the same site, various TP53muts may be present. Specimen selection bias may lead to inconsistent serial ctDNA changes and disease progression by detecting less important mutation points than pathogenic TP53mut points. Genetic testing should be performed on all removed site tumors to identify stem mutations, which are shared by all tumor regions and have a higher allele fraction in the plasma than do individual mutations. This effort may reduce the effects of intratumoral heterogeneity and clonal diversity [32333435].
In conclusion, we found that TP53mut ctDNA is useful as a tumor-specific biomarker for treatment response monitoring in HGSOC by significantly reducing the treatment course. Cancer is driven by genomic alterations. Therefore, genomic monitoring is necessary for evaluating early treatment response, monitoring minimal residual disease, and identifying genetic determinants for targeted therapy and evolution of resistance in real-time. Liquid biopsy is a minimally invasive procedure that is useful for serial sample measurements during treatment courses. TP53mut ctDNA is clinically effective and outperforms CA 125 in HGSOC monitoring, as it reflects minimal residual disease and the real-time treatment response. To increase the use of and commercialize ctDNA monitoring, it is necessary to further explore the biology of ctDNA, reduce costs by developing related technologies, establish a standard methodology, conduct quality control of the assays, and validate the method. Further studies are required to confirm the relationship between the change in ctDNA levels and OS through long-term follow-up.
 XML Download