

 PDF
PDF ePub
ePub Citation
 Print
Print


INTRODUCTION
Lysophosphatidic acid (1-acyl-2-hydroxy-sn-glycero-3-phosphate, LPA), is the simplest glycerophospholipid, which mediates a wide range of biological actions. It consists of various species with both saturated and unsaturated fatty acid tails. It is a normal constituent of serum that is released by activated platelets during platelet aggregation.1,2 LPA is present in mammalian serum in an active form (bound to albumin) at concentrations of 1-5 µM, but is not detectable in platelet-poor plasma or whole blood, suggesting that LPA is produced during blood clotting.2,3
In early investigations, LPA, a multifunctional phospholipid mediator, was identified as a smooth muscle contracting substance in vitro by Vogt et al.4 Afterwards, Xu et al.5 described the purification, characterization, and identification of an ovarian cancer activating factor in ascites from ovarian cancer patients. This factor was composed of various species of LPA.
LPA is suggested to display a broad spectrum of biological activities. Its principal effects are growth-related, such as induction of cellular proliferation and suppression of apoptosis. It decreases the sensitivity to chemotherapeutic drugs and increases the invasiveness of ovarian cancer cells.6-9 LPA exerts these effects via kinases and tyrosin phosphorylation. LPA also increases the levels of growth factors such as vascular endothelial growth factor (VEGF) and interleukin (IL)-8; as such, it increases the neovascularization and worsens the prognosis in ovarian malignancies.10
These all suggest that LPA may be particularly important for initiation and progression of ovarian cancer.
The aim of this study is to measure total plasma LPA levels in epithelial ovarian carcinoma (EOC) patients and to demonstrate if LPA is as beneficial as CA-125 as a tumor marker in the diagnosis and follow-up of the disease.
MATERIALS AND METHODS
Eighty-seven EOC patients and 74 benign ovarian tumor patients (operated on in Istanbul University, Cerrahpasa Medical Faculty, Gynecology and Obstetrics Department, Gynecologic Oncology Division), and 50 healthy women were enrolled in this study. Patients with the diagnosis of germ cell tumors and sex cord stromal tumors were not included into the study group. Of 87 EOC patients, 10 patients had stage 1, 63 patients had stage 3, and 14 patients had stage 4 disease.
Initial serum CA-125 and total plasma LPA levels were measured in all patients with an ovarian mass and a planned operation. After the pathologic examination, 87 patients were diagnosed as EOC. Out of 87 EOC patients who needed chemotherapy, 29 patients could be followed up in our clinic during chemotherapy administration.
Serum CA-125 and total plasma LPA levels were measured before each chemotherapy cycle in 29 of 87 patients. LPA analysis was performed by using the biochemical method of Xu et al.3 Since LPA is mainly produced as a result of platelet activation, we first aimed to eliminate the LPA production from the platelets and then to measure LPA level which is thought to be produced only from the ovarian cancer cells. In order to prevent platelet activation and phospholipase activity, 5 mL venous blood was taken preoperatively from all patients, and these samples were collected into EDTA containing tubes. Whole blood was centrifuged at 580 rpm for 5 minutes; afterwards, in order to remove remaining platelets, supernatant was centrifuged at 8,000 rpm for another 5 minutes. The plasma samples were then stored at -80℃ deep freeze (NuAire Inc., 51006537, Plymouth, USA). Analyses of total plasma LPA levels were performed in Istanbul University, Laboratory of Institute of Forensic Sciences.
For analyzing CA-125 levels, another 5 mL venous blood from each patient was taken into another tube preoperatively. Analysis of serum CA-125 was performed in Cerrahpasa Medical Faculty, Fikret Biyal Laboratory with a CA-125 II kit that utilised the RIA technique (Centocor Ortho Biotech Inc., Horsham, PA, USA). Cut-off value for CA-125 was accepted as 35 U/mL.
Patients received 6 doses of chemotherapy with 175 mg/m2/3 hours paclitaxel + carboplatin area under the curve (AUC) 6. All the patients in the study group had their serum CA-125 and total plasma LPA levels measured before each chemotherapy administration.
Analysis of total plasma LPA
For total plasma LPA analysis, first the lipids were extracted, then LPA was separated from other lipids by thin layer chromatography; and finally, after hydrolysis and derivatization, the analysis was performed by gas chromatography and mass spectrophotometry (GC-MS).
First of all, 750 µL plasma, 1.5 mL chloroform-methanol mixture (1:2, v/v) and 0.4 mL acetic acid buffer solution were added into a glass tube and vortexed. Then, 0.5 mL chloroform and 0.5 mL distilled water were added and vortexed again. The mixture was centrifuged at 4,000 rpm for 3 minutes. The lower layer (organic) was transferred into a micro-centrifuge tube and evaporated. Then 50 µL methanol-chloroform (2:1, v/v) was added onto the residue and loaded onto the thin layer, mobile phase as follows:
Chloroform/methanol/%20 ammonium hydroxide (60:35:8).
The standard LPA and other phospholipids were detected by spraying % 0.1 (ANSA) 8-anilino-1-naphthalene sulphonic acid in H2O onto the layer and observing the spots with UV light at 366 nm wavelength. The LPA spots were then scraped from the silica layer and transferred into clean glass tubes with 100 µL 0.000059 M behenic acid/hexane.
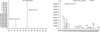
Two hundred µL 0.5 M hydrochloric acid (HCl) was added and the mixture was incubated in the oven for 45 minutes at 110℃. Then 200 µL 1 M ethanolic potasium hydroxide was added, and again the mixture was incubated in the oven for 45 minutes at 110℃. After it returned to room temperature, 50 µL 10 M HCl was added and vortexed. The mixture was extracted with 750 µL pentane. Following centrifugation at 6,000 rpm for 3 minutes, organic phase (upper) was transferred into a micro-centrifuge tube. The solution was again extracted using 250 µL pentane and upper layer was added to the previous one. After evaporation, 200 µL boron trichloride-methanol was added and it was derivatized in the oven at 80℃ for 45 minutes. At room temperature 40 µL chloroform was added and incubated for 10 minutes. One µL of this solution was injected into GC- MS (Fig. 1).
Equipment
One point five mL micro-centrifuge tubes; glass tubes; vortex; Nüve FN 400 oven; Heraeus Megafuge 10 R centrifuge; Scaltec SBA 31 analytical balance; 25, 100, 250 mL volumetric flasks; HP GC-MS (HP 6890 GC /HP 5973 MSD); Merck/DC-Alufolien 20×20 cm; Kieselgel 60 F254.
Chemicals
Merck (Merck & Co. Inc., Whitehouse Station, NJ, USA)/Methanol (CH3OH), extra pure; Merck/Chloroform (CHCl3) extra pure; J.T. Baker (Phillipsburg, NJ, USA)/n-pentane (CH3 (CH2)3CH3), min 95%; Sigma (Sigma-Aldrich, St. Louis, USA)/Boron trichloride-methanol 10%; Riedel de Haen (Seelze, Germany)/acetic acid, 100%, glacial (CH3COOH); Delta kimya San. (Istanbul, Turkey)/absolute ethyl alcohol 99%, 5(C2H3 OH); Sigma (Sigma-Aldrich, St.Louis, USA)/Behenic acid (C22 H44O2); Sigma (Sigma-Aldrich, St.Louis, MO, USA)/L-α-LPA, oleoyl (C18:1, cis-9), (oleoyl-sn-glycero-3- phosphate) sodium salt min 98%; Prolabo (Leicestershire, UK)/Potassium hydroxide KOH, pellets min 84%; Merck/HCl 37% extra pure.
Statistical analyses
All data obtained from patients were evaluated by using SPSS ver. 11.0 (SPSS Inc., Chicago, IL, USA). In comparison of groups, one way variance analysis (ANOVA), Spearman's correlation analysis, Mann Whitney U-tests, and the Kruskal Wallis test were used. Two-sided p-value of <0.05 was considered to be statistically significant.
RESULTS
Mean age was 58.1±11.9, 45.9±14.7 and 48.2±5.1 in ovarian cancer patients, benign ovarian tumor patients and healthy women group, respectively (ANOVA, p<0.001). Three hundred eighty LPA measurements were performed in 211 cases. LPA could not be detected in plasma in 26 of 380 (6.8%) measurements. Total plasma LPA levels which were below the level of detection were assumed to be 0.1 µmol/L for statistical analysis. The mean preoperative total plasma LPA was 4.29±4.52 µmol/L for EOC patients (n=87) and 1.57±0.92 µmol/L for benign ovarian tumor patients (n=74) (Mann Whitney U, p<0.001). The mean preoperative total plasma LPA was 0.6±0.42 µmol/L in healthy women. Mean total plasma LPA were found to be higher in patients with both EOC and benign ovarian tumors compared to the healthy women (Mann Whitney U, p<0.001 and p<0.001, respectively). Mean total plasma LPA and serum CA-125 levels are given in Table 1.
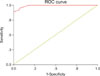
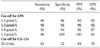
In order to find a cut-off value, plasma LPA levels were analysed by receiver operating characteristic (ROC) curve (Fig. 2). Cut-off values and sensitivity and specificity levels are listed in Table 2. The best cut-off value according to our study population was selected as 1.3 µmol/L.
When we take the cut-off value as 1.3 µmol/L, 83 of 87 (95%) EOC patients had their plasma LPA levels equal to or above that value; whereas 46 of 50 (92%) healthy women had LPA levels below 1.3 µmol/L. Therefore, for the cut-off value of 1.3 µmol/L sensitivity, specificity, positive predictive value and negative predictive value were 95%, 92%, 95% and 92%, respectively.
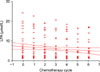
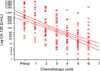
Twenty-nine patients with EOC were followed during chemotherapy administration. A correlation analysis was performed in order to observe how total plasma LPA levels changed in time with the administration of chemotherapy. Total plasma LPA levels decreased slightly with each chemotherapy cycle and there was a weak negative correlation (Spearman, rs=-0.151, p=0.034) (Fig. 3).
Mean preoperative total plasma LPA level of the 29 patients who received chemotherapy was 7.21±6.63 µmol/L. Mean total plasma LPA levels were 6.84±6.34 µmol/L before the first chemotherapy (n=29), 6.34±5.92 µmol/L before the second chemotherapy (n=29), 6.14±5.79 µmol/L before the third chemotherapy (n=29), 5.86±5.68 µmol/L before the fourth chemotherapy (n=28), 5.23±5.11 µmol/L before the fifth chemotherapy (n=27), and 5.21±5.32 µmol/L before the sixth chemotherapy (n=27).
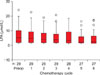
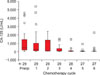
As the group variance with the Levene test was not significantly different (p=0.808), ANOVA was performed in order to compare means of total plasma LPA before each chemotherapy administration. Means of total plasma LPA were not significantly different from each other (p=0.832) (Fig. 4).
A correlation analysis was performed in order to observe how serum CA-125 levels changed with each chemotherapy cycle. Serum CA-125 levels showed a significant negative correlation with chemotherapy administration (Spearman, rs =-0.596, p<0.001) (Fig. 5).
Before the operation, mean serum CA-125 of 29 patients was 1,134.9±1,462.8 U/mL. Mean serum CA-125 was 958.2±1,428.6 U/mL before the first chemotherapy (n=29), 631.4±860.1 U/mL before the second chemotherapy (n=29), 253.6±392 U/mL before the third chemotherapy (n=29), 108.7±281.9 U/mL before the fourth chemotherapy (n=28), 64.6±177.5 U/mL before the fifth chemotherapy (n=27), and 127±437.5 U/mL before the sixth chemotherapy (n=27) (Fig. 6).
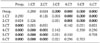
In order to evaluate whether there was a difference among the means of serum CA-125 measured before each chemotherapy administration, the homogenity of groups was assessed by the Levene test which revealed that variance was statistically different (p<0.001). Therefore, the non-parametric Kruskal-Wallis test was used for comparison. Medians of serum CA-125 were significantly different (p<0.001). In order to investigate which group causes statistical differences among medians of CA-125, the Mann Whitney U-test was used. P value was accepted as 0.05/21=0.0024. Results of this analysis are presented in Table 3.
DISCUSSION
One of the most convenient methods in the follow-up of the patients with ovarian cancer and evaluation of response to the treatment is to monitor the levels of the tumor markers.11,12 Bast et al.13 reported a new monoclonal antibody, OC125, which is an IgG1 immunoglobulin and reacts with an antigenic determinant named CA-125 in 1981. Serum CA-125 levels were elevated in 82% of advanced stage EOC patients.14 Serum CA-125 is the most commonly used marker for diagnosis of EOC as well as monitoring and evaluating the response to treatment.15 The CA-125 assay has been assumed to correlate with the primary cytoreductive surgery outcomes, clinical response, and progression during chemotherapy. In our study, both preoperative CA-125 and total plasma LPA levels were significantly higher in EOC patients compared to healthy women and patients with benign ovarian tumors; moreover elevated preoperative mean serum CA-125 decreased significantly after the third chemotherapy administration. Lavin et al.16 reported that persistence of elevated serum CA-125 levels despite the 3rd chemotherapy administration, would show the poor responders. Dalen et al.17 also reported that patients who have high preoperative CA-125 levels and whose CA-125 levels did not return to normal levels after the 3rd cycle of chemotherapy, would have poor prognosis.
The first clinical study in the literature about total plasma LPA and gynecologic malignancies was published by Xu et al.,3 in 1998. Their study group consisted of 84 patients with various gynecologic malignancies (ovarian, endometrial, cervical, primary peritoneal surfaces cancer). This group was compared with another group composed of healthy women (n=48), benign gynecologic diseases (myoma uteri, adnexal mass and endometriosis, n=17), and non-gynecologic malignancies (lymphoma, breast cancer, n=16). As a result of their study, for detection of malignancy they determined the cut-off value of total plasma LPA as 1.3 µmol/L. Sensitivity and specificity for detecting gynecologic cancers were 95% and 89%, respectively. In their study, 47 of 48 (98%) patients with ovarian cancer and 80 of 84 (95%) women with any gynecologic malignancy had elevated levels of LPA; whereas no patients with breast cancer or leukemia showed elevated plasma LPA levels. In our study, we also determined the most appropriate cut-off value of LPA as 1.3 µmol/L. However, Xu et al.3 included all gynecologic malignancies; in contrast, we included only EOC patients.
Our study is the first clinical study in the literature that evaluates the change of total plasma LPA and serum CA-125 levels with each chemotherapy cycle. Total plasma LPA levels decreased slightly with chemotherapy administration, but this decline was not statistically significant. Contrarily, serum CA-125 levels significantly decreased in response to chemotherapy administration. Therefore we suggest that, as a follow-up parameter, total plasma LPA is not as beneficial as CA-125. We had published a similar study before in which we compared serum CA-125 and IGF-1 levels and their changes with each chemotherapy cycle. As is the case in LPA, measurement of serum IGF-1 levels had not brought any additional benefit compared to CA-125 in the follow-up of EOC patients.18
Some studies reported that plasma LPA levels were increased in malignant effusions in patients with cancer, particularly in ovarian cancer patients.19,20 Baker et al.21 found that LPA levels in malignant effusions including ovarian cancer were significantly increased compared to controls. However, the plasma concentrations of neither individual LPA species (LPA 16:0, 18:2, 18:1, 18:0, 20:4) nor total LPA levels differed between ovarian cancer patients and controls. Pozlep et al.22 also stated that LPA analysis did not differentiate benign from malignant ovarian tumors.
In contrast to two latter studies, Sedláková et al.23 published a study in which plasma LPA levels were found to be elevated in patients with ovarian cancer and stated that it could be a useful marker in EOC, particularly in the early stages of the disease, although CA-125 levels were not evaluated in their study. These aforementioned clinical studies did not compare LPA with other tumor markers and did not evaluate the changes after chemotherapy and clinical responses.
We also determined that initial total plasma LPA levels were significantly higher in EOC patients compared to patients with benign ovarian tumors and healthy women. Therefore, total plasma LPA is a useful marker for diagnostic purposes. However, since total plasma LPA levels did not significantly change after the administration of chemotherapy, LPA does not seem to be a good indicator for monitorization of response to chemotherapy.
Yu et al.24 discussed the relevance of LPA to the pathogenesis of ovarian cancer in their study. They summarized the issue as: LPA promotes growth and survival of ovarian cancer cells;8,25-29 ovarian cancer cells can produce LPA, forming an autocrine loop mediating growth, survival, and motility of tumor cells; LPA action increases expression of angiogenic and metastatic factors such as IL-6, IL-8, VEGF, uPA, and Cox-2;10,30-34 exogenous LPA can increase growth and metastasis of ovarian cancer cells;8 ovarian cancer cells can induce LPA production by mesothelial cells, thereby increasing invasion and metastasis;34 expression of LPP3, an enzyme that dephosphorylates LPA, reduces growth and survival of ovarian cancer cells in nude mice;35 and inhibitors of autotaxin, the main enzyme producing LPA, decrease metastatic potential in some tumor models.36
Although the role of LPA in pathogenesis and metastasis of ovarian cancer is very well-known as mentioned above, still we have no data that LPA is superior to CA-125 in the follow-up of patients with ovarian cancer. Our study is the first clinical study in the literature that evaluates serum CA-125 and total plasma LPA levels concomitantly and evaluates the changes of LPA levels after each chemotherapy administration.
In the literature there is no clinical trial which investigates the association between initial total plasma LPA values and treatment outcomes and survival. Further studies are needed to evaluate this issue.
In conclusion, LPA is a better biomarker for diagnosis of EOC compared to CA-125. Total plasma LPA as well as CA-125 significantly increase in EOC patients compared to patients with benign ovarian masses and healthy subjects. On the other hand, in the follow-up of EOC patients, measurement of total plasma LPA levels during chemotherapy administration have no superiority to serum CA-125 levels.

 XML Download