

 PDF
PDF ePub
ePub Citation
 Print
Print


INTRODUCTION
Skeletal muscle is an important tissue that supports body posture and internal organs. Most skeletal muscles are attached to their adjacent bones, and they interact with each other by releasing myokines and osteokines.1 This interaction has been described by many clinical studies, reporting that people with less muscle mass have lower bone mineral density (BMD) and face a higher risk of fracture.2 In addition, muscle is the primary site of glucose uptake after meal intake, and sarcopenia is highly associated with insulin resistance.3 According to one study, inflammatory responses from muscles may underlie the development of insulin resistance: when the inflammatory response is inadequate as with aging muscle, acellular lipid droplets and adipocytes can accumulate.4 Accumulated adipocytes and lipid droplets, in turn, are presumed to affect the development of insulin resistance, type 2 diabetes, and metabolic syndrome by secreting various adipokines, chemokines, and cytokines.
Although it has been speculated that muscle is closely related to osteoporosis and metabolic abnormalities, there is lack of data on associations among muscle properties and bone mass or insulin resistance in the Asian population. Muscle mass and strength are widely used as indicators of muscle quantity and quality, respectively. Furthermore, it is a common belief that muscle mass and strength are correlated with each other.5 However, Hughes, et al.6 demonstrated that less than 5% of changes in muscle strength are attributable to changes in muscle size. Similarly, Barbat-Artigas, et al.7 reported that women with sarcopenia who were 75 years of age and older showed better muscle quality than women without sarcopenia, indicating a discordance between muscle quality and mass. Therefore, in addition to muscle quantity, muscle quality should be evaluated independently. Although muscle quality is usually measured by muscle strength, muscle composition (e.g., fiber type or lipid content) should also be taken into account, as different muscle compositions might explain why individuals with the same muscle mass do not necessarily have the same muscle strength.7
In this study, we aimed to investigate which muscle properties, among muscle mass, muscle strength, physical performance, or muscle composition, are associated with bone mass and insulin resistance in Korean postmenopausal women.
MATERIALS AND METHODS
Study subjects and anthropometry
A total of 192 postmenopausal women aged 60 years and older were enrolled. The participants visited Severance Hospital in Seoul, Korea for a routine health check up from April 2016 to September 2016. We excluded subjects who had been diagnosed with severe hepatic impairment [aspartate transaminase (AST) or alanine transaminase (ALT) levels higher than three times the upper limit of the normal range within the last 3 months] or malignancy and those who had been treated with a glucocorticoid or levothyroxine. Subjects who were treated with menopausal hormone therapy within 3 years were also excluded. Subjects whose glycosylated hemoglobin was ≥6.5% at baseline screening and who had been treated with oral hypoglycemic agents or insulin were defined to have diabetes mellitus. Medication history, including use of bisphosphonates, selective estrogen receptor modulators (SERM), oral hypoglycemic agents, and insulin, was collected from the electronic medical records system of Severance Hospital. The subjects completed a simple questionnaire concerning their age at menopause, osteoporotic fracture history, smoking history, and times of regular exercise per week. Height and body weight were measured using a calibrated digital scale after all outer clothing and shoes were removed, and body mass index (BMI) was calculated as weight in kilograms divided by height in meters squared (kg/m2). Moreover, waist circumference was measured as the minimum circumference between the inferior border of the rib cage and the superior aspect of the iliac crest using an inelastic measuring tape. Hip circumference was measured as the maximum circumference at the level of the buttocks. All anthropometric measurements were performed by the same evaluator. Using quantitative computed tomography (QCT), osteoporosis was defined as an L1–L4 average spine BMD value of <80 mg/cm3 or a T-score at the hip of <−2.5, based on the American College of Radiology guidelines.8 The Severance Hospital Institutional Review Board approved the study protocol (IRB No. 4-2016-0126), and informed consent was obtained from all subjects. In addition, all investigations were performed in accordance with the principles of the Declaration of Helsinki.
Biochemical measurements
Serum fasting glucose, fasting insulin, blood urea nitrogen, serum creatinine, AST, ALT, total cholesterol, and 25-hydroxyvitamin D were measured. Serum 25-hydroxyvitamin D levels were measured using a radioimmunoassay [RIA: INCSTAR Corp., Stillwater, MN, USA; intraassay coefficient of variation (CV) <4.1% and interassay CV <7.0%]. Homeostatic model assessment-insulin resistance (HOMA-IR), which is an index of insulin resistance, was calculated using the following equation, as described by Matthews, et al.9:
HOMA-IR=[glucose (mg/dL)×insulin (µU/mL)]/405.
QCT scanning
The subjects were scanned on a multidetector CT scanner (Light Speed QX-I scanner, GE Medical Systems, Waukesha, WI, USA) at 120 kVp and 120 mAs, with a 2.5-mm slice thickness, as previously described.101112 Volumetric BMD in mg/cm3 was calculated at the spine and hip, and all scanned data were analyzed using QCT PRO software (Mindways Software, Austin, TX, USA).
Measurement of muscle mass and composition
The cross-sectional area (CSA) of the gluteus maximus and quadriceps muscles was used as an index of muscle mass.1314 Axial images were obtained using QCT, and CSA was measured using freehand-drawn regions of interest (ROIs) (Supplementary Fig. 1, only online). Gluteus maximus and quadriceps muscle area was measured at the level of the symphysis pubis and at the level 7 cm from the lesser trochanter, respectively. At each level, the mean value of right and left area was calculated and used for analysis. As an index of muscle composition, we used the mean attenuation of coefficient, measured in Hounsfield units (HU).15 The mean HU was measured at the same ROIs where muscle CSA was measured. All images were analyzed by a single investigator.
Measurement of muscle strength and physical performance
To estimate muscle strength and physical performance, the hand grip test (HGT) and Short Physical Performance Battery (SPPB) were performed. Hand grip strength was evaluated using a digital dynamometer (Grip Strength Dynamometer T.K.K.5401; Takei Co., Tokyo, Japan). The subjects were asked to stand straight with their arms resting in a neutral position, and grip strength was measured three times with each hand.16 The maximum score was recorded and used for analysis. The SPPB score was based on three tests, as follows: balance test, gait speed test, and chair stand test. For the balance test, the subjects were asked to hold challenging standing positions for 10 s each: 1) side-by-side position, feet together side-by-side; 2) semi-tandem position, heel of one foot against the side of the big toe of the other foot; and 3) tandem position, feet aligned heel to toe. Moreover, the time to walk 4 m at the subject's usual pace was measured to evaluate gait speed. For the chair stand test, the subjects were asked to sit down and stand up from a chair five times without using their arms, and the total time was measured. Each test was scored between 0 and 4; a total score of 12 was the maximum score.17 These tests were conducted only for subjects who agreed to perform them. Among the 192 enrolled subjects, 173 completed HGT and 83 performed the SPPB test. Seventy-two subjects completed both tests.
Statistical analysis
Descriptive statistics were performed for the analysis of baseline characteristics. To evaluate the relationship between muscle properties and BMD or HOMA-IR, Pearson correlation analysis and linear regression test were performed. Analysis of covariance was used to evaluate significant differences in muscle properties between osteoporotic and non-osteoporotic groups or between diabetic and non-diabetic groups. Values are expressed as means±standard deviations. p-values <0.05 were considered statistically significant. All statistical analyses were performed with the Statistical Package for Social Sciences for Windows, version 23.0 (IBM Corp., Armonk, NY, USA) and GraphPad Prism 5 (GraphPad Software Inc., San Diego, CA, USA).
RESULTS
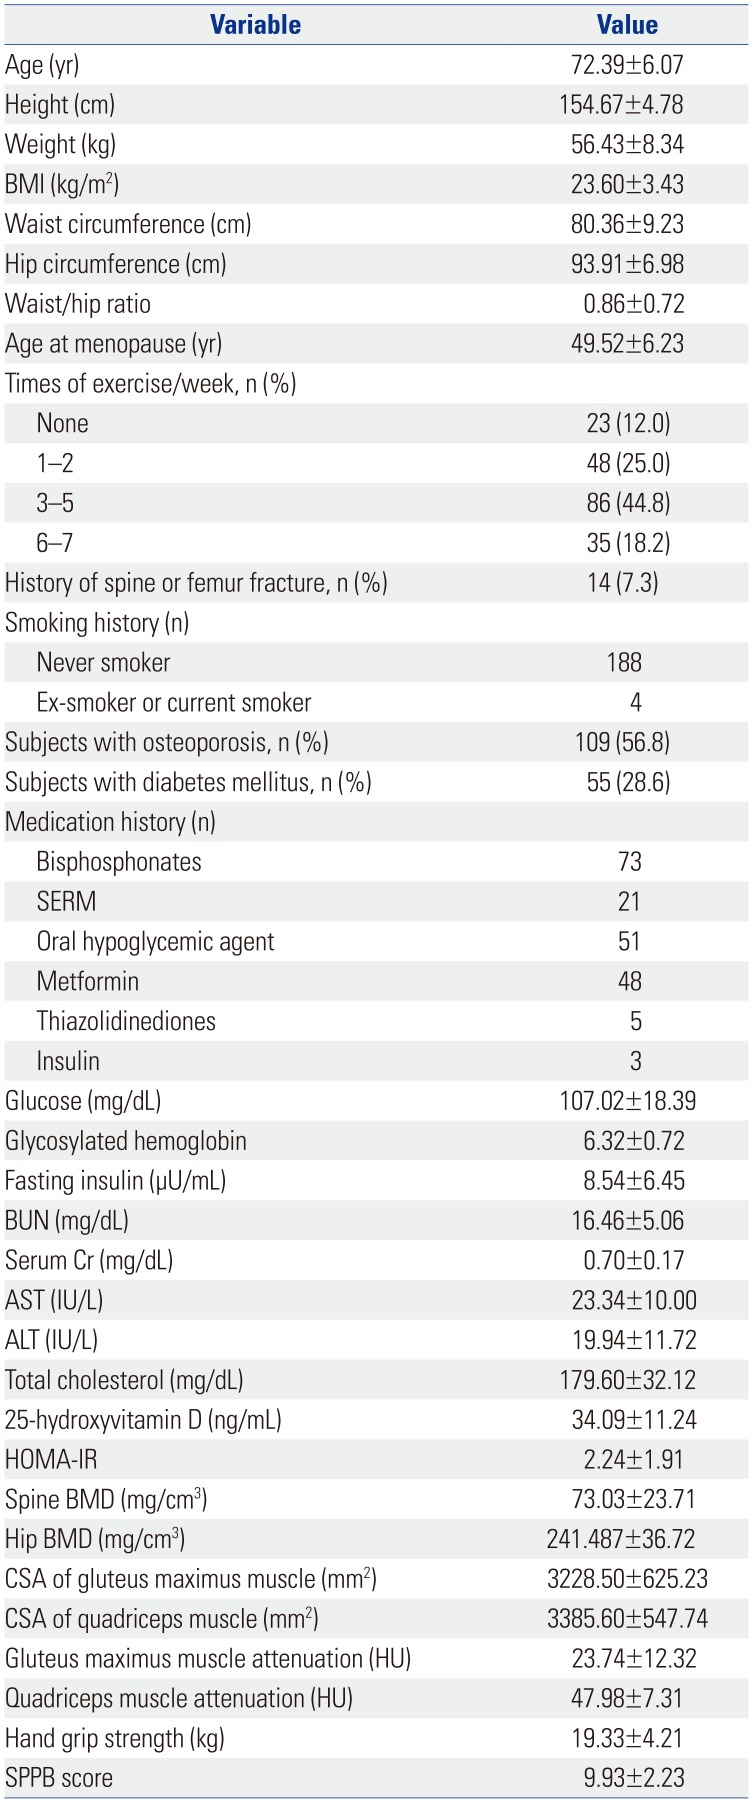
The baseline characteristics are shown in Table 1. The mean age of the subjects was 72.39±6.07 years, and their mean BMI was 23.6±3.43 kg/m2. According to the World Health Organization criteria,1819 57 subjects (29.7%) were obese (BMI >25 kg/m2) and 89 (46.4%) had abdominal obesity (waist-hip ratio >0.85). One hundred and nine subjects (56.8%) had osteoporosis, among whom 94 had been treated with bisphosphonates (n=73) or SERM (n=21). Fifty-five subjects (28.6%) were diagnosed with diabetes mellitus, and 51 subjects (26.6%) had been taking oral hypoglycemic agents and/or receiving insulin treatment. The numbers of subjects who were treated with metformin or thiazolidinediones, which can affect lipid accumulation in muscle or bone loss, were 48 and 5, respectively. There were no significant differences in clinical parameters, including age, BMI, glycosylated hemoglobin, BMD, CSA of muscle, and muscle HU value, between the subjects who opted to participate in performance tests (e.g., HGT, SPPB, or both) and those who opted not to participate.
Muscle measurements and their association with BMI
The mean CSA values of the gluteus maximus and quadriceps muscles were 3228.50±625.23 mm2 and 3385.60±547.74 mm2, respectively. The muscle attenuation (HU) of the gluteus maximus and quadriceps was 23.74±12.32 HU and 47.98±7.31 HU, respectively. The muscle area of the gluteus maximus and quadriceps was positively correlated with BMI (r=0.376, p<0.001 and r=0.214, p=0.009, respectively), whereas muscle attenuation (HU) of the gluteus maximus and quadriceps was inversely correlated with BMI (r=−0.440, p<0.001 and r=-0.347, p<0.001, respectively).
Association between muscle properties and BMD
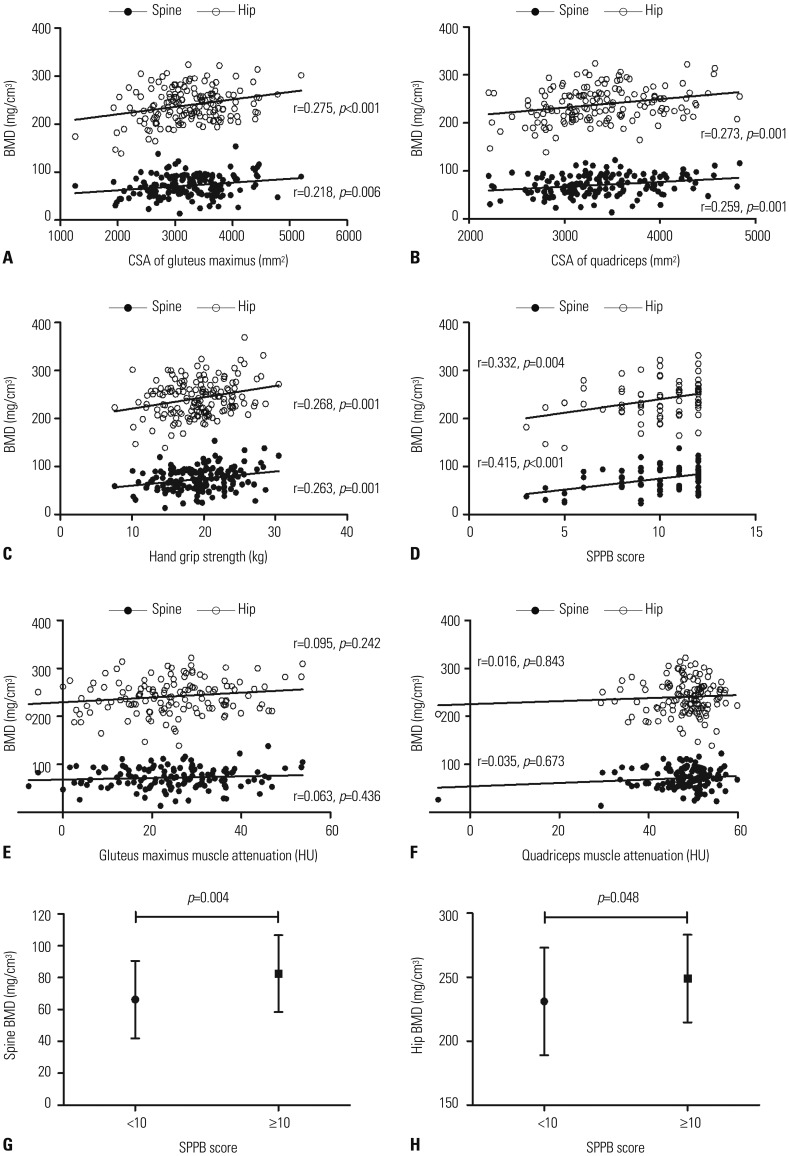
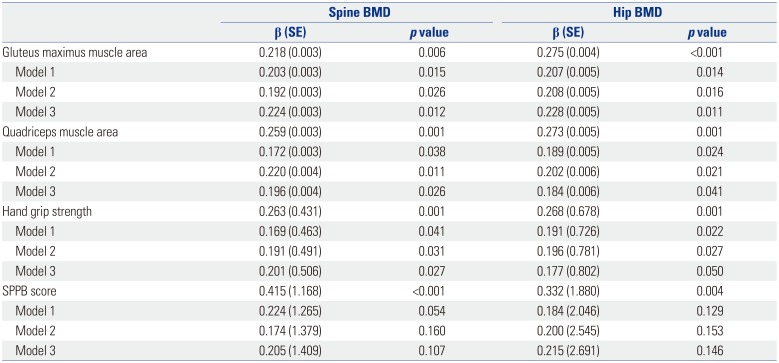
As shown in Fig. 1A and B, the CSA of the gluteus maximus muscle was positively correlated with spine and hip BMD (r=0.218, p=0.006 and r=0.275, p<0.001, respectively). Moreover, the CSA of the quadriceps also showed a positive correlation with the spine and hip BMDs (r=0.259, p=0.001 and r=0.273, p=0.001, respectively). These associations remained significant after adjusting for covariates (Table 2). Furthermore, muscle strength and physical performance, as well as muscle CSA, had a positive correlation with BMD. Both hand grip strength and SPPB score were positively correlated with BMD (Fig. 1C and D). Although the association between SPPB score and BMD was not significant after adjusting for covariates, the association between hand grip strength and BMD remained significant after adjusting for multiple confounding factors (Table 2). However, the HU value of the gluteus maximus or quadriceps muscles was not related to BMD (Fig. 1E and F), suggesting that muscle composition was not associated with BMD, unlike muscle area, strength, and physical performance. As SPPB score did not have Gaussian distribution, we performed further analysis for classes according to SPPB score (Fig. 1G and H). Subjects whose SPPB score was 10 or more showed statistically significant higher spine BMD and hip BMD, compared to those with a SPPB score of less than 10.
Association between muscle properties and insulin resistance
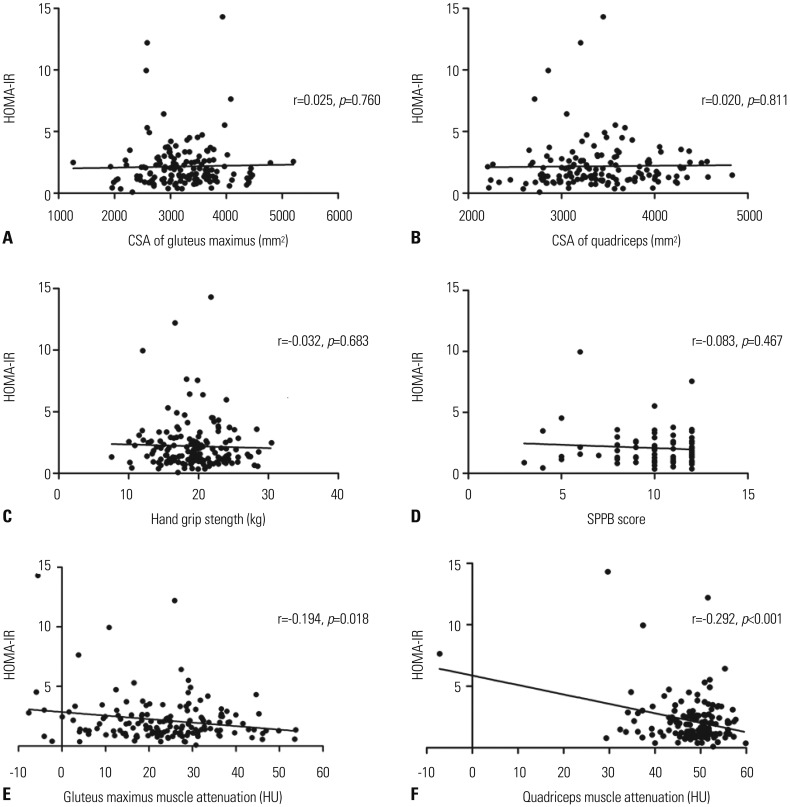
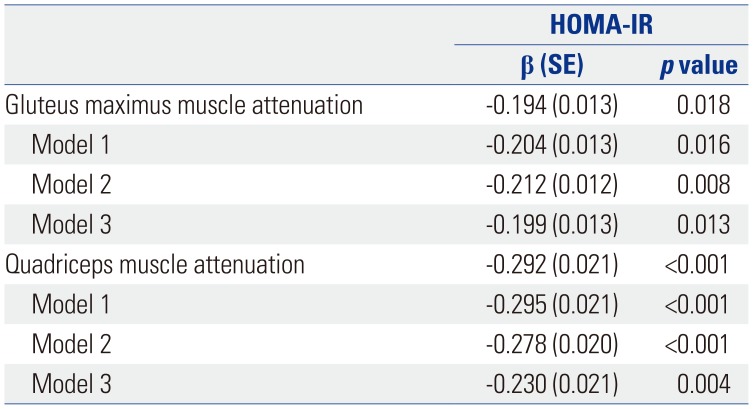
As shown in Fig. 2A–D, muscle CSA, strength, and physical performance were not correlated with insulin resistance, whereas muscle attenuation (HU) of the gluteus maximus and quadriceps was inversely related to HOMA-IR, as shown in Fig. 2E and F (r=−0.194, p=0.018 and r=−0.292, p<0.001, respectively). This association remained significant after adjusting for confounding factors (Table 3).
Muscle properties according to the presence of osteoporosis or diabetes mellitus
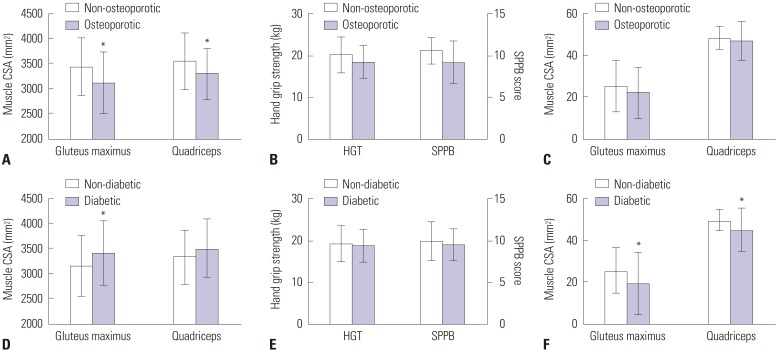
We further analyzed muscle properties depending on the presence of osteoporosis (Fig. 3A, B, and C). We investigated statistical differences between the two groups after adjusting for age. As shown in Fig. 3A, subjects with osteoporosis showed significantly smaller gluteus maximus and quadriceps muscle area than the control group. However, muscle strength, physical performance, and muscle attenuation measured as HU were not different between the two groups (Fig. 3B and C). In addition, muscle properties according to the presence of diabetes were also analyzed after adjusting for age. Subjects with diabetes had significantly higher gluteus maximus muscle area; however, there were no differences in quadriceps area, muscle strength, and physical performance (Fig. 3D and E). Moreover, the muscle attenuation (HU) of subjects with diabetes was significantly lower than that of subjects without diabetes (Fig. 3F).
DISCUSSION
In this study, associations between muscle properties and BMD or insulin resistance were assessed by measuring muscle parameters, including CSA, strength, attenuation (HU) of lean tissue, and physical performance in Korean postmenopausal women. Here, we provide clinical evidence that muscle mass, strength, and physical performance are associated primarily with low bone mass. Furthermore, we also reconfirmed that persistently damaged muscles, represented by accumulated adipocytes and lipid droplets, not simply low muscle mass or strength, are closely related to insulin resistance.
In our study, QCT was used to measure muscle CSA and composition. Compared to dual-energy X-ray absorptiometry, QCT can evaluate muscle composition and is less affected by degenerative bone changes and vascular calcifications. Muscle area and strength showed significant positive correlations with BMD after adjusting for confounding factors, such as age and body weight, which is consistent with the results of previous studies.202122 However, SPPB score, which was used to measure physical performance, was not significant after adjusting for confounding factors. Furthermore, when the subjects were divided into two groups according to the presence of osteoporosis, hand grip strength and SPPB score were not significantly different between the two groups. Previous studies reported that quadriceps strength and physical performance measurements, such as gait speed and brisk step length, are associated with BMD.2324 There is a possibility that hand grip strength in our study could not reflect thigh muscle strength well enough, as it simply assesses the strength of the forearm muscles. In addition, the number of subjects who completed SPPB was relatively small. This may also contribute to the insignificant relationship between SPPB score and BMD after adjusting for confounding factors.
Lang, et al.25 previously reported that only muscle HU value had a significant association with increased risk of hip fracture after adjusting for covariates, such as age, race, sex, and BMI. However, we could not find any association between muscle HU values and BMD. These somewhat discordant findings might be due to the different baseline characteristics of the study population. The subjects enrolled in the study of Lang, et al.25 had higher BMI (26.0–29.5 kg/m2 depending on ethnicity and sex) and lower thigh muscle HU value (32.6–37.5 HU depending on ethnicity and sex) compared with the subjects in our study (BMI of 23.60 kg/m2 and quadriceps HU of 47.98). Therefore, it can be speculated that large accumulation of muscle fat accompanied by aggravated myositis could decrease muscle HU value and further lead to osteoporosis, followed by an increased risk of fracture.
Sarcopenia is known to be significantly associated with insulin resistance and diabetes.2627 In previous studies, sarcopenia was defined using a lean mass index (appendicular lean mass in kg/height in meter squared).28 However, this approach is limited in that it cannot evaluate the association of each muscle property with diabetes or osteoporosis. In the present study, we used QCT and performance tests to analyze not only muscle CSA but also muscle composition and performance, which are closely related to functional impairment and disability. According to our study, muscle CSA, strength, and physical performance were not associated with insulin resistance, whereas muscle HU value was significantly associated with insulin resistance: subjects with lower HU value in muscle, which means more fat infiltration, showed higher insulin resistance. Therefore, our present findings implicate persistently damaged muscles accompanied by fatty infiltration in the development of insulin resistance. Several studies have explored the association of sarcopenia with muscle adiposity and insulin resistance.293031 Cell death processes occur in response to muscle disuse or age-associated sarcopenia.29 When apoptotic cells accumulate and their clearance is impaired, maladaptive muscle remodeling occurs with fatty infiltration within the muscle.4 Meanwhile, inflammatory cytokines and adipokines are released, which might lead to the development of insulin resistance. Therefore, this gave rise to the idea that the presence of local inflammation in muscle, followed by fat accumulation and secretion of dysregulated adipokines and cytokines, rather than decreased muscle mass or strength alone, may play a more important role in insulin resistance development. In this regard, our results can provide clinical evidence that supports the results of other studies.323334
Racial differences in bone mass, body composition, and insulin resistance have been reported in previous studies.353637 However, most studies regarding the relationships between muscle, bone, and fat have only included non-Hispanic white, black, and Hispanic subjects. In this study, we focused on the Korean population. The prevalence of obesity in Korean adults (31%) is reported to be lower than in the general population of the United States (35%).3839 In this study, the percentage of subjects with obesity was 29.7%, which was even lower than that of the general Korean population. Although fatty infiltration within the muscle in our subjects was not severe, we found a clear negative association between muscle HU value and insulin resistance. Therefore, it could be speculated that fat deposition indeed has a close positive relationship with insulin resistance. In contrast, there was no association between muscle HU value and BMD.
To the best of our knowledge, this is the first study to focus on individual muscle properties and their associations with BMD and insulin resistance in Korean postmenopausal women. However, this study has several limitations. First, as the current study only included postmenopausal women who were ≥60 years old, the results cannot be applied to men and premenopausal women who may have different body composition and metabolic conditions than postmenopausal women. Second, we did not perform muscle biopsy, which can directly evaluate muscle composition, and muscle attenuation values were used as an alternative method. However, a previous study showed that muscle attenuation can actually reflect skeletal muscle lipid content.40 Therefore, we believe that muscle attenuation could be used as a non-invasive and reliable method to evaluate muscle composition, although it is not as accurate as muscle biopsy. Third, since this was a cross-sectional study, we could not investigate the causative effect or influence of muscle properties on BMD and insulin resistance. Lastly, calcium and vitamin D intake from diet and supplements was not assessed, and although the use of medications, such as bisphosphonates, SERM, metformin, and thiazolidinediones, was adjusted for, we cannot exclude the possibility that the use of these medications influenced the results.
In conclusion, we found that each muscle property plays a different role in balancing bone metabolism and insulin sensitivity in Korean postmenopausal women. That is, the properties associated with osteoporosis are muscle area, strength, and physical performance, whereas the muscle feature related to insulin resistance is muscle composition, including fat accumulation. Further studies are needed to investigate how different muscle features are distinctively associated with bone mass and insulin resistance.
 XML Download