Journal List > Yonsei Med J > v.60(4) > 1121172

Lee, Lee, Lee, Lee, Cho, Choi, and Yun: Performance of Three Scoring Systems in Predicting Massive Transfusion in Patients with Unstable Upper Gastrointestinal Hemorrhage

Abstract

Purpose

After trauma and surgery, upper gastrointestinal bleeding (UGIB) is the most common condition that can require massive transfusion (MT). The present study aimed to analyze and compare the prognostic performance of the Glasgow-Blatchford (GB), pre-endoscopy Rockall (PER), and modified early warning (MEW) scores for predicting MT in patients with unstable UGIB.

Materials and Methods

This retrospective observational study included patients with UGIB from March 2016 to February 2018. Receiver operating characteristics analysis was performed to examine the prognostic performance of the GB, PER, and MEW scoring systems. Logistic regression analysis was used to identify independent risk factors for MT, after adjusting for relevant covariates. The primary outcome was MT.

Results

Of the 484 included patients with unstable UGIB, 19 (3.9%) received an MT. The areas under the curves (AUCs) of the GB, PER, and MEW scores for MT were 0.577 [95% confidence interval (CI), 0.531–0.621], 0.570 (95% CI, 0.525–0.615), and 0.767 (95% CI, 0.727–0.804), respectively. The AUC of the MEW score was significantly different from those of the GB and PER scores. In multivariate analysis, MEW score was independently associated with MT in patients with unstable UGIB (odds ratio, 1.495; 95% CI, 1.100–2.033; p=0.010).

Conclusion

In unstable UGIB patients, MEW score had the best prognostic performance for MT among three scoring systems.

INTRODUCTION

Upper gastrointestinal bleeding (UGIB) occurs in 150 per 100000 adults per year and can be a fatal condition, with a mortality rate of up to 15%.12 Patients with UGIB require continuous monitoring, fluid therapy, and transfusion after admission, as well as complex treatments, including endoscopic, radiologic, or surgical treatment.34 In addition, apart from trauma and surgery, UGIB is one of the most common conditions requiring massive transfusion (MT).5 A previous study showed that massive bleeding occurs in 5.7% of patients with total UGIB and was fatal in 70% of the patients with massive bleeding in this study.6
In patients with UGIB, early identification of risk factors and prediction of prognosis may induce appropriate intervention, thus reducing mortality and morbidity, as well as shortening hospital stay and reducing costs.7 In this regard, several scoring systems have been developed to predict severity in patients with UGIB. The Glasgow-Blatchford (GB) score was developed to predict which patients with UGIB may require transfusion or intervention with eight clinical features and laboratory findings.8 The pre-endoscopy Rockall (PER) score determined that age, presence of shock symptoms defined by systolic blood pressure (SBP) and heart rate, and comorbidities could predict patient mortality or rebleeding.9 In a previous study, the GB and PER scores were associated with the need for intervention and 30-day mortality in patients with UGIB.10 The modified early warning (MEW) score evaluates the patient's condition according to SBP, body temperature, pulse rate, respiratory rate, and level of consciousness (Supplementary Table 1, only online).11 In one study, MEW score showed good performance for predicting mortality in patients with UGIB.12 In another national study, MEW was shown to be an effective predictor of intensive care unit (ICU) transfer with an optimum cutoff value of 6.13
Many previous studies have evaluated the performance of these scoring systems for mortality, rebleeding, and need for blood transfusion in patients with UGIB; however, there has been a lack of studies about the relationship between scoring systems and MT in UGIB. Therefore, the aim of this study was to analyze and compare the prognostic performance of GB, PER, and MEW scores for predicting MT in patients with UGIB.

MATERIALS AND METHODS

Study design and population

We performed a retrospective cohort study involving patients with UGIB at Chonnam National University Hospital, Gwangju, South Korea who were admitted between March 2016 and February 2018. The inclusion criteria were patients over the age of 18 years who presented to the emergency department (ED) with melena, hematochezia, and hematemesis and patients with unstable vital signs (pulse rate >100 beats/min or SBP <100 mm Hg). UGIB was confirmed using emergency endoscopy and emergency intervention. The following exclusion criteria were applied: age <18 years, no emergency endoscopy or emergency intervention, and missing data. The study was approved by the Institutional Review Board of Chonnam National University Hospital (CNUH-2018-240).

Data collection

The following variables were obtained for each patient: age, sex, medical history (ischemic heart disease, heart failure, hepatic disease, and malignancy), presenting symptoms (hematemesis, melena, hematochezia, and syncope), vital signs on admission [systolic arterial blood pressure (mm Hg), respiratory rate, pulse rate, and body temperature], initial Glasgow Coma Scale (GCS) data, base deficit on admission, laboratory data on admission [lactate, white blood cell count, hemoglobin, platelet count, activated partial thromboplastin time, international normalized ratio of prothrombin time (PT-INR), and fibrinogen, fibrin/fibrinogen degradation product (FDP), D-dimer, aspartate transaminase, alanine aminotransferase, total bilirubin, albumin, blood urea nitrogen (BUN), and creatinine levels], etiology of UGIB, and amounts of transfusion packed red blood cells (PRCs), fresh-frozen plasma, cryoprecipitate, and platelet concentrates during the first 24 hours after admission, hospital length of stay, ICU length of stay, disposition at the ED, and 30-day mortality. Disposition at the ED included admission to the general ward, admission to the ICU, admission to the operating room, death in the ED, and transfer to another hospital.
MT was defined as transfusion of ≥10 units of PRCs from initial presentation in the ED to 24 hours after arrival,1415 transfusion of >4 units of PRCs in 1 hour with anticipation of continued need, or the replacement of 50% total blood volume in 3 hours.16 The GB,8 PER,9 and MEW11 scores were calculated for each patient. The primary outcome was a requirement for MT, and the secondary outcome was 30-day mortality.

Statistical analysis

Continuous variables that did not satisfy the normality test are presented as median values with interquartile ranges. Categorical variables are presented as frequencies and percentages. Differences between MT and no-MT groups were tested using the Mann-Whitney U-test for continuous variables. The Fisher's exact test or chi-square test was used for comparison of categorical variables, as appropriate. Receiver operating characteristic (ROC) analysis was performed to examine the prognostic performance of GB, PER, and MEW scores for predicting MT. The comparison of dependent ROC curves was performed using the method of DeLong, et al.17 Optimum cutoff values were determined using Youden's index. ROC analyses were also performed in stratified groups (patients with varix and those with non-varix). Then, additional analysis was performed to examine the relationship between varix status and MEW score.
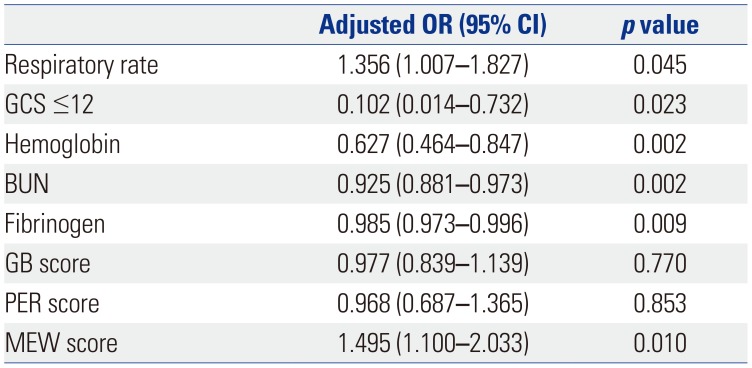
Logistic regression analysis was used to identify independent risk factors for MT after adjusting for relevant covariates. All variables with a p value <0.1 on univariate analysis were included in the logistic regression. Factors with a p value <0.05 in the multivariate logistic regression model were considered final adjusted variables. Respiratory rate, GCS ≤12, and hemoglobin, BUN, and fibrinogen levels were selected as adjusted variables. Backward selection was used to achieve the final model. Subgroup analysis was performed according to the type of intervention and timing of intervention to examine the relationship between intervention and outcome. Data were analyzed using PASW/SPSS™ software, version 18 (SPSS Inc., Chicago, IL, USA). The ROC curves were calculated and compared using MedCalc version 16.1 (MedCalc Software, bvba, Ostend, Belgium). A two-sided significance level of 0.05 was used for statistical significance.

RESULTS

Patient selection and characteristics

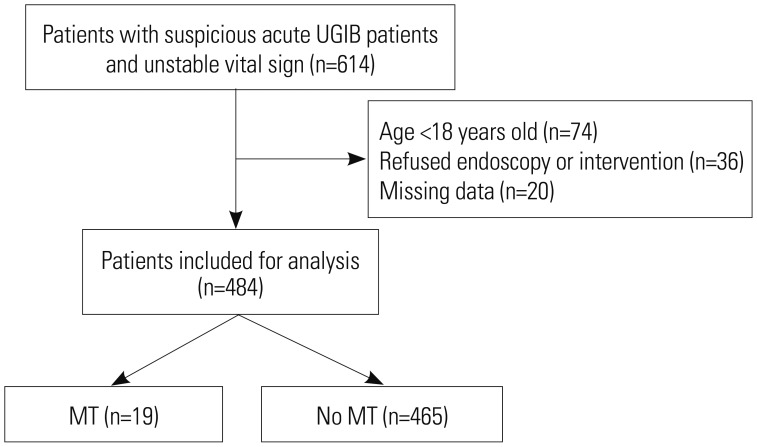
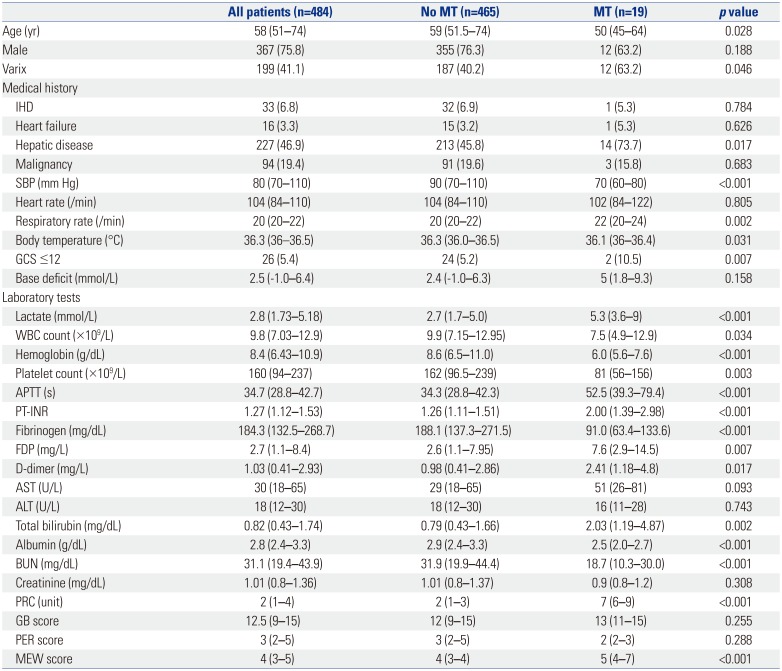
During the study period from March 2016 to February 2018, 614 patients with UGIB met the preliminary inclusion criteria. Based on the exclusion criteria, 484 patients were finally included in the present study (Fig. 1). Table 1 shows the baseline and clinical characteristics of the patients. There were 367 (75.8%) male patients, and the median age of all patients was 58.0 (51.0–74.0) years. There were 199 patients (41%) with variceal bleeding. MT was performed on 19 patients (3.9%).
Patients who underwent MT had higher hepatic disease and respiratory rates and lower SBP, body temperature, and GCS score. The patients in the MT group had higher levels of lactate, PT-INR, FDP, D-dimer, and total bilirubin; lower white blood cell and platelet counts; and lower hemoglobin, fibrinogen, albumin, and BUN levels. MEW score, but not GB and PER scores, showed significant differences between the MT and no-MT groups.

Comparison of clinical outcomes between the MT and no-MT groups

Table 2 shows the clinical outcomes in the MT and no-MT groups. There were significant differences in disposition at the ED between the MT and no-MT groups. Patients in the MT group were more likely to be admitted to the ICU and were more likely to die in the ED. The hospital and ICU lengths of stay showed statistically significant differences between the MT and no-MT groups (p=0.031 and 0.035, respectively). The MT group had higher 30-day mortality than the no-MT group (p<0.001).

Prognostic performance of GB, PER, and MEW scores for predicting MT

Fig. 2 shows the ROC curves of the GB, PER, and MEW scores for predicting MT. Table 3 shows the results of ROC analysis of GB, PER, and MEW scores in predicting MT. The areas under the curves (AUCs) for GB, PER, and MEW scores were 0.577 [95% confidence interval (CI), 0.531–0.621], 0.570 (95% CI, 0.525–0.615), and 0.767 (95% CI, 0.727–0.804), respectively. An MEW score >4 predicted MT with statistical significance (p<0.001). A GB score >8 and PER score >2 predicted MT, but not with statistical significance (p=0.147 and p=0.233). The AUC of the MEW score was significantly different from that of the GB or PER score.
In variceal bleeding, the AUCs for GB, PER, and MEW scores were 0.533 (95% CI, 0.461–0.604), 0.605 (95% CI, 0.534–0.674), and 0.795 (95% CI, 0.732–0.848), respectively (Fig. 2B). In variceal bleeding, the AUC of the MEW score was significantly different from that of the GB or PER score. In non-variceal bleeding, the AUCs for GB, PER, and MEW scores were 0.641 (95% CI, 0.582–0.696), 0.562 (95% CI, 0.503–0.621), and 0.715 (95% CI, 0.659–0.767), respectively (Fig. 2C). In non-variceal bleeding, the AUC of the MEW score was not significantly different from that of the GB or PER score. For the variceal bleeding group, SBP (p=0.004) and respiratory rate (p<0.001) showed significant differences between MT and no-MT groups (Supplementary Table 2, only online). In the non-variceal bleeding group, SBP, heart rate, respiratory rate, body temperature, and GCS ≤12 did not differ significantly between the MT and no-MT groups.

Logistic regression analysis with GB, PER, and MEW score for predicting MT

Table 4 shows the association between variables and MT. After adjustment for respiratory rate, GCS ≤12, and hemoglobin, BUN, and fibrinogen levels were independently associated with MT in patients with unstable UGIB. Furthermore, MEW score was independently associated with MT in patients with unstable UGIB [odds ratio (OR), 1.495; 95% CI, 1.100–2.033; p=0.010].

Comparison of procedure types and times to procedure according to MT requirement

Table 5 shows the association between procedure type and time to procedure according to MT requirement. Endoscopy and angioembolization were associated with MT in patients with unstable UGIB. However, times to endoscopy and angioembolization were not associated with MT in patients with unstable UGIB. Surgery was performed only in 3 patients, and there was no statistical correlation with MT in patients with unstable UGIB.

DISCUSSION

In the present study, MEW score performed better than the GB or PER score in predicting MT in patients with unstable UGIB. MT was associated with 30-day mortality. Furthermore, the MEW score was independently associated with MT in patients with unstable UGIB.
In the present study, the mortality of patients who required MT owing to UGIB was 31%, which was lower than that of a previous study.6 This was probably because the progression of treatment over time reduced the mortality of all patients with UGIB.18 The mortality of patients who received MT owing to surgery was 17%, which was lower than that in our study.19 However, the definition of MT was a transfusion of ≥5 units of PRCs in the previous study.19 In another study,20 the mortality of patients who received MTs owing to trauma was 28%, consistent with results of the present study.
A previous study showed that a high BUN level was associated with the severity of UGIB.21 In the present study, BUN levels of the MT group were within the normal range and lower than those of the non-MT group. Unlike a previous study.21 we measured BUN levels as soon as patients arrived at the ED. We postulated that BUN levels at ED arrival may reflect prerenal azotemia rather than blood loss. Al-Naamani, et al.22 demonstrated that BUN levels at ED arrival were not associated with the need for blood transfusion or high-risk endoscopic lesions. Thus, patients in the MT group could have lower plasma volumes and thus may require less blood product than those in the non-MT group.
In the present study, fibrinogen level was independently associated with MT in patients with UGIB. In trauma, which is associated with consumption of clotting factor like UGIB, fibrinogen level is associated with MT.2324 Hayakawa, et al.23 showed that a fibrinogen level ≤1.5 g/L was associated with MT in trauma. In the present study, the fibrinogen level of the MT group was 0.9 (0.6–1.3) g/L. In another study, MT was most common at a fibrinogen level of ≤1.0 g/L, and a fibrinogen level ≤1.0 g/L (OR, 3.28; 95% CI, 1.71–6.28) had a higher OR for in-hospital mortality than a fibrinogen level of 1.0–1.5 g/L (OR, 2.08; 95% CI, 1.36–3.16).24
In multivariate analysis, hemoglobin level was independently associated with MT. The GB criteria assigns 6 points for a hemoglobin level <10 g/dL.8 As hemoglobin levels of the non-MT and MT groups were 8.6 (6.5–11.0) g/dL and 6.0 (5.6–7.6) g/dL, respectively, the GB criteria for hemoglobin level did not lead to a difference between these two groups. Furthermore, BUN level was independently associated with MT in multivariate analysis, and the BUN level was lower in the MT group than the non-MT group. Thus, we postulated that the GB criteria are not appropriate for predicting MT in UGIB. The PER criteria consist of age, SBP, pulse rate, and comorbidity.9 Age was not independently associated with MT, and the median age of both the non-MT and MT groups was <60 years. In addition, SBP, pulse rate, and comorbidity were not independently associated with MT. Therefore, we thought that PER score was not appropriate for predicting MT in UGIB. Furthermore, PER score was not significantly different between the non-MT and MT groups in the present study.
In critically ill patients, an MEW score ≥5 was associated with in-hospital mortality.2526 In the present study, an MEW score >4 was statistically significant, and MT was associated with 30-day mortality in UGIB. In addition, the MEW score was independently associated with MT in UGIB. Respiratory rate and GCS <12, which were significant factors in multivariate analysis, may have affected the overall MEW score. In addition, MEW score has many benefits in clinical practice: it can be measured immediately upon ED arrival, it is easy to measure, and serial measurement is possible, such that a patient's condition can be monitored over time. In contrast, GB score can be measured only through a laboratory test, which requires a certain amount of time. Regarding PER score, it is difficult to obtain the medical history of patients with coma or stupor, and the information provided may not be reliable for patients with delirium or dementia.
Variceal bleeding can lead to massive bleeding, and correction of the hypovolemia as well as rapid hemostasis and prevention of rebleeding are needed.27 Although, the presence of varix was not an independent factor for predicting MT in multivariate analysis, the proportion of patients with varix in the MT group was higher than that in the non-MT group in the present study. Furthermore, MEW score performed better for predicting MT than GB or PER score in variceal bleeding. Unlike nonvariceal bleeding, variceal bleeding is direct bleeding from a vessel. We considered that variceal bleeding would result in a significant reduction in vascular resistance and therefore a greater reduction in blood pressure, compared to non-variceal bleeding, thus leading to a corresponding increase in respiratory rate. However, the pathophysiologic mechanisms for massive bleeding are not yet fully understood in UGIB. Further study is needed to determine whether this is merely the result of blood loss-induced disseminated intravascular coagulation or the result of a triggering mechanism, such as varix or ulcer or both.
The present study had several limitations. First, this was a retrospective single-center study. In the present study, the proportion of varix was higher than that in previous studies.1012 Therefore, to assess generalizability and causation, further studies are needed that include larger sample sizes, multiple centers, and a prospective design. Second, we did not investigate serial changes in laboratory test results. In particular, we could not investigate hemoglobin or BUN levels, which are likely to change and could affect the scoring systems. Third, patients who refused endoscopy or intervention were excluded. Most of these patients were discharged from the ED or transferred. Thus, we were not able to ascertain the overall MT due to UGIB. Fourth, the GB and PER scores could not predict MT with the current sample size, thus careful interpretation is necessary. Finally, we did not investigate the effects of procedures for hemostasis, such as emergent endoscopy, emergent intervention, and surgery. It is important that future prospective studies address this point.
In conclusion, the present study demonstrates that MEW score had the best prognostic performance for MT among scoring systems in unstable UGIB.

ACKNOWLEDGEMENTS

This study was supported by a grant from Chonnam National University Hospital Biomedical Research Institute (CRI 18 90*-1 BCRI18026).

Notes

AUTHOR CONTRIBUTIONS:

  • Conceptualization: Dong Hun Lee, Sung Min Lee.

  • Data curation: Kyeung Mi Lee, Goeun Choi.

  • Formal analysis: Seong Woo Yun, Dong Hun Lee, Sung Min Lee.

  • Funding acquisition: Sung Min Lee.

  • Investigation: Dong Hun Lee, Goeun Choi.

  • Methodology: Dong Hun Lee, Yong Soo Cho, Goeun Choi.

  • Project administration: Dong Hun Lee, Sung Min Lee.

  • Resources: Dong Hun Lee, Sung Min Lee.

  • Software: Dong Hun Lee.

  • Supervision: Byung Kook Lee, Sung Min Lee.

  • Validation: Byung Kook Lee, Sung Min Lee.

  • Visualization: Seong Woo Yun, Dong Hun Lee.

  • Writing—original draft: Dong Hun Lee, Kyeung Mi Lee, Sung Min Lee.

  • Writing—review & editing: Dong Hun Lee, Sung Min Lee.

The authors have no potential conflicts of interest to disclose.

References

1. Abd Elrazek AE, Mahfouz H, Elazeem KA, Fakhry M, Elrazek EA, Foad M, et al. The value of U/S to determine priority for upper gastrointestinal endoscopy in emergency room. Medicine (Baltimore). 2015; 94:e2241. PMID: 26656368.
crossref
2. Sanders DS, Perry MJ, Jones SG, McFarlane E, Johnson AG, Gleeson DC, et al. Effectiveness of an upper-gastrointestinal haemorrhage unit: a prospective analysis of 900 consecutive cases using the Rockall score as a method of risk standardisation. Eur J Gastroenterol Hepatol. 2004; 16:487–494. PMID: 15097042.
3. Kumar NL, Travis AC, Saltzman JR. Initial management and timing of endoscopy in nonvariceal upper GI bleeding. Gastrointest Endosc. 2016; 84:10–17. PMID: 26944336.
4. Srygley FD, Gerardo CJ, Tran T, Fisher DA. Does this patient have a severe upper gastrointestinal bleed? JAMA. 2012; 307:1072–1079. PMID: 22416103.
crossref
5. Halmin M, Chiesa F, Vasan SK, Wikman A, Norda R, Rostgaard K, et al. Epidemiology of massive transfusion: a binational study from Sweden and Denmark. Crit Care Med. 2016; 44:468–477. PMID: 26901542.
6. Fleischer D. Etiology and prevalence of severe persistent upper gastrointestinal bleeding. Gastroenterology. 1983; 84:538–543. PMID: 6600435.
crossref
7. Anchu AC, Mohsina S, Sureshkumar S, Mahalakshmy T, Kate V. External validation of scoring systems in risk stratification of upper gastrointestinal bleeding. Indian J Gastroenterol. 2017; 36:105–112. PMID: 28393330.
crossref
8. Blatchford O, Murray WR, Blatchford M. A risk score to predict need for treatment for upper-gastrointestinal haemorrhage. Lancet. 2000; 356:1318–1321. PMID: 11073021.
crossref
9. Rockall TA, Logan RF, Devlin HB, Northfield TC. Risk assessment after acute upper gastrointestinal haemorrhage. Gut. 1996; 38:316–321. PMID: 8675081.
crossref
10. Ko IG, Kim SE, Chang BS, Kwak MS, Yoon JY, Cha JM, et al. Evaluation of scoring systems without endoscopic findings for predicting outcomes in patients with upper gastrointestinal bleeding. BMC Gastroenterol. 2017; 17:159. PMID: 29233096.
crossref
11. Subbe CP, Kruger M, Rutherford P, Gemmel L. Validation of a modified Early Warning Score in medical admissions. QJM. 2001; 94:521–526. PMID: 11588210.
crossref
12. Bozkurt S, Köse A, Arslan ED, Erdoğan S, Üçbilek E, Çevik İ, et al. Validity of modified early warning, Glasgow Blatchford, and preendoscopic Rockall scores in predicting prognosis of patients presenting to emergency department with upper gastrointestinal bleeding. Scand J Trauma Resusc Emerg Med. 2015; 23:109. PMID: 26714636.
crossref
13. Lee JR, Choi HR. [Validation of a modified early warning score to predict ICU transfer for patients with severe sepsis or septic shock on general wards]. J Korean Acad Nurs. 2014; 44:219–227. PMID: 24859127.
crossref
14. Mitra B, Cameron PA, Gruen RL, Mori A, Fitzgerald M, Street A. The definition of massive transfusion in trauma: a critical variable in examining evidence for resuscitation. Eur J Emerg Med. 2011; 18:137–142. PMID: 21164344.
15. American College of Surgeons Committee on Trauma. Advanced trauma life support. 10th ed. Chicago: American College of Surgeons;2018.
16. Raymer JM, Flynn LM, Martin RF. Massive transfusion of blood in the surgical patient. Surg Clin North Am. 2012; 92:221–234. PMID: 22414409.
crossref
17. DeLong ER, DeLong DM, Clarke-Pearson DL. Comparing the areas under two or more correlated receiver operating characteristic curves: a nonparametric approach. Biometrics. 1988; 44:837–845. PMID: 3203132.
crossref
18. Straube S, Tramèr MR, Moore RA, Derry S, McQuay HJ. Mortality with upper gastrointestinal bleeding and perforation: effects of time and NSAID use. BMC Gastroenterol. 2009; 9:41. PMID: 19500343.
crossref
19. Turan A, Yang D, Bonilla A, Shiba A, Sessler DI, Saager L, et al. Morbidity and mortality after massive transfusion in patients undergoing non-cardiac surgery. Can J Anaesth. 2013; 60:761–770. PMID: 23609882.
crossref
20. Borgman MA, Spinella PC, Perkins JG, Grathwohl KW, Repine T, Beekley AC, et al. The ratio of blood products transfused affects mortality in patients receiving massive transfusions at a combat support hospital. J Trauma. 2007; 63:805–813. PMID: 18090009.
crossref
21. Kumar NL, Claggett BL, Cohen AJ, Nayor J, Saltzman JR. Association between an increase in blood urea nitrogen at 24 hours and worse outcomes in acute nonvariceal upper GI bleeding. Gastrointest Endosc. 2017; 86:1022–1027. PMID: 28377105.
22. Al-Naamani K, Alzadjali N, Barkun AN, Fallone CA. Does blood urea nitrogen level predict severity and high-risk endoscopic lesions in patients with nonvariceal upper gastrointestinal bleeding? Can J Gastroenterol. 2008; 22:399–403. PMID: 18414716.
crossref
23. Hayakawa M, Gando S, Ono Y, Wada T, Yanagida Y, Sawamura A. Fibrinogen level deteriorates before other routine coagulation parameters and massive transfusion in the early phase of severe trauma: a retrospective observational study. Semin Thromb Hemost. 2015; 41:35–42. PMID: 25590522.
crossref
24. McQuilten ZK, Wood EM, Bailey M, Cameron PA, Cooper DJ. Fibrinogen is an independent predictor of mortality in major trauma patients: a five-year statewide cohort study. Injury. 2017; 48:1074–1081. PMID: 28190583.
crossref
25. Kruisselbrink R, Kwizera A, Crowther M, Fox-Robichaud A, O'Shea T, Nakibuuka J, et al. Modified Early Warning Score (MEWS) identifies critical illness among ward patients in a resource restricted setting in Kampala, Uganda: a prospective observational study. PLoS One. 2016; 11:e0151408. PMID: 26986466.
crossref
26. Subbe CP, Davies RG, Williams E, Rutherford P, Gemmell L. Effect of introducing the Modified Early Warning score on clinical outcomes, cardio-pulmonary arrests and intensive care utilisation in acute medical admissions. Anaesthesia. 2003; 58:797–802. PMID: 12859475.
crossref
27. Kim YD. Management of acute variceal bleeding. Clin Endosc. 2014; 47:308–314. PMID: 25133116.
crossref

SUPPLEMENTARY MATERIALS

Supplementary Table 1

GB, PER, and MEW Scoring System Parameters
ymj-60-368-s001.pdf

Supplementary Table 2

Comparison of Variceal Bleeding and No Variceal Bleeding according to MT Requirement
ymj-60-368-s002.pdf
Fig. 1

Patients with acute UGIB and unstable vital signs between March 2016 and February 2018. UGIB, upper gastrointestinal bleeding; MT, massive transfusion.

ymj-60-368-g001
Fig. 2

Area under the receiver operating characteristic analyses of GB, PER, and MEW scores for predicting massive transfusion. (A) AUC in all patients group. (B) AUC in patients with variceal bleeding. The AUC of the MEW score was significantly different from that of the GB or PER score in all patients with UGIB and variceal bleeding. (C) AUC in patients with non-variceal bleeding. In non-variceal bleeding, the AUC of the MEW score was not significantly different from that of the GB or PER score. AUC, area under the curve; GB, Glasgow-Blatchford; PER, pre-endoscopy Rockall; MEW, modified early warning; UGIB, upper gastrointestinal bleeding.

ymj-60-368-g002
Table 1

Comparison of Baseline Characteristics according to Massive Transfusion

ymj-60-368-i001
All patients (n=484) No MT (n=465) MT (n=19) p value
Age (yr) 58 (51–74) 59 (51.5–74) 50 (45–64) 0.028
Male 367 (75.8) 355 (76.3) 12 (63.2) 0.188
Varix 199 (41.1) 187 (40.2) 12 (63.2) 0.046
Medical history
 IHD 33 (6.8) 32 (6.9) 1 (5.3) 0.784
 Heart failure 16 (3.3) 15 (3.2) 1 (5.3) 0.626
 Hepatic disease 227 (46.9) 213 (45.8) 14 (73.7) 0.017
 Malignancy 94 (19.4) 91 (19.6) 3 (15.8) 0.683
 SBP (mm Hg) 80 (70–110) 90 (70–110) 70 (60–80) <0.001
 Heart rate (/min) 104 (84–110) 104 (84–110) 102 (84–122) 0.805
 Respiratory rate (/min) 20 (20–22) 20 (20–22) 22 (20–24) 0.002
 Body temperature (℃) 36.3 (36–36.5) 36.3 (36.0–36.5) 36.1 (36–36.4) 0.031
 GCS ≤12 26 (5.4) 24 (5.2) 2 (10.5) 0.007
 Base deficit (mmol/L) 2.5 (-1.0–6.4) 2.4 (-1.0–6.3) 5 (1.8–9.3) 0.158
Laboratory tests
 Lactate (mmol/L) 2.8 (1.73–5.18) 2.7 (1.7–5.0) 5.3 (3.6–9) <0.001
 WBC count (×109/L) 9.8 (7.03–12.9) 9.9 (7.15–12.95) 7.5 (4.9–12.9) 0.034
 Hemoglobin (g/dL) 8.4 (6.43–10.9) 8.6 (6.5–11.0) 6.0 (5.6–7.6) <0.001
 Platelet count (×109/L) 160 (94–237) 162 (96.5–239) 81 (56–156) 0.003
 APTT (s) 34.7 (28.8–42.7) 34.3 (28.8–42.3) 52.5 (39.3–79.4) <0.001
 PT-INR 1.27 (1.12–1.53) 1.26 (1.11–1.51) 2.00 (1.39–2.98) <0.001
 Fibrinogen (mg/dL) 184.3 (132.5–268.7) 188.1 (137.3–271.5) 91.0 (63.4–133.6) <0.001
 FDP (mg/L) 2.7 (1.1–8.4) 2.6 (1.1–7.95) 7.6 (2.9–14.5) 0.007
 D-dimer (mg/L) 1.03 (0.41–2.93) 0.98 (0.41–2.86) 2.41 (1.18–4.8) 0.017
 AST (U/L) 30 (18–65) 29 (18–65) 51 (26–81) 0.093
 ALT (U/L) 18 (12–30) 18 (12–30) 16 (11–28) 0.743
 Total bilirubin (mg/dL) 0.82 (0.43–1.74) 0.79 (0.43–1.66) 2.03 (1.19–4.87) 0.002
 Albumin (g/dL) 2.8 (2.4–3.3) 2.9 (2.4–3.3) 2.5 (2.0–2.7) <0.001
 BUN (mg/dL) 31.1 (19.4–43.9) 31.9 (19.9–44.4) 18.7 (10.3–30.0) <0.001
 Creatinine (mg/dL) 1.01 (0.8–1.36) 1.01 (0.8–1.37) 0.9 (0.8–1.2) 0.308
 PRC (unit) 2 (1–4) 2 (1–3) 7 (6–9) <0.001
 GB score 12.5 (9–15) 12 (9–15) 13 (11–15) 0.255
 PER score 3 (2–5) 3 (2–5) 2 (2–3) 0.288
 MEW score 4 (3–5) 4 (3–4) 5 (4–7) <0.001

IHD, ischemic heart disease; SBP, systolic blood pressure; MT, massive transfusion; GCS, Glasgow Coma Scale; WBC, white blood cell; APTT, activated partial thromboplastin time; PT-INR, international normalized ratio of prothrombin time; FDP, fibrin/fibrinogen degradation product; AST, aspartate transaminase; ALT, alanine aminotransferase; BUN, blood urea nitrogen; PRC, packed red blood cell; GB, Glasgow Blatchford; PER, pre-endoscopy Rockall; MEW, modified early warning. Variables are presented as median (interquartile range) or n (%).

Table 2

Comparison of Clinical Outcomes according to MT

ymj-60-368-i002
All patients (n=484) No MT (n=465) MT (n=19) p value
ED disposition <0.001
 Discharge 63 (13.0) 63 (13.5) 0 (0.0)
 Ward admission 261 (53.9) 256 (55.1) 5 (26.3)
 ICU admission 154 (31.8) 145 (31.2) 9 (47.4)
 Death in ED 6 (1.2) 1 (0.2) 5 (26.3)
Hospital LOS (days) 8 (5–12) 8 (5–11) 14 (2–18) 0.031
ICU LOS (days) 0 (0–3) 0 (0–3) 0 (0–6) 0.035
30-day mortality 38 (7.9) 32 (6.9) 6 (31.6) <0.001

MT, massive transfusion; ED, emergency department; ICU, intensive care unit; LOS, length of stay.

Variables are presented as median (interquartile range) or n (%).

Table 3

ROC analysis Results of Different Scoring Systems in Predicting Massive Transfusion

ymj-60-368-i003
Cutoff Sensitivity (%) Specificity (%) PPV (%) NPV (%) AUC p value
GB score >8 100.0 20.6 4.9 100.0 0.577 (0.531–0.621) 0.147
PER score >2 73.7 51.8 5.9 98.0 0.570 (0.525–0.615) 0.233
MEW score >4 68.4 76.1 10.5 98.3 0.767 (0.727–0.804) <0.001

ROC, receiver operating characteristic; PPV positive predictive value; NPV negative predictive value; AUC, area under the curves; GB, Glasgow Blatchford; PER pre-endoscopy Rockall; MEW, modified early warning.

Table 4

Multivariate Logistic Regression Analysis for Massive Transfusion

ymj-60-368-i004
Adjusted OR (95% CI) p value
Respiratory rate 1.356 (1.007–1.827) 0.045
GCS ≤12 0.102 (0.014–0.732) 0.023
Hemoglobin 0.627 (0.464–0.847) 0.002
BUN 0.925 (0.881–0.973) 0.002
Fibrinogen 0.985 (0.973–0.996) 0.009
GB score 0.977 (0.839–1.139) 0.770
PER score 0.968 (0.687–1.365) 0.853
MEW score 1.495 (1.100–2.033) 0.010

OR, odds ratio; CI, confidence interval; GCS, Glasgow Coma Scale; BUN, blood urea nitrogen; GB, Glasgow-Blatchford; PER, pre-endoscopy Rockall; MEW, modified early warning.

Table 5

Comparison of Procedure Types and Times to Procedure according to MT Requirement

ymj-60-368-i005
Variables All patients (n=484) No MT (n=465) MT (n=19) p value
Endoscopy 476 (98.3) 459 (98.7) 17 (89.5) 0.002
Time to endoscopy (min)* 328 (153–769), 476 328 (151–768), 459 512 (173–775), 17 0.683
Angioembolization 23 (4.8) 20 (4.3) 3 (15.8) 0.021
Time to angioembolization (min) 322 (183–847), 23 267 (166–819), 20 336 (322–366), 3 0.465
Surgery 3 (0.6) 3 (0.6) 0 (0) 0.725

MT, massive transfusion.

Variables are presented as median (interquartile range) or n (%).

*Time interval from emergency department visit to endoscopy, Number for analysis, Time interval from emergency department visit to angioembolization.

TOOLS
Similar articles