

 PDF
PDF ePub
ePub Citation
 Print
Print


INTRODUCTION
Human epidermal growth factor receptor 2 (HER2) is amplified in approximately 15–20% of breast carcinomas.12 Trastuzumab (Herceptin®; Genentech, South San Francisco, CA, USA) is a monoclonal antibody that binds to the extracellular domain of the HER2 receptor, and patients with HER2 overexpression respond well to trastuzumab treatment.34
HER2 tests are most commonly performed using immunohistochemistry (IHC), fluorescence in situ hybridization, or silver in situ hybridization (SISH) assays. Among them, IHC-based assessment is most widely used because it is inexpensive, is easy to undertake, and can be performed using familiar optical microscopy.5 With the integration of image analysis systems into clinical laboratories, objective evaluation, interpretation accuracy, and reproducibility can be improved.6 However, prior to using an image analysis system as part of routine testing, there are several important steps to consider, including ensuring consistent staining quality of IHC slides, providing a detailed protocol for selecting the analysis area, and developing a proven analysis algorithm. In this study, we used Algorithm HER2 (4B5) for image analysis along with VIRTUOSO software (Ventana Medical Systems, Tucson, AZ, USA) and an iScan Coreo slide scanner (Ventana Medical Systems), an approach that was approved by FDA in 2011.
Most previous studies have been performed using biopsy specimens or tumor microarray. In those studies, all tumor cells were totally selected and analyzed. However, selecting all tumor cells included is time consuming and burdensome in routine practice for excised specimens. Therefore, simple and faster methods are needed for clinical settings. The aim of this study was to develop a simple protocol for HER2 image analysis that is not inferior to the HER2 manual scoring method for examining breast cancer specimens. We compared the results of the HER2 image analysis method to the results of the HER2 manual scoring method and to HER2 SISH results, which is considered the gold standard for assessing surgical specimens of breast cancer.
MATERIALS AND METHODS
Patients and study samples
Initially, in order to establish an image analysis-based method for HER2 measurement, we reviewed medical records for patients with confirmed invasive breast cancer who underwent surgical resections between January 2013 and December 2013 at Seoul St. Mary's Hospital in Seoul, Korea, and selected breast cancer patients with equivocal HER2 IHC-staining results but confirmed HER2 SISH results. Thirty-two patients from 376 assessed patients (8.51%) were included. In the next step, we evaluated the clinical usefulness of the newly established image analysis method in breast cancer patients who underwent surgical treatment at the same hospital between January 2011 and December 2012. During this period, 565 patients were histologically diagnosed with invasive breast cancer with both HER2 IHC and HER2 SISH tests to confirm HER2 status. Of these, 10 cases were excluded due to very small invasive foci or the absence of a slide to review. All specimens were routinely processed and diagnosed according to national and international guidelines. The present study was approved by the hospital's Institutional Review Board (approval KC17SESI0151).
Immunohistochemistry
The HER2 IHC-staining and HER2 SISH methods were performed following given instructions in the pathology laboratory manual. Briefly, for IHC analysis of HER2 expression, we selected a formalin-fixed, paraffin-embedded (FFPE) block containing both tumor and normal breast tissue to serve as an internal negative control. A HER2 SISH-positive breast cancer specimen was used as a positive control. The HER2 IHC staining was performed on an automated Ventana Benchmark XT platform using FDA-approved Ventana PATHWAY rabbit monoclonal antibody 4B5 clone and the Ventana ultraVIEW DAB Detection Kit (Ventana Medical Systems). HER2 expression was scored into one of four groups (0, 1+, 2+, 3+) according to the 2013 American Society of Clinical Oncology/College of American Pathologists Guideline Update1: 0, no staining observed or membrane staining that is incomplete, faint, or barely perceptible in ≤10% of tumor cells; 1+, incomplete membrane staining that is faint or barely perceptible within >10% of tumor cells; 2+, circumferential membrane staining that is incomplete and/or weak/moderate and within >10% of tumor cells or with complete and circumferential membrane staining that is intense and within ≤10% of tumor cells; and 3+, circumferential membrane staining that is complete and intense within >10% of tumor cells.
HER2 SISH analysis
HER2 SISH analysis was carried out on the same FFPE block that had been used for HER2 IHC. The SISH assay was performed with INFORM HER2 DNA probes (Ventana Medical Systems) according to the manufacturer's protocols. The probes were labeled with dinitrophenol and formulated for use with the Ventana ultraView SISH detection kit and the Ventana BenchMarkXT automated slide stainer. At least 20 tumor cells with positive black dot signals were counted in a homogeneous and contiguous population and then classified into one of three categories: negative if the HER2 copy number was <4.0 signals/cell, equivocal if there were 4–6 signals/cell, and positive if there were >6.0 signals/cell. When the first counting result was equivocal, signals of additional 20 cells were counted to determine the sample's HER2 status.
IHC scoring of HER2 using the image analysis system
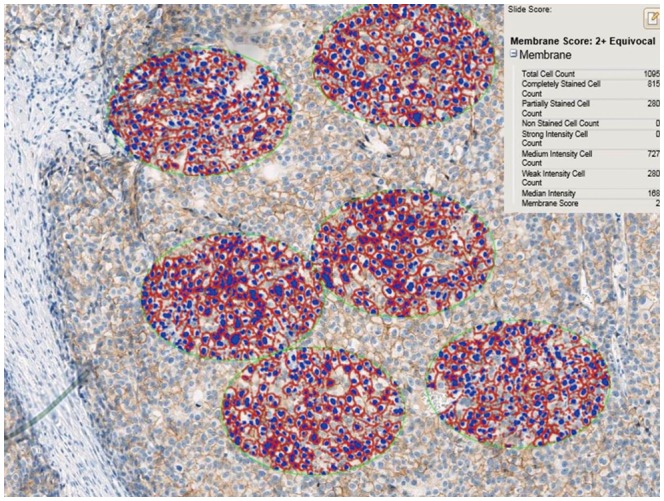
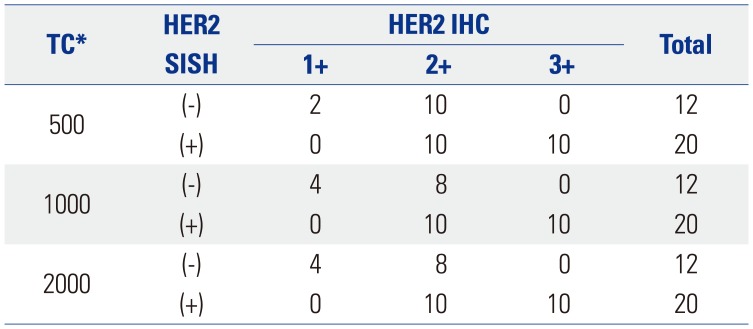
We performed a preliminary analysis on a series of HER2 IHC-staining equivocal (2+) breast cancer specimens (n=32) to determine an optimal interpretation method. The 32 slides were scanned using an iScan Coreo slide scanner with a 20× objective. All invasive cancer components of the entire slide image were carefully inspected to select foci of intense, thick, and more complete membrane staining [i.e., foci of view (FOVs)], and several ellipses with a constant area (40457.64 µm2) were drawn until certain tumor cells were included (usually 6–10 ellipses) (Fig. 1). We analyzed the HER2 status of at least 500 tumor cells, 1000 tumor cells, and 2000 tumor cells in elliptically selected FOVs using Companion Algorithm HER2 (4B5) image analysis software. The results from the examined 500, 1000, and 2000 tumor cells were in agreement with the HER2 SISH results in 37.50% (12 out of 32 cases), 43.75% (14/32), and 43.75% (14/32) of the specimens, respectively (Table 1). Therefore, we decided to use the approach of analyzing a certain area (40457.64 µm2) until FOVs with at least 1000 tumor cells were assessed. We did not exclude intervening normal structures while analyzing the FOVs. Subsequently, 555 breast cancer specimen slides were scanned and analyzed using the optimized image-based assessment and interpretation method, and the results were compared with those from the manual method.
Statistical analysis
For the comparison of the manual-scoring-based and image analysis-based IHC stain scoring results, Cohen's kappa statistics were derived. Furthermore, sensitivity and specificity values were determined for both IHC methods by using the HER2 SISH results as a reference standard. Finally, McNemar's test was performed on the SISH-positive and SISH-negative cases to determine whether there was a statistically significant difference in sensitivity and specificity values between the two methods.
RESULTS
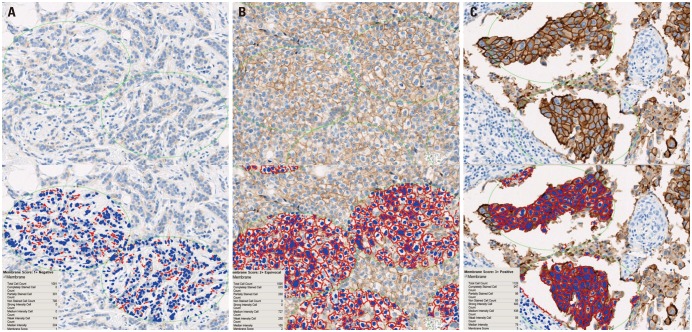
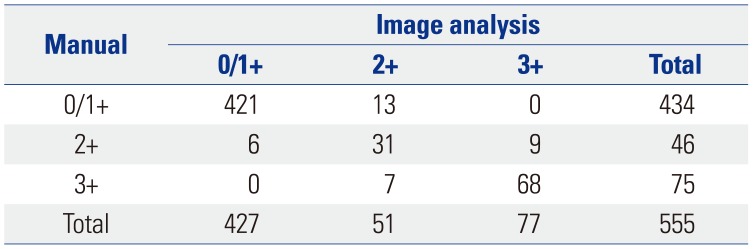
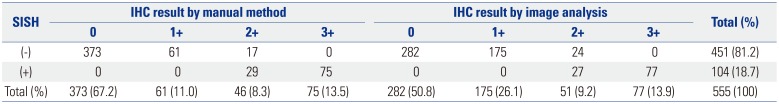
Based on the manual scoring assessments of breast cancer specimens from 555 patients, 373 were categorized as score 0 (67.2%), 61 as score 1+ (11.0%), 46 as score 2+ (equivocal; 8.3%), and 75 as score 3+ (13.5%). During application of the image analysis method, the mean number of cells analyzed per case was 1107 (range, 1000 to 1328). The image analysis results showed that 282 specimens were categorized as score 0 (50.8%), 145 as score 1+ (26.1%), 51 as score 2+ (9.2%), and 77 as score 3+ (13.9%) (Fig. 2). The results obtained by manual scoring and image analysis had a concordance of 93.7% (Cohen's kappa=0.830) (Table 2).
The HER2 SISH results revealed that 451 (81.2%) of the 555 cases were negative and 104 (18.7%) were positive. Among the HER2 IHC manual scoring results, all cases that were IHC positive (score 3+) were also SISH positive, and all cases that were IHC negative (scores 0 or 1+) were also SISH negative. Among the 46 manual-scored equivocal (score 2+) cases, 29 cases (63.0%) were SISH positive. Similarly, the image analysis-obtained HER2 IHC results showed that all cases that were IHC positive (score 3+) were also SISH positive, and all cases that were IHC negative (scores 0 or 1+) were SISH negative. Among the 51 equivocal (2+) cases identified by the image analysis method, 27 cases (52.9%) were SISH positive (Table 3).
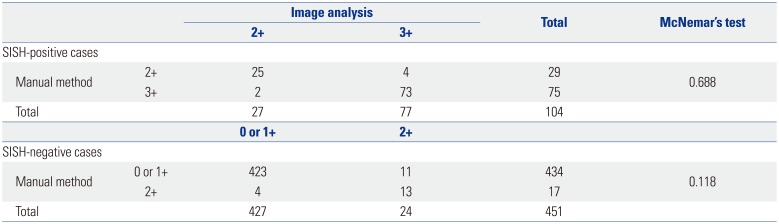
The sensitivity, specificity, and accuracy of the manual scoring results were 72.1, 96.2, and 91.7%, respectively, while those derived by image analysis were 74.0, 94.7, and 90.8%, respectively. McNemar's test was applied to compare the HER2 IHC-staining results obtained by the manual scoring method to those obtained via the image analysis method. The test results showed non-significant differences between methods among both the SISH-positive cases (p=0.688) and the SISH-negative cases (p=0.118) (Table 4).
DISCUSSION
Typically, during HER2 image analysis in routine clinical laboratory practice, the pathologist selects and marks the FOVs, and the laboratory technician performs the HER2 image analysis in the marked FOVs. Subsequently, the pathologist reviews the results before their final approval. In this study, we sought to determine the minimal number of tumor cells to be evaluated during image analysis by analyzing 32 HER2 IHC manual-scored equivocal (2+) cases. We used the stamp function in the image analysis system to select same-sized areas repeatedly. A trained technician used the stamp function repeatedly to select areas with the most strongly stained tumor cells until 500, 1000, and 2000 tumor cells were included, regardless of the amount of tumor stroma components that was included. For technician training, a pathologist (K. Yim) taught the technician our newly developed method for HER2 image analysis, as well as basic histologic features of breast cancer and the HER2 IHC analysis guidelines for half a day. If it was difficult to see where the breast cancer was, the technician consulted and discussed with the pathologist and analyzed that case together. Finally, 50 cases were randomly selected to confirm that the analysis was correct. The results of HER2 image analysis with 500, 1000, and 2000 tumor cells were then compared with results of HER2 SISH. The results of HER2 image analysis agreed with those of HER2 SISH more closely when 1000 tumor cells were analyzed than when 500 tumor cells were analyzed, and there was no difference between the results when 1000 and 2000 tumor cells were analyzed (Table 1). On that basis, we applied the stamp function HER2 image analysis process to acquire at least 1000 tumor cells in areas with the most strongly stained tumor cells in 555 invasive breast cancer case specimens and compared the results with those of HER2 IHC manual scoring and HER2 SISH assays. The HER2 image analysis and HER2 manual scoring results showed a high level of agreement (Cohen's kappa=0.830) (Table 2). This supports the suggestion that, if a laboratory has a relatively high frequency of equivocal HER2 IHC results, integrating HER2 digital image analysis into the HER2 assessment routine of the laboratory can reduce the frequency of equivocal cases, which can lead to fewer HER2 ISH confirmatory tests (e.g., 34% by manual assessment vs. 10.1% by image analysis).7 Another HER2 digital image analysis study reported that not only would there be a reduction in the frequency of equivocal (2+) cases (16.2% by manual assessment vs. 10.4% by image analysis), but also that image analysis can improve intra-observer reproducibility (κ=0.766 by manual assessment vs. κ=0.882 by image analysis).8 However, in this study, the rate of equivocal cases was similar (8.3% by manual scoring vs. 9.2% by image analysis). Moreover, we did not detect any statistical difference in sensitivity or specificity between the results of HER2 manual scoring and those from image analysis (based on the McNemar's test result) (Table 4). Our laboratory performed HER2 IHC and SISH in all invasive breast cancers at the time of this study and performed quality control checks regularly, comparing both results. In addition, HER2 IHC manual scoring was prescreened by a resident and signed by a breast pathologist (A. Lee) or by fellows undergoing breast pathology training. Considering that the percentage of equivocal cases measured by image analysis was approximately 10%, this study would not have shown any remarkable benefit because the equivocal percentage in routine manual assessment results performed by our laboratory was already at 8%. In previous image analysis studies for HER2 IHC, all tumor cells included were analyzed, requiring time and effort in selecting all tumor areas.78 We searched for a convenient and relatively accurate method of reading a single whole slide. We expect that if we apply the image analysis method described in this study (i.e., 1) using a consistent-area stamp function and disregarding the amount of included stroma components, 2) evaluating at least 1000 tumor cells, and 3) analyzing the most strongly stained area) in a laboratory's diagnostic routine, the time and effort spent assessing HER2 status would be greatly reduced without lowering diagnostic accuracy. In addition, there were no significant method-based discrepancies between the results for HER2 negative (0/1+) and HER2 positive (3+) specimens. Since all the discrepancies observed in this study were in equivocal (2+) specimens, the use of the image analysis method is acceptable because all equivocal cases should be further examined by ISH, according to the HER2 interpretation guideline.1
In conclusion, we have shown that HER2 results obtained via image analysis are similar to those obtained via the manual scoring method. Adoption of an image analysis approach would save time and effort in a clinical setting. Although further confirmation and external validation is required, we suggest examining the most strongly stained area, evaluating at least 1000 tumor cells, and disregarding the amount of stroma content.
 XML Download